Hot Features

GBP/USD Breaks Its 52-Week Low: Has That Provided An Edge In The Past?
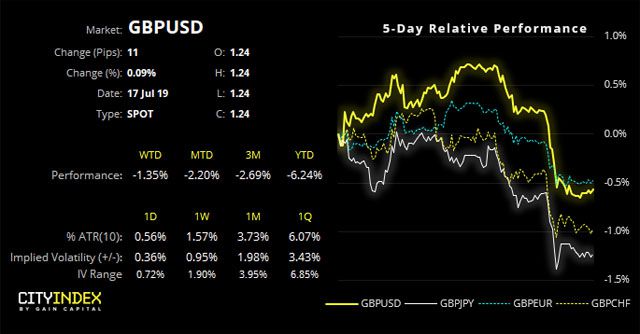
To be more precise, GBP/USD has actually closed to a 25-month low. But having recently tested how the S&P500 responded to its 52-week milestone, we extend our curiosity the cable.
Brexit woes have continued to weigh on GBP, with reports of Boris Johnson suggesting parliament will be suspended and declaring the Irish Backstop to be “dead”. However, a strong USD following positive retails sales has also played its part to push cable decisively lower.

Technically and fundamentally, it appears further downside for cable is on the horizon. As highlighted in this week’s COT report, traders remain decisively bearish yet not at historically extreme levels. On the daily chart, its trend structure remains decisively bearish and yesterday’s close made little effort of the 2019 support level.
Whilst support could be found around the April 2017 low, we remain bearish beneath the 1.2579 swing high and the trend structure would assume an eventual break lower. That said, we’d suggest keeping an eye on bullish reversal patterns back above support (such as bullish pinbar on the daily) as this could warn of a bear-trap and hesitancy to break the 1.2366 low.
However, given we tested the S&P500’s performance around a 52-week high, we’d like to quantify GBP/USD’s past performance around a similar milestone. Please note, as this is a research piece, we’ll be assessing price action characteristics and therefore not producing a full trading system.
Entry criteria: Enter short when prices close to a fresh 52-week low
Portfolio: $10,000
Trades: Max 1 trade at a time
Exit after: 4 Days holding (including entry day)
To avoid bombarding you with charts and numbers, we initially ran an optimisation to find the ‘most ideal’ hold time (between 1-10 days) in relation to maximum profit and minimum drawdown. The results suggested 4 days was the optimum hold time for this entry criteria.
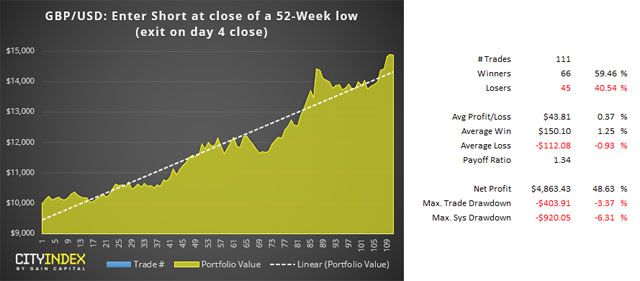
Upon first-glance, the numbers appear promising:
- Steadily rising equity curve with relatively minor drawdown
- Nearly 60% winners
- Average winners are larger than averages losses
However, these numbers can and do mask the realities of trading a live account (especially one without a stop-loss). For example, the tests ignore transaction fees and the liquidity of a live market, which makes the results appear more favourable. But, if we dig a little deeper and look at maximum intraday loss/gain, we get a better feel for the volatility that needs to be accounted for.

Maximum intraday loss/gain shows the most extreme level of a trade before it was closed. Whilst the average intraday loss and gain are -1.17% and +1.2% respectively, we can see an intraday swing of -9.8% going against a trade more recently which is not likely for the feint hearted.
The obvious solution here is to include a stop loss to protect your capital, as the cost of eroding upside potential. However, full-system design is outside the scope of this research article, but we hope it fulfils its objective in showing something valuable for your own research.
City Index: Spread Betting, CFD and Forex Trading on 12,000+ global markets including Indices, Shares, Forex and Bitcoin. Click here to find out more.