Hot Features

The following is an extract from the number one Amazon Investing Bestseller 101 Charts For Trading Success written in November – December 2010, and now out in Paperback.
The book seemed to have two purposes, the first was apparently an attempt to break up my marriage as my wife was 7 months pregnant when I started it. Just as dangerous as far as the actual content of the book is concerned was the determination to make a call on the next big bull market for the FTSE 100. After correctly calling a low on the 20 year uptrend line in Q1 2009 at 4,000, the view here was that we could look forward to an early 1990s style bull market for 2013 – 2015 when the 7,000 zone might be reached again. The issue now is where there will be a triple top towards the all time FTSE 100 peak?
Get the paperback edition of 101 Charts For Trading Success by clicking here
FTSE 100: 1985-2015?
There have been some steps to ensure that 101 Charts has a long shelf life, such as delivering analysis on key charting events in recent history and explaining the set ups and preferred strategy at the time in question. But the prediction game is one of nothing ventured, nothing gained. For instance, a bull call in 2000 that the FTSE 100 would hit 10,000 by 2010 while it remained above 6,000 was not a reckless one, particularly as the stop loss of 6,000 was sensible, even though in the end the view was wrong. Indeed, with the 10,000 call one could have added the condition that if 6,000 was broken on a monthly close the target was 3,000. In this way one would have been fully equipped with most of what the past decade delivered.
There is a second aspect to attempting to predict the future that it is very often the case that a wrong/failed prediction or set up such as the Hindenberg Omen of August 2010 can be just the type of contrarian signal, like the SocGen equities “bloodbath” call, that may give a cynic the cue to go long of the Dow at the start of September and be on the back of the biggest rally in that month for 71 years. The markets are a curious mix of poker, bridge and chess.
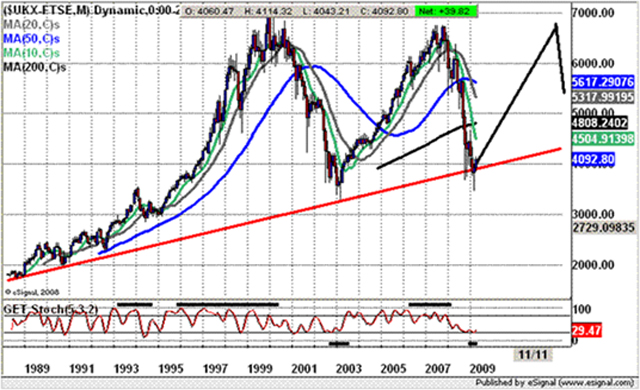
The chart of the FTSE 100 chart shown above appeared in the 2009 Master Investor, and perhaps rather eerily I “knew” that the projection was on the money in terms of the likelihood of a rebound off a 20 year uptrend line running just below 4,000. Unfortunately, this apparent degree of certainty does not happen very often, and far less for all of us than having the feeling we are correct and this not proving to be the case.
The idea behind the projection was that with 2003 and 2009 support at and above previous 1993 resistance means that the FTSE 100 was and is in overall bull mode and is heading higher. After all, old resistance as new support is one of the most reliable technical buy signals.
The second part of the projection was that after two setbacks from just below 7,000 the third visit would see a setback from a peak in this area during 2012. The idea is that the tendency is for at least three tests is that prior to any major breakout – in this case the all-time high the market would “like” to get as many traders sucked in short and this would be done via a partial retreat from the big level. Once a significant number of shorts have been gathered the big breakout can take place. While the FTSE 100 may not come back as low as 5,000 in such a “fakeout” retreat – the early 2011 level of the 1988 uptrend line, somewhere in the upper 5,000 zone is perfectly possible before a big 2013-2015 move high of a similar or even greater magnitude to that of the 1990’s bull market.
Of course, there may be myriad events/disasters to chance such a scenario, but while the 1988 support line holds, the constructive pattern is set if only with the 20 year plus uptrend line as its stop loss.