Pay vs Performance Disclosure
|
12 Months Ended |
|
Dec. 31, 2024
USD ($)
|
Dec. 31, 2023
USD ($)
|
Dec. 31, 2022
USD ($)
|
Dec. 31, 2021
USD ($)
|
Dec. 31, 2020
USD ($)
|
| Pay vs Performance Disclosure |
|
|
|
|
|
| Pay vs Performance Disclosure, Table |
| | | | | | | | | | | | | | | | | | | | | | | | | | | | | | | | | | | | | | | | | | VALUE OF INITIAL $100
FIXED INVESTMENT BASED ON: | | | | | | YEAR | | | SUMMARY
COMPENSATION TABLE TOTAL FOR
PRINCIPAL
EXECUTIVE
OFFICER
(PEO) | | | COMPENSATION
ACTUALLY
PAID TO
PEO | | | AVERAGE
SUMMARY
COMPENSATION TABLE TOTAL NON-PEO FOR
OTHER
NAMED
EXECUTIVE
OFFICERS
(NON-PEO NEOs)) | | | AVERAGE
COMPENSATION
ACTUALLY
PAID TO
NON-PEO NEOs | | | TOTAL
SHAREHOLDER
RETURN
(TSR) | | | TSR
OF PEER
GROUP | | | NET INCOME
(IN THOUSANDS) | | | COMPANY -
SELECTED
MEASURE-
ADJUSTED
RETURN ON
ASSETS | (a) | | | (b)1 | | | (c)2 | | | (d)3 | | | (e)4 | | | (f)5 | | | (g)6 | | | (h)7 | | | (i)8 | 2024 | | | $ | 1,869,311 | | | $ | 2,125,798 | | | $ | 763,283 | | | $ | 811,297 | | | $ | 147.91 | | | $ | 121.52 | | | $ | 43,544 | | | 1.09% | 2023 | | | | 1,839,140 | | | | 1,626,649 | | | | 741,966 | | | | 705,403 | | | | 136.30 | | | | 103.71 | | | | 44,852 | | | 1.15% | 2022 | | | | 1,809,632 | | | | 1,889,352 | | | | 706,885 | | | | 750,137 | | | | 142.65 | | | | 108.65 | | | | 43,557 | | | 1.17% | 2021 | | | | 1,661,531 | | | | 1,970,250 | | | | 618,349 | | | | 720,925 | | | | 124.33 | | | | 108.25 | | | | 39,299 | | | 1.10% | 2020 | | | | 1,577,467 | | | | 1,495,406 | | | | 704,049 | | | | 674,936 | | | | 93.93 | | | | 82.00 | | | | 33,244 | | | 0.93% |
| | 1. | The dollar amounts reported in column (b) are the amounts of total compensation reported for Mr. Simard (our CEO) for each corresponding year in the “Total” column of the Summary Compensation Table. | 2. | The dollar amounts reported in column (c) represent the amount of “compensation actually paid” to Mr. Simard, as computed in accordance with Item 402(v) of Regulation S-K. The dollar amounts do not reflect the actual amount of compensation earned by or paid to Mr. Simard during the applicable year. In accordance with the requirements of Item 402(v) of Regulation S-K, the following adjustments were made to Mr. Simard’s total compensation for fiscal year 2024 to determine the compensation actually paid in 2024: |
| | | | | | | | | | | | | | | | | YEAR | | | REPORTED SUMMARY
COMPENSATION
TABLE TOTAL FOR PEO | | | REPORTED VALUE OF
EQUITY AWARDS(a) | | | EQUITY AWARD
ADJUSTMENTS(b) | | | COMPENSATION
ACTUALLY PAID
TO PEO | 2024 | | | $ | 1,869,311 | | | $ | (479,659) | | | $ | 736,146 | | | $ | 2,125,798 |
| | (a) | The grant date fair value of equity awards represents the total of the amounts reported in the “Stock Awards” column in the Summary Compensation Table. | (b) | The equity award adjustments for fiscal year 2024 include the addition (or subtraction, as applicable) of the following: (i) the fiscal year-end fair value of any equity awards granted in 2024 that are outstanding and unvested as of the end of fiscal year 2024; (ii) the amount of change as of the end of fiscal year 2024 (from the end of the prior fiscal year) in the fair value of any awards granted in prior fiscal years that are outstanding and unvested as of the end of fiscal year 2024; (iii) for awards that are granted and vest in fiscal year 2024, the fair value as of the vesting date; (iv) for awards granted in prior fiscal years that vest in fiscal year 2024, the amount equal to the change as of the vesting date (from the end of the prior fiscal year) in the fair value; (v) for awards granted in prior fiscal years that are determined to fail to meet the applicable vesting conditions during fiscal year 2024, a deduction for the amount equal to the fair value at the end of the prior fiscal year; and (vi) the dollar value of any dividends or other earnings paid on stock or option awards in fiscal year 2024 prior to the vesting date that are not otherwise reflected in the fair value of such award or included in any other component of total compensation for fiscal year 2024. The amounts added or subtracted to determine the adjusted amount are as follows: |
| | | | | | | | | | | | | | | | | | | | | | | | | YEAR | | | YEAR END
FAIR VALUE
OF
EQUITY
AWARDS
GRANTED
DURING
THE YEAR | | CHANGE
IN FAIR
VALUE OF
OUTSTANDING
AND
UNVESTED
EQUITY
AWARDS AT YEAR END
GRANTED
IN
PRIOR YEARS | | FAIR VALUE
AT THE
END OF
THE PRIOR
YEAR OF
EQUITY
AWARDS
THAT
FAILED TO
MEET
VESTING
CONDITIONS
IN THE YEAR | | CHANGE
IN FAIR
VALUE OF
EQUITY
AWARDS
GRANTED IN
PRIOR
YEARS
THAT
VESTED
IN THE YEAR | | VALUE OF
DIVIDENDS OR
OTHER
EARNINGS
PAID ON
EQUITY
AWARDS NOT
OTHERWISE
REFLECTED
IN FAIR VALUE
OR TOTAL
COMPENSATION | | TOTAL EQUITY
AWARD
ADJUSTMENTS | 2024 | | | $ | 597,717 | | | $ | 121,582 | | | $ | - | | | $ | (26,266) | | | $ | 43,113 | | | $ | 736,146 |
| | 3. | The dollar amounts reported in column (d) represent the average of the amounts reported for the Company’s (NEOs) as a group (excluding Mr. Simard, who has served as our CEO since 2013) in the “Total” column of the Summary Compensation Table in each applicable year. The names of each of the NEOs (excluding Mr. Simard), including for purposes of calculating the average amounts in each applicable year are as follows: (i) for 2024 Josephine Iannelli, Marion Colombo, John M. Mercier, and Jason Edgar | 4. | The dollar amounts reported in column (e) represent the average amount of “compensation actually paid” to the NEOs as a group (excluding Mr. Simard), as computed in accordance with Item 402(v) of Regulation S-K. The dollar amounts do not reflect the actual average amount of compensation earned by or paid to the NEOs as a group (excluding Mr. Simard) during the applicable year. In accordance with the requirements of Item 402(v) of Regulation S-K, the following adjustments were made to average total compensation for the NEOs as a group (excluding Mr. Simard) for each year to determine the compensation actually paid, using the same methodology described above in Note 2: |
| | | | | | | | | | | | | | | | | YEAR | | | AVERAGE REPORTED
SUMMARY
COMPENSATION
TABLE TOTAL
FOR NON-PEO NEOs | | | AVERAGE
REPORTED
VALUE
OF EQUITY
AWARDS | | | AVERAGE
EQUITY
ADJUSTMENTS | | | AVERAGE
COMPENSATION
ACTUALLY
PAID TO
NON-PEO NEOs | 2024 | | | $ | 763,283 | | | $ | (138,086) | | | $ | 186,101 | | | $ | 811,297 |
| | The amounts deducted or added in calculating the total average equity award adjustments are as follows: |
| | | | | | | | | | | | | | | | | | | | | | | | | YEAR | | | AVERAGE
YEAR END
FAIR VALUE OF
EQUITY
AWARDS
GRANTED
DURING
THE YEAR | | AVERAGE
CHANGE
IN FAIR
VALUE OF
OUTSTANDING
AND UNVESTED
EQUITY AWARDS AT YEAR END
GRANTED IN +PRIOR YEARS | | AVERAGE
FAIR VALUE
AT THE END
OF THE
PRIOR YEAR
OF EQUITY
AWARDS THAT
FAILED TO
MEET VESTING
CONDITIONS
IN THE
YEAR | | AVERAGE
CHANGE
IN FAIR
VALUE OF
EQUITY
AWARDS
GRANTED IN
PRIOR YEARS
THAT VESTED
IN THE
YEAR | | AVERAGE
VALUE OF
DIVIDENDS
OR OTHER
EARNINGS
PAID ON EQUITY
AWARDS NOT
OTHERWISE
REFLECTED
IN FAIR VALUE
OR TOTAL
COMPENSATION | | TOTAL
AVERAGE
EQUITY
AWARD
ADJUSTMENTS | 2024 | | | $ | 172,074 | | | $ | 4,892 | | | $ | - | | | $ | (3,274) | | | $ | 12,409 | | | $ | 186,101 |
| | 5. | Cumulative TSR is calculated by dividing the sum of the cumulative amount of dividends for the measurement period, assuming dividend reinvestment, and the difference between the Company’s share price at the end and the beginning of the measurement period by the Company’s share price at the beginning of the measurement period. | 6. | Represents the weighted peer group TSR, weighted according to the respective companies’ stock market capitalization at the beginning of each period for which a return is indicated. The peer group used for this purpose is the Compensation Peer Group. Our Compensation Peer Group for the 2024 reporting year is disclosed under the heading “Market Benchmarking and Performance Comparisons” and found on page 46 of this proxy statement. | 7. | The dollar amounts reported represent the amount of net income reflected in the Company’s audited financial statements for the applicable year. | 8. | This is a non-GAAP measure that excludes gains or losses on sale of securities, gains or losses on sale of premises and equipment, gains or losses on other real estate owned, losses on extinguishments of debt, acquisition, conversion and other non-recurring expenses, net of tax. |
|
|
|
|
|
| Company Selected Measure Name |
ADJUSTED RETURN ON ASSETS
|
|
|
|
|
| Named Executive Officers, Footnote |
The dollar amounts reported in column (d) represent the average of the amounts reported for the Company’s (NEOs) as a group (excluding Mr. Simard, who has served as our CEO since 2013) in the “Total” column of the Summary Compensation Table in each applicable year. The names of each of the NEOs (excluding Mr. Simard), including for purposes of calculating the average amounts in each applicable year are as follows: (i) for 2024 Josephine Iannelli, Marion Colombo, John M. Mercier, and Jason Edgar
|
|
|
|
|
| Peer Group Issuers, Footnote |
Represents the weighted peer group TSR, weighted according to the respective companies’ stock market capitalization at the beginning of each period for which a return is indicated. The peer group used for this purpose is the Compensation Peer Group. Our Compensation Peer Group for the 2024 reporting year is disclosed under the heading “Market Benchmarking and Performance Comparisons” and found on page 46 of this proxy statement.
|
|
|
|
|
| PEO Total Compensation Amount |
$ 1,869,311
|
$ 1,839,140
|
$ 1,809,632
|
$ 1,661,531
|
$ 1,577,467
|
| PEO Actually Paid Compensation Amount |
$ 2,125,798
|
1,626,649
|
1,889,352
|
1,970,250
|
1,495,406
|
| Adjustment To PEO Compensation, Footnote |
| | | | | | | | | | | | | | | | | YEAR | | | REPORTED SUMMARY
COMPENSATION
TABLE TOTAL FOR PEO | | | REPORTED VALUE OF
EQUITY AWARDS(a) | | | EQUITY AWARD
ADJUSTMENTS(b) | | | COMPENSATION
ACTUALLY PAID
TO PEO | 2024 | | | $ | 1,869,311 | | | $ | (479,659) | | | $ | 736,146 | | | $ | 2,125,798 |
| | (a) | The grant date fair value of equity awards represents the total of the amounts reported in the “Stock Awards” column in the Summary Compensation Table. | (b) | The equity award adjustments for fiscal year 2024 include the addition (or subtraction, as applicable) of the following: (i) the fiscal year-end fair value of any equity awards granted in 2024 that are outstanding and unvested as of the end of fiscal year 2024; (ii) the amount of change as of the end of fiscal year 2024 (from the end of the prior fiscal year) in the fair value of any awards granted in prior fiscal years that are outstanding and unvested as of the end of fiscal year 2024; (iii) for awards that are granted and vest in fiscal year 2024, the fair value as of the vesting date; (iv) for awards granted in prior fiscal years that vest in fiscal year 2024, the amount equal to the change as of the vesting date (from the end of the prior fiscal year) in the fair value; (v) for awards granted in prior fiscal years that are determined to fail to meet the applicable vesting conditions during fiscal year 2024, a deduction for the amount equal to the fair value at the end of the prior fiscal year; and (vi) the dollar value of any dividends or other earnings paid on stock or option awards in fiscal year 2024 prior to the vesting date that are not otherwise reflected in the fair value of such award or included in any other component of total compensation for fiscal year 2024. The amounts added or subtracted to determine the adjusted amount are as follows: |
| | | | | | | | | | | | | | | | | | | | | | | | | YEAR | | | YEAR END
FAIR VALUE
OF
EQUITY
AWARDS
GRANTED
DURING
THE YEAR | | CHANGE
IN FAIR
VALUE OF
OUTSTANDING
AND
UNVESTED
EQUITY
AWARDS AT YEAR END
GRANTED
IN
PRIOR YEARS | | FAIR VALUE
AT THE
END OF
THE PRIOR
YEAR OF
EQUITY
AWARDS
THAT
FAILED TO
MEET
VESTING
CONDITIONS
IN THE YEAR | | CHANGE
IN FAIR
VALUE OF
EQUITY
AWARDS
GRANTED IN
PRIOR
YEARS
THAT
VESTED
IN THE YEAR | | VALUE OF
DIVIDENDS OR
OTHER
EARNINGS
PAID ON
EQUITY
AWARDS NOT
OTHERWISE
REFLECTED
IN FAIR VALUE
OR TOTAL
COMPENSATION | | TOTAL EQUITY
AWARD
ADJUSTMENTS | 2024 | | | $ | 597,717 | | | $ | 121,582 | | | $ | - | | | $ | (26,266) | | | $ | 43,113 | | | $ | 736,146 |
|
|
|
|
|
| Non-PEO NEO Average Total Compensation Amount |
$ 763,283
|
741,966
|
706,885
|
618,349
|
704,049
|
| Non-PEO NEO Average Compensation Actually Paid Amount |
$ 811,297
|
705,403
|
750,137
|
720,925
|
674,936
|
| Adjustment to Non-PEO NEO Compensation Footnote |
| | | | | | | | | | | | | | | | | YEAR | | | AVERAGE REPORTED
SUMMARY
COMPENSATION
TABLE TOTAL
FOR NON-PEO NEOs | | | AVERAGE
REPORTED
VALUE
OF EQUITY
AWARDS | | | AVERAGE
EQUITY
ADJUSTMENTS | | | AVERAGE
COMPENSATION
ACTUALLY
PAID TO
NON-PEO NEOs | 2024 | | | $ | 763,283 | | | $ | (138,086) | | | $ | 186,101 | | | $ | 811,297 |
| | The amounts deducted or added in calculating the total average equity award adjustments are as follows: |
| | | | | | | | | | | | | | | | | | | | | | | | | YEAR | | | AVERAGE
YEAR END
FAIR VALUE OF
EQUITY
AWARDS
GRANTED
DURING
THE YEAR | | AVERAGE
CHANGE
IN FAIR
VALUE OF
OUTSTANDING
AND UNVESTED
EQUITY AWARDS AT YEAR END
GRANTED IN +PRIOR YEARS | | AVERAGE
FAIR VALUE
AT THE END
OF THE
PRIOR YEAR
OF EQUITY
AWARDS THAT
FAILED TO
MEET VESTING
CONDITIONS
IN THE
YEAR | | AVERAGE
CHANGE
IN FAIR
VALUE OF
EQUITY
AWARDS
GRANTED IN
PRIOR YEARS
THAT VESTED
IN THE
YEAR | | AVERAGE
VALUE OF
DIVIDENDS
OR OTHER
EARNINGS
PAID ON EQUITY
AWARDS NOT
OTHERWISE
REFLECTED
IN FAIR VALUE
OR TOTAL
COMPENSATION | | TOTAL
AVERAGE
EQUITY
AWARD
ADJUSTMENTS | 2024 | | | $ | 172,074 | | | $ | 4,892 | | | $ | - | | | $ | (3,274) | | | $ | 12,409 | | | $ | 186,101 |
|
|
|
|
|
| Compensation Actually Paid vs. Total Shareholder Return |
PEO and Non-PEO Compensation Actually Paid and TSR and Peer TSR 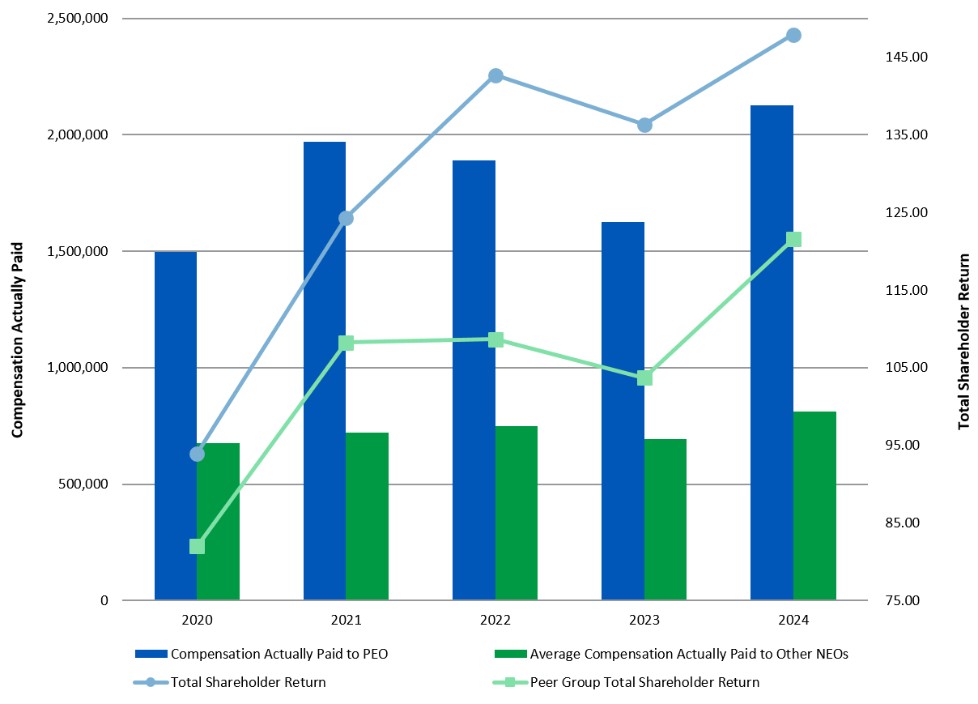
|
|
|
|
|
| Compensation Actually Paid vs. Net Income |
PEO and Non-PEO Compensation Actually Paid and Net Income 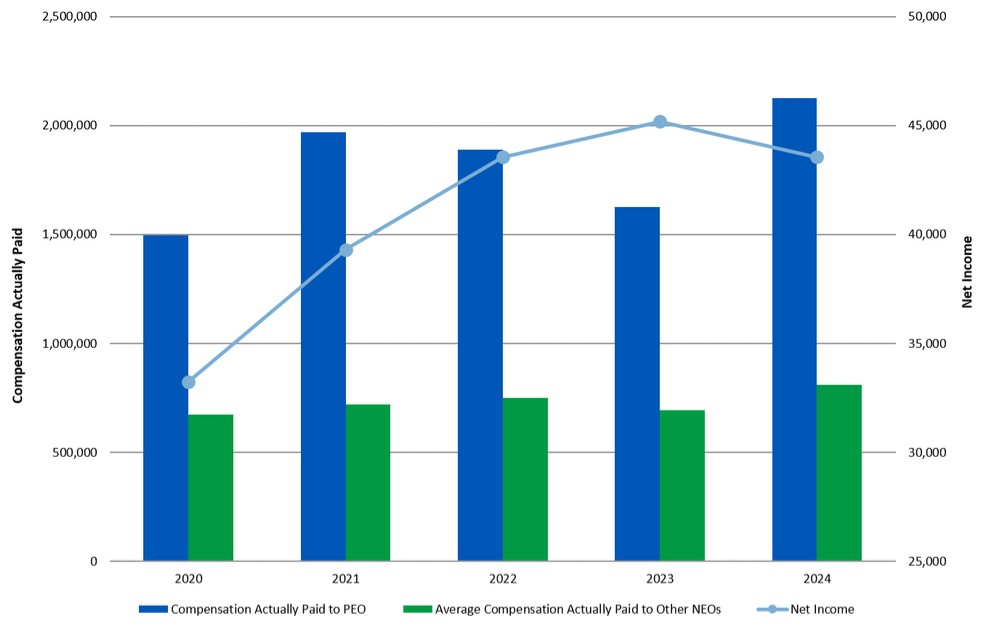
|
|
|
|
|
| Compensation Actually Paid vs. Company Selected Measure |
PEO and Non-PEO Compensation Actually Paid and Adjusted Return on Assets 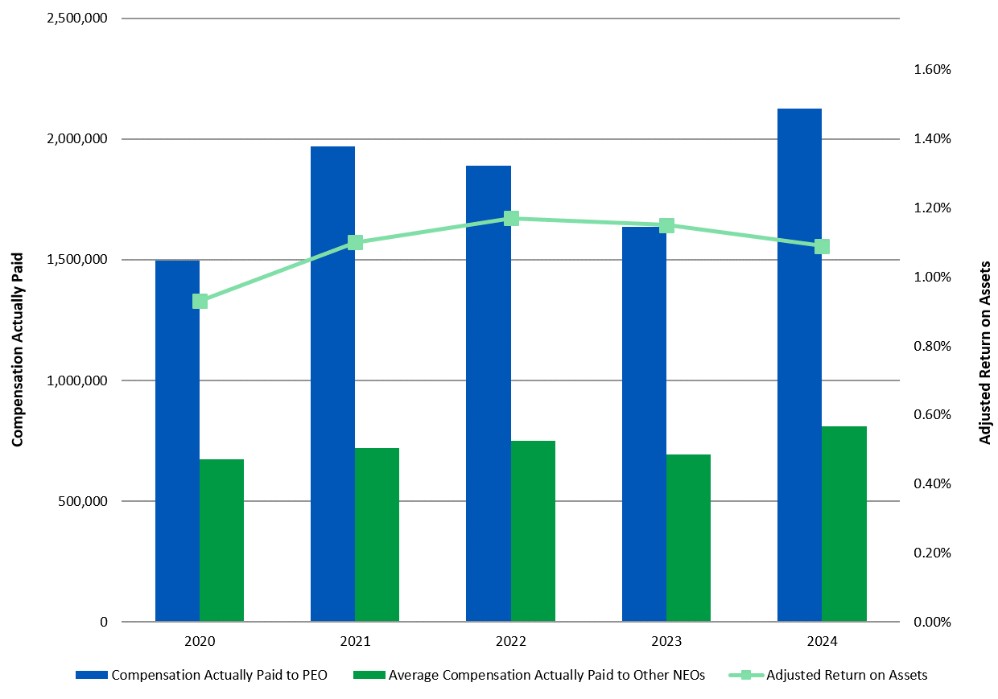
|
|
|
|
|
| Total Shareholder Return Vs Peer Group |
PEO and Non-PEO Compensation Actually Paid and TSR and Peer TSR
|
|
|
|
|
| Tabular List, Table |
Key Performance Measurements The Company considers the following the most important financial performance measures it used to link executive compensation actually paid to its NEOs, for the most recently completed fiscal year, to company performance: | ● | Adjusted net income (non-GAAP)8 |
| ● | Adjusted return on assets (non-GAAP) 8 |
| ● | Adjusted return on equity (non-GAAP)8 |
| ● | Non-performing loans to total loans ratio |
|
|
|
|
|
| Total Shareholder Return Amount |
$ 147.91
|
136.30
|
142.65
|
124.33
|
93.93
|
| Peer Group Total Shareholder Return Amount |
121.52
|
103.71
|
108.65
|
108.25
|
82.00
|
| Net Income (Loss) |
$ 43,544,000
|
$ 44,852,000
|
$ 43,557,000
|
$ 39,299,000
|
$ 33,244,000
|
| Company Selected Measure Amount |
0.0109
|
0.0115
|
0.0117
|
0.0110
|
0.0093
|
| PEO Name |
Mr. Simard
|
|
|
|
|
| Measure:: 1 |
|
|
|
|
|
| Pay vs Performance Disclosure |
|
|
|
|
|
| Name |
Adjusted net income (non-GAAP)
|
|
|
|
|
| Measure:: 2 |
|
|
|
|
|
| Pay vs Performance Disclosure |
|
|
|
|
|
| Name |
Adjusted return on assets (non-GAAP)
|
|
|
|
|
| Non-GAAP Measure Description |
This is a non-GAAP measure that excludes gains or losses on sale of securities, gains or losses on sale of premises and equipment, gains or losses on other real estate owned, losses on extinguishments of debt, acquisition, conversion and other non-recurring expenses, net of tax.
|
|
|
|
|
| Measure:: 3 |
|
|
|
|
|
| Pay vs Performance Disclosure |
|
|
|
|
|
| Name |
Adjusted return on equity (non-GAAP)
|
|
|
|
|
| Measure:: 4 |
|
|
|
|
|
| Pay vs Performance Disclosure |
|
|
|
|
|
| Name |
Non-performing loans to total loans ratio
|
|
|
|
|
| Measure:: 5 |
|
|
|
|
|
| Pay vs Performance Disclosure |
|
|
|
|
|
| Name |
Efficiency ratio
|
|
|
|
|
| PEO | REPORTED VALUE OF EQUITY AWARDS |
|
|
|
|
|
| Pay vs Performance Disclosure |
|
|
|
|
|
| Adjustment to Compensation, Amount |
$ (479,659)
|
|
|
|
|
| PEO | EQUITY AWARD ADJUSTMENTS |
|
|
|
|
|
| Pay vs Performance Disclosure |
|
|
|
|
|
| Adjustment to Compensation, Amount |
736,146
|
|
|
|
|
| PEO | YEAR END FAIR VALUE OF EQUITY AWARDS GRANTED DURING THE YEAR |
|
|
|
|
|
| Pay vs Performance Disclosure |
|
|
|
|
|
| Adjustment to Compensation, Amount |
597,717
|
|
|
|
|
| PEO | CHANGE IN FAIR VALUE OF OUTSTANDING AND UNVESTED EQUITY AWARDS AT YEAR END GRANTED IN PRIOR YEARS |
|
|
|
|
|
| Pay vs Performance Disclosure |
|
|
|
|
|
| Adjustment to Compensation, Amount |
121,582
|
|
|
|
|
| PEO | CHANGE IN FAIR VALUE OF EQUITY AWARDS GRANTED IN PRIOR YEARS THAT VESTED IN THE YEAR |
|
|
|
|
|
| Pay vs Performance Disclosure |
|
|
|
|
|
| Adjustment to Compensation, Amount |
(26,266)
|
|
|
|
|
| PEO | VALUE OF DIVIDENDS OR OTHER EARNINGS PAID ON EQUITY AWARDS NOT OTHERWISE REFLECTED IN FAIR VALUE OR TOTAL COMPENSATION |
|
|
|
|
|
| Pay vs Performance Disclosure |
|
|
|
|
|
| Adjustment to Compensation, Amount |
43,113
|
|
|
|
|
| Non-PEO NEO | REPORTED VALUE OF EQUITY AWARDS |
|
|
|
|
|
| Pay vs Performance Disclosure |
|
|
|
|
|
| Adjustment to Compensation, Amount |
(138,086)
|
|
|
|
|
| Non-PEO NEO | EQUITY AWARD ADJUSTMENTS |
|
|
|
|
|
| Pay vs Performance Disclosure |
|
|
|
|
|
| Adjustment to Compensation, Amount |
186,101
|
|
|
|
|
| Non-PEO NEO | YEAR END FAIR VALUE OF EQUITY AWARDS GRANTED DURING THE YEAR |
|
|
|
|
|
| Pay vs Performance Disclosure |
|
|
|
|
|
| Adjustment to Compensation, Amount |
172,074
|
|
|
|
|
| Non-PEO NEO | CHANGE IN FAIR VALUE OF OUTSTANDING AND UNVESTED EQUITY AWARDS AT YEAR END GRANTED IN PRIOR YEARS |
|
|
|
|
|
| Pay vs Performance Disclosure |
|
|
|
|
|
| Adjustment to Compensation, Amount |
4,892
|
|
|
|
|
| Non-PEO NEO | CHANGE IN FAIR VALUE OF EQUITY AWARDS GRANTED IN PRIOR YEARS THAT VESTED IN THE YEAR |
|
|
|
|
|
| Pay vs Performance Disclosure |
|
|
|
|
|
| Adjustment to Compensation, Amount |
(3,274)
|
|
|
|
|
| Non-PEO NEO | VALUE OF DIVIDENDS OR OTHER EARNINGS PAID ON EQUITY AWARDS NOT OTHERWISE REFLECTED IN FAIR VALUE OR TOTAL COMPENSATION |
|
|
|
|
|
| Pay vs Performance Disclosure |
|
|
|
|
|
| Adjustment to Compensation, Amount |
$ 12,409
|
|
|
|
|
