Chainlink Signals Deeper Losses: Can Bulls Stage A Comeback?
September 18 2024 - 8:30AM
NEWSBTC
Chainlink is facing increasing bearish pressure as its price
continues to edge lower, signalling a potential move toward the
further downside. After a period of consolidation, the bears
have regained control, pushing Chainlink closer toward the $9.28
support level. However, bulls may not be ready to give up
just yet. With market sentiment fluctuating, the possibility of a
bullish comeback looms on the horizon. By examining key technical
indicators and market sentiment, we seek to determine if LINK is
poised for a deeper decline or if bullish forces could reverse the
current trend and drive the price upward. At the time of writing,
Chainlink was trading around $10.59, marking a 0.10% decline over
the past day. The cryptocurrency’s market capitalization stood at
approximately $6.4 billion, while trading volume exceeded $206
million, showing increases of 0.10% and 15.36%, respectively.
Current Market Sentiment: Bearish Pressure Mounts On Chainlink On
the 4-hour chart, following a successful drop below the $11 mark,
LINK has continued to experience negative momentum, dropping toward
the 100-day Simple Moving Average (SMA). As the cryptocurrency
approaches the 100-day SMA, it could either find temporary support
or risk further declines if the bearish momentum continues to
intensify. Also, the Relative Strength Index (RSI) on the 4-hour
chart, has dropped below the 50% threshold, now sitting at 42%.
With the RSI attempting to move deeper into the oversold territory,
it shows that bears are gaining control, and an extended decrease
could be on the horizon if buying interest does not pick up soon.
Related Reading: Is Chainlink (LINK) $12 Breakout Imminent? Data
Reveals A Rising Open Interest On the daily chart, Chainlink is
currently making a bearish movement, toward the $7.14 trading below
the 100-day Simple Moving Average. This movement underscores strong
selling pressure and negative market sentiment, signaling a
heightened risk of further losses. Lastly, the 1-day RSI reflects
increasing pessimistic pressure on LINK, as the indicator has
fallen to 47% after briefly crossing above the 50% threshold. This
drop highlights mounting selling activity and signals a stronger
potential for additional downward movement. Will LINK See A
Recovery Or Further Decline? As the cryptocurrency approaches the
$9.28 support level, which could spark a potential rebound,
technical indicators like the RSI still point to strong selling
pressure. If LINK fails to hold this level, a break below could
result in persistent declines, potentially testing the $7.14
support level and even lower thresholds. Related Reading: Chainlink
(LINK) Could Drop To $8 If It Loses Current Support: On-Chain Data
Reveals However, should Chainlink manage to hold above this crucial
support level, it could set the stage for a potential upward move
toward the $11.10 resistance. A successful breakout through this
resistance could ignite a significant rally, paving the way for the
price to aim for the next key resistance at $12.44. If bullish
momentum continues to build, Chainlink may even reach higher
levels, extending the rally beyond current resistance points.
Featured image from Medium, chart from Tradingview.com
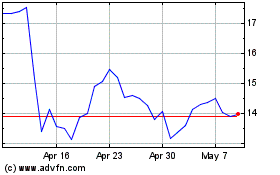
ChainLink Token (COIN:LINKUSD)
Historical Stock Chart
From Oct 2024 to Nov 2024

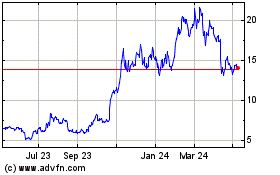
ChainLink Token (COIN:LINKUSD)
Historical Stock Chart
From Nov 2023 to Nov 2024


