FTSE MV Exchanges Key Figures
|
FTSE MV Exchanges Balance Sheet| %1$s Balance Sheet | | Sorry No Data Available |
|
 Share Price Performance| Share Price Performance | | Sample Period † | High | Low | | 1 week | 91,091.04 | 89,231.90 |
| 4 weeks | 91,091.04 | 86,892.38 |
| 12 weeks | 91,091.04 | 79,774.39 |
| 1 year | 91,091.04 | 69,963.65 |
Share Price Chart (5 years)| Share Price Chart (5 years) | 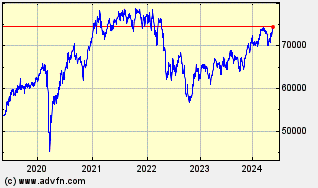 |
|
FTSE MV Exchanges Historic Returns| %1$s Historic Returns | | Giorni da oggi † | Open | Change | % | Open Avg. | Avg. Daily Vol [m] | Total Vol [m] | VWAP | | 1 week | 90,466.30 | -378.94 | -0.42 | 89,231.90 | - | | - |
| 4 weeks | 87,360.24 | 2,727.12 | 3.12 | 86,892.38 | - | | - |
| 12 weeks | 84,130.40 | 5,956.96 | 7.08 | 79,774.39 | - | | - |
| 26 weeks | 79,927.90 | 10,159.46 | 12.71 | 78,819.88 | - | | - |
| 1 year | 73,756.59 | 16,330.77 | 22.14 | 69,963.65 | - | | - |
| 3 years | 70,756.70 | 19,330.66 | 27.32 | 56,509.68 | - | | - |
| 5 years | 59,842.28 | 30,245.08 | 50.54 | 44,072.45 | - | | - |
| † periods calculated are whole weeks rather than calendar months | |
|
