 MSC290
15 years ago
MSC290
15 years ago
Companies with Madison area operations also had a strong 2009
January 8, 2010 - By JUDY NEWMAN - Wisconsin State Journal
Several companies with significant operations in the Madison area also counted 2009 as a strong year for their stock.
http://host.madison.com/wsj/news/article_52e2d3a8-fca8-11de-b3ba-001cc4c03286.html
• Shares of Sears Holdings, parent company of Lands' End, Dodgeville, more than doubled, ending 2009 at $83.45, up 115 percent from their 2008 close at $38.87. Last Thursday, the stock topped $100 in trading during the day after Sears and several other retailers raised their projections for fourth-quarter profits.
Sales for retail companies overall were "surprisingly strong" for most of the year, said Todd Parrish, analyst with Robert W. Baird & Co., Milwaukee.
"Relative to the environment we're in, sales managed pretty well. There wasn't a desperate kind of unloading (merchandise)," Parrish said.
• Mattel, parent of American Girl, Middleton, saw a 25 percent gain, closing 2009 at $19.98, up from $16.00 a year earlier.
• Kraft, parent of Kraft/Oscar Mayer, Madison, inched up to $27.18 from the 2008 close of $26.85. The stock hit its 52-week low in March, when it fell to $20.81 a share.
• Shares of Bruker, whose Bruker AXS division is based in Fitchburg, tripled to $12.06, from $4.04 the year before. Bruker AXS makes analytical X-ray systems for scientists and researchers.
• Spectrum Brands was suspended from trading on the New York Stock Exchange in December 2008 after it fell in the range of pennies and got stuck there. After going through bankruptcy proceedings in 2009, the old stock was eliminated and new shares ended the year at $22.50.
MSC290
15 years ago
Max weighs in as new weapon against cheats
12-20-2009 - By BARRY LICHTER - Sunday Star Times - Sport Racing
Drug cheats beware – the racing laboratory has a new toy which will bust you in a millisecond.
http://www.stuff.co.nz/sport/racing/3179545/Max-weighs-in-as-new-weapon-against-cheats
It sits in NZ Racing Laboratory Services' new building in West Auckland, just along the corridor from the solid phase extraction robots dubbed Mr Ed, Phar Lap, Desmond and Tornado which have been extracting illegal drugs from samples since the 1990s.
The German-made machine, which we'll nickname Max because it has such a daunting name – it's a Bruker MaXis liquid chromatography ultra high resolution quadrupole time-of-flight mass spectrometer – cost the New Zealand Racing Board the best part of $800,000.
And with its just completed installation, our racing laboratory becomes one of the most advanced in the world, its state-of-the-art tool one which should make unscrupulous trainers very, very afraid.
"I feel like I've got a Ferrari," enthuses racing chemist and analyst Rob Howitt, as he explains the vital statistics of Max.
"We were the first racing lab in the world to apply high resolution technology to drug screening. Now we can expand this methodology with a far superior instrument."
The predecessor to Max, called the TOF, was bought in 2006. It took the laboratory, under the direction of head Dr Geoff Beresford, more than a year to develop high resolution methods for horse racing, tackling problems like dirtier urine and the need for increased sensitivity.
"Many of the major racing labs will be switching to high resolution techniques," says Howitt. "This is the sort of technology that will eventually make some of our older instruments redundant."
Max will take over the crucial job of routine screening the 8000 samples taken annually from the country's racing population of thoroughbreds, standardbreds and greyhounds.
Standing proudly amid his predecessors, with his 2.5m flight tube protruding between concrete beams in the ceiling, Max is in reality allowing the analysts to stage their own races – between molecules. The time it takes the molecules to reach the finish line allows the lab to accurately identify them.
What Max actually does is charge the molecules, suck them through a vacuum system, and very accurately measure their mass based on the time it takes them to travel from the bottom of the flight tube to the top and back again.
"A lot of compounds have the same nominal mass but this machine allows us to distinguish them by a mass difference equivalent to a couple of electrons," says Howitt.
Ad Feedback
Through a complex system of metal lenses, Max can measure compounds to an incredible accuracy of one one-thousandth of a mass unit, thanks to its ultra-high resolution.
For example, whereas conventional instruments would come up with a mass reading of 271, Max will spit out 271.0637, positively identifying, in one step, the compound as Nordazapam.
Previously, analysts had to smash the molecules apart and look at their fragmentation patterns, which often overlap, to distinguish them from the dozens of other compounds weighing around 271.
"We used to fingerprint them by smashing them up, now we just weigh them," says Howitt. "Instead of looking for different groups of drugs with different methods, we can now cover a vast array with one method, and look for a lot of things simultaneously."
But another real advantage of Max is it will allow more retrospective testing of samples when new designer drugs surface – a significant deterrent for potential drug cheats.
Because Max logs all readings and profiles samples, data can be reprocessed so analysts will be able to go straight to dodgy stored samples – meaning retesting of maybe 10 samples, rather than 2000.
Harness Racing New Zealand veterinary adviser Dr Andrew Grierson said the machine will be in full service for Christmas-New Year racing.
"The ability of the racing lab to detect things has been really souped up with this machine – it's incredibly sensitive and accurate."
Grierson said it would have no trouble picking up the drug at the centre of the latest fuss, Aminorex, a methamphetamine-like substance that metabolised from the sheep drench Levamisole.
As revealed in last week's Sunday Star-Times, HRNZ issued a warning to trainers to stop using the drench after nationwide intelligence that, instead of using it as a worming or immune system boost, cheats were using it as a go-fast.
"The methodology of testing for it had been difficult overseas, but this machine makes it easy.
"Nothing will get past it."
wEaReLeGiOn
15 years ago
Bruker Corporation (NASDAQ: BRKR) today reported financial
results for the third quarter ended September 30, 2009.
Lookin' good :)
Third Quarter 2009 Highlights
* Revenue $265.1 million
* GAAP Net Income $16.4 million
* GAAP EPS $0.10 per diluted share
* Free cash flow $14.2 million
Financial Results
In the third quarter of 2009, revenue was $265.1 million, an increase of 9.5% compared to revenue of $242.1 million in the third quarter of 2008. Excluding the effect of foreign currency translation, third quarter 2009 revenue increased 11.4% year-over-year. GAAP net income for the third quarter of 2009 was $16.4 million, or $0.10 per diluted share, compared to GAAP net income of $17.8 million, or $0.11 per diluted share, in the third quarter of 2008. Included in GAAP EPS in the third quarter of 2008 were (i) one-time tax benefits of $0.07 per diluted share and (ii) non-cash stock-based compensation expense of ($0.01) per diluted share. Included in GAAP EPS in the third quarter of 2009 was non-cash stock-based compensation expense of ($0.01) per diluted share.
For the nine months ended September 30, 2009, revenue was $748.1 million, a decrease of 5.5% compared to revenue of $791.9 million in the first three quarters of 2008. Excluding the effect of foreign currency translation, revenue for the nine months ended September 30, 2009 increased by 0.5% year-over-year. GAAP net income for the nine months ended September 30, 2009 was $37.7 million, or $0.23 per diluted share, compared to GAAP net income of $38.7 million, or $0.23 per diluted share, for the nine months ended September 30, 2008. Included in GAAP EPS for the nine months ended September 30, 2008 were (i) one-time tax benefits of $0.07 per diluted share, (ii) Bruker BioSpin acquisition related expenses of ($0.04) per diluted share, and (iii) non-cash stock-based compensation expense of ($0.02) per diluted share. Included in GAAP EPS for the nine months ended September 30, 2009 was non-cash stock-based compensation expense of ($0.02) per diluted share.
Free cash flow was $14.2 million in the third quarter of 2009, and $58.4 million for the nine months ended September 30, 2009, compared to a use of cash of ($11.9) million for the third quarter of 2008, and a use of cash of ($20.9) million for the nine months ended September 30, 2008. During the third quarter of 2009, Bruker repaid $19.3 million of debt, ending the quarter with cash and cash equivalents of $150.5 million, and net debt of $0.8 million, compared to net debt of $127.6 million at the end of the third quarter of 2008.
Comment and Outlook
Frank Laukien, Bruker’s President and CEO, commented: “We are pleased with our double-digit currency-adjusted third quarter 2009 year-over-year revenue growth, with our solid sequential improvements in revenue, operating margins and net income during the first three quarters of 2009, and with our strong free cash flow year-to-date. Our third quarter 2009 operating income increased more than 70% year-over-year, and our operating margin improved sequentially by 180 basis points, when compared to the second quarter 2009.”
Dr. Laukien continued: “During the third quarter we have seen positive sequential trends in bookings throughout the company, even in the divisions with a greater industrial markets exposure. We have also begun to see robust bookings from our academic and government customers who are benefiting from various global government stimulus programs. While we expect a strong fourth quarter of 2009, we believe that most of the anticipated positive revenue and margin effects from global stimulus orders will be reflected in Bruker’s financial results in 2010 and 2011.”
Segment Information
After Bruker’s acquisition of the ACCEL Research Instruments business on April 1, 2009, starting with the second quarter of 2009, Bruker has established two new reportable segments:
1) The Bruker Scientific Instruments (BSI) segment which consists of the four divisions Bruker AXS, Bruker BioSpin, Bruker Daltonics and Bruker Optics.
2) The Bruker Energy & Supercon Technologies (BEST) segment which combines the acquired ACCEL RI business, and the superconductor and supercon devices business, which was previously called Bruker Advanced Supercon, Inc.
Revenue in the BSI segment for the nine months ended September 30, 2009 was $716.5 million, compared to BSI revenue of $767.3 million for the nine months ended September 30, 2008. Excluding the effects of foreign currency translation, for the first nine months of 2009, BSI revenue decreased by 1.0% year-over-year. BSI net income for the nine months ended September 30, 2009 was $41.7 million, compared to $45.3 million for the nine months ended September 30, 2008. BSI earnings per diluted share for the nine months ended September 30, 2009 were $0.25, compared to $0.27 for the nine months ended September 30, 2008.
Revenue in the BEST segment for the nine months ended September 30, 2009 was $36.0 million, compared to BEST revenue of $32.5 million for the nine months ended September 30, 2008. Excluding the effects of foreign currency translation, for the first nine months of 2009, BEST revenue increased by 23.4% year-over-year. BEST net loss for the nine months ended September 30, 2009 was ($5.0) million, compared to a net loss of ($6.8) million for the nine months ended September 30, 2008. BEST loss per diluted share for the nine months ended September 30, 2009 was ($0.03), compared to ($0.04) for the nine months ended September 30, 2008.
Following at the end of this press release are reconciliations of certain non-GAAP measures presented in this release.
USE OF NON-GAAP FINANCIAL MEASURES
In addition to the financial measures prepared in accordance with generally accepted accounting principles (GAAP), we use the measures of non-GAAP revenue, non-GAAP net income, non-GAAP EPS by reportable segment, and non-GAAP free cash flow for Bruker Corporation. We believe that such non-GAAP measures help investors to gain a better understanding of our core operating results and future prospects, consistent with how management measures and forecasts the Company’s performance, especially when comparing such results to previous periods or forecasts. However, the non-GAAP financial measures included in this press release are not meant to be a better presentation or a substitute for results of operations prepared in accordance with GAAP. Reconciliations of such non-GAAP financial measures to the most directly comparable GAAP financial measures are set forth in the accompanying table. Specifically:
* Reconciliation of BSI and BEST reportable segments to the consolidated results of Bruker Corporation for the nine months ended September 30, 2009 and 2008
* Reconciliation of Free Cash Flow
EARNINGS CONFERENCE CALL
Bruker Corporation will host an operator-assisted earnings conference call at 9:00 a.m. Eastern Daylight Time on Thursday, October 29, 2009. To listen to the webcast, investors can go to http://ir.bruker.com and click on the live web broadcast symbol. The webcast will be available through the Company web site for 30 days. Investors can also listen and participate on the telephone in the US and Canada by calling 800-688-0796, or +1-617-614-4070 outside the US and Canada. Investors should refer to the Bruker Earnings Call. A telephone replay of the conference call will be available one hour after the conference call by dialing 888-286-8010 in the US and Canada, or +1-617-801-6888 outside the US and Canada, and then entering replay pass code 94562291. For more information, please visit http://ir.bruker.com
CAUTIONARY STATEMENT
Any statements contained in this press release that do not describe historical facts may constitute forward-looking statements as that term is defined in the Private Securities Litigation Reform Act of 1995. Any forward-looking statements contained herein are based on current expectations, but are subject to a number of risks and uncertainties, that could cause actual future results to differ materially from those projected including, but are not limited to, risks and uncertainties relating to adverse changes in conditions in the global economy and volatility in the capital markets, the integration of businesses we have acquired or may acquire in the future, changing technologies, product development and market acceptance of our products, the cost and pricing of our products, manufacturing, competition, dependence on collaborative partners and key suppliers, capital spending and government funding policies, changes in governmental regulations, realization of anticipated benefits from economic stimulus programs, intellectual property rights, litigation, and exposure to foreign currency fluctuations and other risk factors discussed from time to time in our filings with the Securities and Exchange Commission. These and other factors are identified and described in more detail in our filings with the SEC, including, without limitation, our recent Proxy Statements on Schedule 14A, our annual report on Form 10-K for the year ended December 31, 2008, our most recent quarterly reports on Form 10-Q and our current reports on Form 8-K. We expressly disclaim any intent or obligation to update these forward-looking statements other than as required by law.
Bruker Corporation
CONDENSED CONSOLIDATED STATEMENTS OF OPERATIONS (unaudited)
(in millions, except per share data)
Three Months Ended September 30, Nine Months Ended September 30,
2009 2008 2009 2008
Product revenue $ 230.7 $ 211.8 $ 655.8 $ 700.4
Service revenue 32.4 28.8 87.6 87.7
Other revenue 2.0 1.5 4.7 3.8
Total revenue 265.1 242.1 748.1 791.9
Cost of product revenue 127.9 114.6 364.8 382.3
Cost of service revenue 18.0 16.4 50.2 54.9
Total cost of revenue 145.9 131.0 415.0 437.2
Gross profit 119.2 111.1 333.1 354.7
Operating Expenses:
Sales and marketing 44.1 45.2 130.6 136.7
General and administrative 17.5 17.7 50.8 51.7
Research and development 31.6 33.1 91.8 100.8
Acquisition related, net - - (0.6 ) 6.2
Total operating expenses 93.2 96.0 272.6 295.4
Operating income 26.0 15.1 60.5 59.3
Interest and other income (expense), net (1.8 ) 0.8 (4.6 ) (7.8 )
Income before income tax provision and
noncontrolling interest in consolidated subsidiaries 24.2 15.9 55.9 51.5
Income tax provision 8.1 (2.0 ) 18.5 12.5
Net income 16.1 17.9 37.4 39.0
Net income (loss) attributable to noncontrolling interests (0.3 ) 0.1 (0.3 ) 0.3
Net income attributable to Bruker Corporation $ 16.4 $ 17.8 $ 37.7 $ 38.7
Net income per common share attributable to:
Bruker Corporation shareholders:
Basic $ 0.10 $ 0.11 $ 0.23 $ 0.24
Diluted $ 0.10 $ 0.11 $ 0.23 $ 0.23
Weighted average shares outstanding:
Basic 163.5 162.8 163.4 162.5
Diluted 165.0 165.9 164.7 165.6
Bruker Corporation
CONDENSED CONSOLIDATED BALANCE SHEETS (unaudited)
(in millions)
September 30, December 31,
2009 2008
ASSETS
Current assets:
Cash, short-term investments and restricted cash $ 150.5 $ 167.7
Accounts receivable, net 151.7 171.9
Inventories 443.6 425.1
Other current assets 72.7 56.0
Total current assets 818.5 820.7
Property and equipment, net 226.4 221.3
Intangible and other assets 79.3 74.3
Total assets $ 1,124.2 $ 1,116.3
LIABILITIES AND SHAREHOLDERS' EQUITY
Current liabilities:
Short-term borrowings $ 30.9 $ 41.0
Accounts payable 45.5 43.3
Customer deposits 197.1 199.6
Other current liabilities 247.5 235.8
Total current liabilities 521.0 519.7
Long-term debt 120.4 182.8
Other long-term liabilities 109.3 101.1
Total shareholders' equity 373.5 312.7
Total liabilities and shareholders' equity $ 1,124.2 $ 1,116.3
Reconciliation of BSI and BEST reportable segments to the consolidated results of Bruker Corporation for the nine months ended September 30, 2009 and 2008 (unaudited)
(in millions, except per share data)
Bruker
Bruker Energy & Corporate,
Scientific Supercon Adjustments GAAP
September 30, 2009: Instruments Technologies & Eliminations Consolidated
Revenue $ 716.5 $ 36.0 $ (4.4 ) $ 748.1
Operating Income (Loss) 63.4 (4.3 ) 1.4 60.5
Net Income (Loss) 41.7 (5.0 ) 1.0 37.7
Net Income (Loss) Per Diluted Share $ 0.25 $ (0.03 ) $ 0.01 $ 0.23
Diluted Shares Outstanding 164.7 163.4 164.7 164.7
September 30, 2008:
Revenue $ 767.3 $ 32.5 $ (7.9 ) $ 791.9
Operating Income (Loss) 65.7 (6.6 ) 0.2 59.3
Net Income (Loss) 45.3 (6.8 ) 0.2 38.7
Net Income (Loss) Per Diluted Share $ 0.27 $ (0.04 ) $ 0.00 $ 0.23
Diluted Shares Outstanding 165.6 162.5 165.6 165.6
Reconciliation of Free Cash Flow of Bruker Corporation (unaudited)
(in millions)
Three Months Ended Nine Months Ended
September 30, September 30,
2009 2008 2009 2008
Cash flow from operations $ 16.0 $ 0.8 $ 67.3 $ 18.9
Capital expenditures (1.8 ) (12.7 ) (8.9 ) (39.8 )
Free cash flow $ 14.2 $ (11.9 ) $ 58.4 $ (20.9 )
MSC290
15 years ago
Bruker Announces the Availability of the World's First 18 Tesla FTMS Magnet at IMSC 2009
Sunday, August 30, 2009 - Foxbusiness
BREMEN, Germany, Aug 30, 2009 (BUSINESS WIRE) ----At the 18th International Mass Spectrometry Conference, Bruker Daltonics today announced the availability of the world's first 18 tesla (T) magnet for FTMS. This unique, actively-shielded, refrigerated 18T magnet system with excellent homogeneity and field stability, represents the world's highest field FTMS magnet, providing unique and novel scientific capabilities that can be applied to some of today's most important, complex, and challenging protein, polymer, and small molecule analyses. The unmatched performance of FTMS at 18 tesla will significantly impact a variety of research areas including protein identification, petroleomics, metabolomics, small molecule tissue molecular imaging, and environmental sample analysis.
The new magnet system provides dramatic increases in FTMS resolution, speed, and dynamic range. Additionally, the routine observation and measurement of isotopic fine structure of molecules of interest will be facilitated and extended to larger molecules to provide another dimension of specificity for the determination of exact molecular formulae. Bruker has a long history of magnet development with many 'firsts' in high field technology. The latest of these achievements has been the June 2009 introduction of the world's first 1 GHz NMR system (23.5 tesla).
"The development of the 18T magnet for FTMS represents the next leap forward for high end FTMS," said Dr. Gerhard Roth, Managing Director of Bruker BioSpin GmbH in Karlsruhe, Germany. He continued: "The design of this new horizontal bore 18T FTMS magnet is based on Bruker's extensive design and production experience for ultra high field vertical and horizontal bore magnets for NMR, MRI, EPR and FTMS, combining the most advanced features and many of our key proprietary technologies."
Bruker Daltonics is now accepting orders for its new 18T FTMS magnet with delivery 12 months after order.
http://www.foxbusiness.com/story/markets/industries/health-care/bruker-announces-availability-worlds--tesla-ftms-magnet-imsc/
MSC290
15 years ago
Bruker to Present Major Instrument Innovations
Aug. 27, 2009 - By: Business Wire
The 18th International Mass Spectrometry Conference (IMSC) will open on August 30th, in Bremen, Germany, which is also the home of Bruker Daltonics, a leading developer of innovative life science mass spectrometry tools.
In addition to supporting IMSC as a Platinum Sponsor, and presenting more than 50 contributions in the scientific conference program, Bruker Daltonics has organized various workshops, customer days, exhibitions and company tours to present its mass spectrometry innovations to the scientific community:
* Sunday, August 30th: Bruker Daltonics International Users Conference
* Monday, August 31st and Tuesday, September 1st: Workshop Series “Achieving Highest Confidence with Complex Small Molecules Samples”, and “New Tools for Biomarker Discovery”, presented by MS experts including Don Richards (Pfizer Central Research Ltd., UK), Tony Bristow (AstraZeneca, UK), Gary Corthals (TCB, Finland), and Bernhard Kuester,(TU Munich, Germany)
* Monday, August 31st and Tuesday, September 1st: Live instrument demonstrations at our Bremen factory facility
* Wednesday, September 2nd: Bruker Daltonics factory tours running throughout the day;
At IMSC 2009, Bruker presents for the first time in Europe a number of truly innovative, high performance mass spectrometry platforms demonstrating Bruker’s “Continuing Revolution” campaign to enable the life science community for an ever increasing range of scientific investigations, as well as for advanced applied and clinical methods:
* maXis™ enabled with ETD , a technique set to revolutionize the way scientists study protein primary and secondary structures, modifications, folding and function, will be demonstrated live at IMSC 2009 to an audience of international scientists. The maXis™ is a unique high-speed Ultra-High Resolution TOF (UHR-TOF) mass spectrometer for highest performance with no-compromise for small molecule and proteomics applications. Following on from its successful introduction in 2008 and the large number of installations completed worldwide in many leading pharmaceutical and academic laboratories, the next generation maXis including high-performance ETD is now a reality. For further information: www.bdal.com/maXis
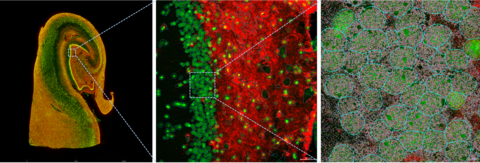
* ultrafleXtreme™ is the only fully 1 kHz MS and MS/MS enabled MALDI-TOF/TOF system available and incorporates the new smartbeam™-II laser technology and a 4 GHz digitizer. Its unmatched proteomics performance shows broad-band mass resolving power up to 40,000 and 1 ppm mass accuracy. Its unique flexibility allows LC-MALDI TOF/TOF, label-free quantitation, top-down intact protein analysis, Edmass™ protein sequencing, polymer characterization and oligonucleotide analysis. A rapid self-cleaning ion source, industry-leading imaging software and laser focal diameters down to 10 µm deliver the most powerful and complete MALDI imaging system on the market. In addition, as recently announced, the integration of the Carl Zeiss’ MIRAX Virtual Slide Scanner has enabled revolutionary advances in non-targeted molecular histology with high spatial resolution (research use only). Further information: www.bdal.com/ultrafleXtreme
* amaZon™ is the fastest ion trap available today with a 52,000 u/sec scan rate at 0.58 u mass resolution. The integration of novel, proprietary dual ion funnel technology, has increased sensitivity by an order of magnitude, and the second-generation ETD / PTR module for proteomics offers unmatched ETD sensitivity with high robustness and ease-of-use. A mass resolving power up to 20,000 in full scan mode across m/z 50-3000 makes top-down ETD experiments a reality. The fast MS data acquisition speed of 20 Hz with zero-delay polarity switching also makes amaZon the ideal instrument for all fast screening applications based on spectral libraries, including clinical toxicology and forensics. Further information: www.bdal.com/amaZon
* solariX™ is a next generation hybrid FTMS system, delivering a 10-fold improvement in sensitivity, an 8-fold gain in broadband ultra-high resolution (>1,000,000 at 7 T), and sub-ppm mass accuracy over a wide dynamic range. The complete engineering redesign makes this instrument extremely robust, uniquely powerful whilst also easy to use. SolariX is ideal for the analysis of very complex mixtures in top-down proteomics, with both ETD and ECD now as standard proteomics tools. Additional applications include petroleomics, metabolomics, and small-molecule drug and metabolite MALDI imaging on the dual ESI/MALDI source system. At the IMSC 2009, Bruker Daltonics announces the availability of the world’s first 18 tesla (T) magnet designed for FTMS applications. This unique magnet system represents the world’s highest field FTMS magnet, providing record-breaking scientific capabilities that can be applied to some of today’s most important, complex and challenging protein, polymer and small molecule analyses. For further information: www.bdal.com/solariX
Bruker Daltonics staff will be available for in-depth meetings during exhibit hours at Bruker's IMSC booth D in Hall 4.0, Monday through Friday. On Monday evening, the Hospitality Suite at the Lloyd room, CCB, is open 6 – 9 pm. A special evening event is organized for Tuesday in the famous “Bremer Ratskeller” located in the 16th century Bremen town hall. An evening reception will take place on Wednesday 5 – 7 pm at the Bruker booth in Hall 4.0. For more information on Bruker’s IMSC events, please visit www.bdal.com/imsc
http://ca.sys-con.com/node/1084798
wEaReLeGiOn
16 years ago
Bruker Corporation Reports Second Quarter
2009 Financial Results
http://ih.advfn.com/p.php?pid=nmona&cb=1248880657&
article=38816580&symbol=N^BRKR
8K http://ih.advfn.com/p.php?pid=nmona&cb=1248880684&article=38816797&symbol=N^BRKR
Bruker Corporation (NASDAQ: BRKR) today reported financial results for the second quarter ended June 30, 2009.
Second Quarter 2009 Highlights
* Revenue $252.5 million
* GAAP Net Income $12.9 million
* GAAP EPS $0.08 per diluted share
* Free cash flow $32.8 million
* After acquisition of ACCEL RI business on April 1, 2009, Bruker established new Energy & Supercon Technologies segment
* Bruker’s Scientific Instruments segment launched numerous innovative products with compelling performance and capabilities: Avance III 1,000 MHz NMR, ultrafleXtreme TOF/TOF, amaZon ion trap, solariX FTMS and 263 GHz EPR
Financial Results
In the second quarter of 2009, revenue was $252.5 million, a decrease of 18.9% compared to revenue of $311.5 million in the second quarter of 2008. Excluding the effect of foreign currency translation, second quarter 2009 revenue decreased 11.1% year-over-year. Sequentially, revenue increased 9.5% over the first quarter of 2009. GAAP net income for the second quarter of 2009 was $12.9 million, or $0.08 per diluted share, compared to GAAP net income of $21.7 million, or $0.13 per diluted share, in the second quarter of 2008. Included in GAAP EPS in the second quarter of 2009 was non-cash stock-based compensation expense of ($0.01) per diluted share.
For the six months ended June 30, 2009, revenue was $483.0 million, a decrease of 12.2%, compared to revenue of $549.8 million in the first half of 2008. Excluding the effect of foreign currency translation, revenue for the six months ended June 30, 2009 decreased by 4.4% year-over-year. GAAP net income for the six months ended June 30, 2009 was $21.3 million, or $0.13 per diluted share, compared to GAAP net income of $20.9 million, or $0.13 per diluted share, during the six months ended June 30, 2008. Included in GAAP EPS for the six months ended June 30, 2009 was non-cash stock-based compensation expense of ($0.02) per diluted share.
Free cash flow for the second quarter of 2009 was $32.8 million. During the second quarter of 2009, Bruker repaid $34.1 million of debt, and ended the quarter with cash and cash equivalents of $154.3 million, and net debt of $16.4 million.
Comment and Outlook
Frank Laukien, Bruker’s President and CEO, commented: “Considering the challenging economic conditions in the industrial markets, we are pleased with our performance in the second quarter and first half of 2009. In the second quarter of 2009, we experienced solid top line growth sequentially, while the year-over-year revenue comparison was expected to be more difficult due to our revenue spike in the second quarter of 2008. On the bottom line, our cost-cutting measures, the strength of our new product lines and the impact of our business initiatives had a positive impact on our second quarter 2009 results, and contributed to our 54% sequential growth in net income.”
Dr. Laukien continued: “During the second quarter we continued to strengthen our product portfolio and launched several compelling mass spectrometry products at ASMS 2009, while also introducing the world’s first 1 Gigahertz NMR system. Our life-science mass spectrometry business delivered strong double-digit revenue growth and significant margin improvements in the second quarter of 2009. Moreover, after the acquisition of the ACCEL RI business by our Bruker Advanced Supercon business, we have established the new Bruker Energy & Supercon Technologies division, which is emerging as a global leader in superconductors and supercon devices, as well as in advanced technologies for energy research and next-generation grid infrastructure.”
Bruker’s Chief Financial Officer, Bill Knight, added: “While the downturn in the global economy continues to be challenging to navigate, we are relatively well positioned to handle these challenges with our strong technology and IP base, our high-performance product portfolio and our broad international diversification. Moreover, we derive nearly 70% of our revenue from universities and medical schools, as well as from other non-profit and government customers, who tend to be less sensitive to economic conditions. Going forward, we expect the global government stimulus programs to have a positive impact on our high-end life-science and research systems business, as well as on our new Bruker Energy & Supercon Technologies division, starting in the second half of 2009, accelerating in 2010, and continuing into 2011.”
Segment Information
After Bruker’s acquisition of the ACCEL Research Instruments business on April 1, 2009, starting with the second quarter of 2009, Bruker has established two new reportable segments:
1) The Bruker Scientific Instruments (BSI) segment consists of the four divisions Bruker AXS, Bruker BioSpin, Bruker Daltonics and Bruker Optics.
2) The new Bruker Energy & Supercon Technologies (BEST) segment which combines the acquired ACCEL RI business, and the superconductor and supercon devices business that was previously called Bruker Advanced Supercon, Inc.
Revenue in the BSI segment for the six months ended June 30, 2009 was $464.9 million, compared to BSI revenue of $533.5 million for the six months ended June 30, 2008. Excluding the effects of foreign currency translation, first half 2009 BSI revenue decreased by 5.4% year-over-year. BSI net income for the six months ended June 30, 2009 was $23.5 million, compared to $24.7 million for the six months ended June 30, 2008. BSI earnings per diluted share for the six months ended June 30, 2009 were $0.14, compared to $0.15 for the six months ended June 30, 2008.
Revenue in the BEST segment for the six months ended June 30, 2009 was $21.8 million, compared to BEST revenue of $22.4 million for the six months ended June 30, 2008. Excluding the effects of foreign currency translation, first half 2009 BEST revenue increased by 12.3% year-over-year. BEST net loss for the six months ended June 30, 2009 was ($3.4) million, compared to a net loss of ($4.0) million for the six months ended June 30, 2008. BEST loss per diluted share for the six months ended June 30, 2009 was ($0.02), compared to ($0.02) for the six months ended June 30, 2008.
Following at the end of this press release is a non-GAAP table reconciling the results of our reportable segments to the consolidated results of Bruker Corporation.
USE OF NON-GAAP FINANCIAL MEASURES
In addition to the financial measures prepared in accordance with generally accepted accounting principles (GAAP), we use the measures of non-GAAP revenue, non-GAAP operating income, non-GAAP net income and non-GAAP EPS, by reportable segment. We believe that such non-GAAP measures helps investors to gain a better understanding of our core operating results and future prospects, consistent with how management measures and forecasts the Company’s performance, especially when comparing such results to previous periods or forecasts. However, the non-GAAP financial measures included in this press release are not meant to be a better presentation or a substitute for results of operations prepared in accordance with GAAP. Reconciliations of such non-GAAP financial measures to the most directly comparable GAAP financial measures are set forth in the accompanying table. Specifically:
* Reconciliation of BSI and BEST reportable segments to the consolidated results of Bruker Corporation for the six months ended June 30, 2009 and 2008
EARNINGS CONFERENCE CALL
Bruker Corporation will host an operator-assisted earnings conference call at 9:00 a.m. Eastern Daylight Time on Wednesday, July 29, 2009. To listen to the webcast, investors can go to http://ir.bruker.com and click on the live web broadcast symbol. The webcast will be available through the Company web site for 30 days. Investors can also listen and participate on the telephone in the US and Canada by calling 800-688-0796, or +1-617-614-4070 outside the US and Canada. Investors should refer to the Bruker Earnings Call. A telephone replay of the conference call will be available one hour after the conference call by dialing 888-286-8010 in the US and Canada, or +1-617-801-6888 outside the US and Canada, and then entering replay pass code 15184127. For more information, please visit http://ir.bruker.com.
CAUTIONARY STATEMENT
Any statements contained in this press release that do not describe historical facts may constitute forward-looking statements as that term is defined in the Private Securities Litigation Reform Act of 1995. Any forward-looking statements contained herein are based on current expectations, but are subject to a number of risks and uncertainties. The factors that could cause actual future results to differ materially from current expectations include, but are not limited to, risks and uncertainties relating to adverse changes in conditions in the global economy and volatility in the capital markets, the integration of businesses we have acquired or may acquire in the future, changing technologies, product development and market acceptance of our products, the cost and pricing of our products, manufacturing, competition, dependence on collaborative partners and key suppliers, capital spending and government funding policies, changes in governmental regulations, intellectual property rights, litigation, and exposure to foreign currency fluctuations. These and other factors are identified and described in more detail in our filings with the SEC, including, without limitation, our annual report on Form 10-K for the year ended December 31, 2008, our most recent quarterly reports on Form 10-Q and our current reports on Form 8-K. We disclaim any intent or obligation to update these forward-looking statements other than as required by law.
Bruker Corporation
CONDENSED CONSOLIDATED STATEMENTS OF OPERATIONS (unaudited)
(in millions, except per share data)
Three Months Ended June 30, Six Months Ended June 30,
2009 2008 2009 2008
Product revenue $ 222.9 $ 280.3 $ 425.1 $ 488.6
Service revenue 28.3 30.2 55.2 58.9
Other revenue 1.3 1.0 2.7 2.3
Total revenue 252.5 311.5 483.0 549.8
Cost of product revenue 125.2 162.5 236.9 267.7
Cost of service revenue 16.1 19.4 32.2 38.5
Total cost of revenue 141.3 181.9 269.1 306.2
Gross profit 111.2 129.6 213.9 243.6
Operating Expenses:
Sales and marketing 43.9 47.1 86.5 91.5
General and administrative 17.0 17.2 33.3 34.0
Research and development 31.1 36.5 60.2 67.7
Acquisition related, net (1.0 ) 0.4 (0.6 ) 6.2
Total operating expenses 91.0 101.2 179.4 199.4
Operating income 20.2 28.4 34.5 44.2
Interest and other income (expense), net (2.9 ) 3.6 (2.8 ) (8.6 )
Income before income tax provision and
noncontrolling interest in consolidated subsidiaries 17.3 32.0 31.7 35.6
Income tax provision 4.6 10.3 10.4 14.5
Net income 12.7 21.7 21.3 21.1
Net income (loss) attributable to noncontrolling interests (0.2 ) - - 0.2
Net income attributable to Bruker Corporation $ 12.9 $ 21.7 $ 21.3 $ 20.9
Net income per common share attributable to:
Bruker Corporation shareholders:
Basic and diluted $ 0.08 $ 0.13 $ 0.13 $ 0.13
Weighted average shares outstanding:
Basic 163.3 162.4 163.3 162.4
Diluted 164.7 165.5 164.5 165.3
Bruker Corporation
CONDENSED CONSOLIDATED BALANCE SHEETS (unaudited)
(in millions)
June 30, December 31,
2009 2008
ASSETS
Current assets:
Cash, short-term investments and restricted cash $ 154.3 $ 167.7
Accounts receivable, net 132.9 171.9
Inventories 436.4 425.1
Other current assets 65.6 56.0
Total current assets 789.2 820.7
Property and equipment, net 221.3 221.3
Intangible and other assets 77.0 74.3
Total assets $ 1,087.5 $ 1,116.3
LIABILITIES AND SHAREHOLDERS' EQUITY
Current liabilities:
Short-term borrowings $ 43.1 $ 41.0
Accounts payable 40.8 43.3
Customer deposits 202.1 199.6
Other current liabilities 233.2 235.8
Total current liabilities 519.2 519.7
Long-term debt 127.6 182.8
Other long-term liabilities 104.2 101.1
Total shareholders' equity 336.5 312.7
Total liabilities and shareholders' equity $ 1,087.5 $ 1,116.3
Reconciliation of BSI and BEST reportable segments to the consolidated results of Bruker Corporation for the six months ended June 30, 2009 and 2008 (unaudited)
(in millions, except per share data)
Bruker
Bruker Energy & Corporate,
Scientific Supercon Adjustments
June 30, 2009: Instruments Technologies & Eliminations Consolidated
Revenue
$
464.9
$ 21.8 $ (3.7 ) $ 483.0
Operating Income 36.5 (3.1 ) 1.1 34.5
Net Income 23.5 (3.4 ) 1.2 21.3
Net Income Per Diluted Share $ 0.14 $ (0.02 ) $ 0.01 $ 0.13
Dulited Shares Outstanding 164.5 163.3 164.5 164.5
June 30, 2008:
Revenue $ 533.5 $ 22.4 $ (6.1 ) $ 549.8
Operating Income 47.7 (3.7 ) 0.2 44.2
Net Income 24.7 (4.0 ) 0.2 20.9
Net Income Per Diluted Share $ 0.15 $ (0.02 ) $ 0.00 $ 0.13
Dulited Shares Outstanding 165.3 162.4 165.3 165.3
MSC290
16 years ago
Bruker Announces Opening of Expanded, State-of-the-Art Applications and Demonstration Facility in Yokohama, Japan
2-24-2009
Bruker Corporation (NASDAQ: BRKR) announced the opening of its expanded, state-of-the-art multi-technology applications and demonstration laboratory, which is co-located with Bruker’s R&D and manufacturing facility for X-ray analysis systems in Yokohama.
Yesterday, more than 150 customers, collaborators and business partners witnessed the ribbon-cutting ceremony for Bruker’s expanded 3,000 square-meter Yokohama facility, and then joined Bruker’s management for a seminar on the latest scientific instruments and analytical solutions.
The new Yokohama facility is the single largest combined Bruker applications laboratory in the world, showcasing a wide selection of novel life science, materials research and industrial systems including NMR, research MRI, EPR, MALDI-TOF/TOF, ESI-ITMS and ESI-Qq-TOF mass spectrometry, X-ray diffraction and crystallography, X-ray fluorescence (XRF), EDS accessories for SEM, FT-IR and thermal analysis systems.
Mr. Sadao Ueki, President of Bruker AXS K.K. and Representative Director of various Bruker subsidiaries in Japan, commented: “Our expanded applications facility provides the opportunity for scientists from Japan and Asia to investigate a wide range of applications on our innovative systems, together with obtaining training, demonstrations and advice from Bruker’s experienced Yokohama-based team of application scientists, plus visiting specialists from our worldwide factories.”
Dr. Frank Laukien, Bruker President and CEO, added: “We have recently expanded the range of products that we offer in Japan, for example now including our TRACER handheld XRF systems, our new S8 TIGER high-end WDXRF system, as well as our new maXis ultra-high performance TOF mass spectrometer. As we have almost 10 billion Yen in revenue and close to 150 employees in Japan, we have decided to expand and combine most of our operations in Japan in Yokohama, with additional sales offices in Osaka and Tokyo. We are very pleased with our modern, new applications laboratory and invite our customers in Japan to take advantage of our advanced capabilities here.”
http://www.ad-hoc-news.de/bruker-announces-opening-of-expanded-state-of-the-art--/de/Unternehmensnachrichten/20068834
MSC290
16 years ago
Bruker Biospin 950 mention
Campus Celebrates Historic Milestone
20 October 2008 - International Business Times
KANNAPOLIS, N.C., Oct. 20 /PRNewswire/ -- Academia, science, industry and government leaders gathered in Kannapolis, Monday, October 20th at 10 AM at the Dedication and Open House celebration for the David H. Murdock Core Laboratory Building, the UNC Nutrition Research Building and the NC State Fruit and Vegetable Science Institute Building. The UNC Nutrition Research Building is home to NC A&T University, NC Central University, UNC Chapel Hill and UNC Greensboro. NC State University, Appalachian State University, and Dole Food Company will occupy the NC State Fruit and Vegetable Science Institute Building at the NC Research Campus. UNC Charlotte will have tenure track faculty members located in the UNC Nutrition Building and the NC State Fruit and Vegetable Science Institute Building, and will also have a presence in the 311,000 square foot David H. Murdock Core Laboratory Building. "This campus fulfills my lifelong dream of being able to change the world's thoughts on nutrition and find ways to cure many of the dreadful diseases that have affected all of us and our families. It excites me to think of the groundbreaking research that will occur as a result of having these world class universities and companies here working together all in one place,"stated David Murdock.
Erskine B. Bowles, President of the UNC System along with Dr. Steven Leath, Vice President of Research for the UNC System and Dr. Victor J. Dzau,Chancellor for Health Affairs, Duke University and President and CEO, Duke University Health System spoke at the event. Dr. Stanley F. Battle,Chancellor, NC A&T University, Dr. Linda P. Brady, Chancellor, University of North Carolina Greensboro, Dr. Philip L. Dubois, Chancellor, University of North Carolina Charlotte, Dr. Charlie Nelms, Chancellor, North Carolina Central University, Dr. James L. Oblinger, Chancellor, North Carolina State University, Dr. Kenneth E. Peacock, Chancellor, Appalachian State University,and Vice Chancellor Dr. Tony G. Waldrop of the University of North Carolina Chapel Hill were on hand to represent each of their respective universities on the dais. In addition, representatives from a number of other universities within the UNC System were in attendance. President Erskine Bowles said, "I'm immensely proud that researchers and graduate students from seven UNC campuses are actively involved at the NC Research Campus, but what really energizes and excites me is all the cutting-edge research and life-altering discoveries that will happen within these world-class laboratories and facilities. With education, government, and the private sector working together in partnership,this Research Campus has enormous potential to create new jobs and spur economic development in our state."
Special guests included US Senator Elizabeth H. Dole, US Senator Richard M. Burr, US Congressman Robin C. Hayes, US Congressman J. Howard Coble, US Congressman Mel Watt, Lieutenant Governor Beverly E. Perdue, NC Secretary of State Elaine Marshall, along with former Governors James B. Hunt, Jr. and James G. Martin. Senator Marc Basnight, President Pro Tempore, NC Senate, and Speaker Joe Hackney, Speaker of the NC House of Representatives, along with NC Senator Fletcher L. Hartsell, Jr., led the delegation of area representatives from the NC Senate and NC House of Representatives to the dais. "This campus is a shining example of the future and vision of the state of North Carolina,"remarked Senator Fletcher Hartsell. "I am reminded of Thomas Jefferson's quote, 'I like the dreams of the future better than the history of the past.'I can only imagine what great discovery and promise lies ahead because of the collaboration on this campus." Senator Dole, Senator Burr, Congressman Hayes,Senator Basnight, and Senator Hartsell return to the campus after having been present for the announcement of the NC Research Campus on September 25, 2005and subsequent events in the development of the campus. The NC Research Campus is poised to generate 30,000 jobs for the state of North Carolina in the next12 - 15 years. "The North Carolina Research Campus will strengthen our state's standing as a national biotech leader, it will create new jobs, and its scientific innovations will improve the health and well-being of people around the world," said Lt. Governor Bev Perdue. "Biotechnology is the next frontier of health science and as new discoveries are made, North Carolina will lead the way." The Mayor of Kannapolis, Robert S. Misenheimer, along with many other dignitaries from surrounding counties and cities participated in the dedication ceremony and tours of the buildings. Dr. Carol Spalding, recently named as President of Rowan Cabarrus Community College, was seated on the dais representing the community college for the celebration.
In addition to academic institutions, top officials from a number of companies who will have a strong presence on the NC Research Campus were on hand for the event. Those companies include Carolinas Healthcare System, Cabarrus Health Alliance, Dole Food Company, LabCorp, Pharmaceutical Product Development, Sensory Spectrum, Anatomics, Red Hat, Lovelace Respiratory Research Institute and the Charlotte Research Institute. Researchers from academia, science and industry will be focused on studying health, nutrition,and agriculture. Primary areas of concentration are cancer, cardiovascular disease, diabetes, obesity, brain development, liver disease and osteoarthritis.
The ceremony was held at the main entrance on Research Campus Drive near the front steps into the David H. Murdock Core Laboratory Building. The public was invited to park in the new parking deck adjacent to the site of the event.
The 350 acre campus is a public-private venture created to foster collaboration and further knowledge in biotechnology, nutrition, agriculture,and health. The David H. Murdock Research Institute, located within the David H. Murdock Core Laboratory, will house the most state-of-the art scientific equipment in the areas of genomics, proteomics, metabolomics, animal and plant imaging, microscopy, and structural chemistry. In preparation for the opening of the campus, the DHMRI has purchased the first phase of equipment for the various core laboratories, including the Bruker Biospin 950 MHz NMR. In addition to the DHMRI initiative, David H. Murdock has invested $35 million ina longitudinal population-based research initiative led by Duke University to examine the behavioral and genetic differences in people that lead to the development of disease. The project, entitled the M.U.R.D.O.C.K Study, is an acronym for Measurement to Understand the Reclassification of Disease in Cabarrus/Kannapolis. It will be conducted on site by Duke University scientists and their collaborators and will span over a number of years."This beautiful, one-of-a-kind Core Laboratory is the heart of the Campus, and I believe it represents an unprecedented opportunity for scientists here to perform breakthrough research that can eventually transform the way we think about and practice medicine," said Dr. Victor Dzau.
Mr. Murdock's vision for the campus is for the NC Research Campus to be the epicenter of health, wellness and disease research in the world. The presence of vast scientific and human resources combined in a unique collaborative environment on the campus will increase the flow of information from the academic laboratory to industry, resulting in an improvement in the quality of life for people here and around the world. "The possible collaboration of the different entities at the NC Research Campus is endless and will be the start of a whole new era of collaborative research and innovation to benefit mankind," stated David Murdock. "And that's good news for a world needing to hear good news."
http://www.ibtimes.com/prnews/20081020/nc-research-campus.htm
MSC290
17 years ago
A Contact Lens for Lasers
A tiny lens integrated into semiconductor lasers promises better portable chemical sensors.
Monday, July 28, 2008 By Katherine Bourzac - Technology Review
Researchers at Harvard University and Hamamatsu Photonics have created a highly directional semiconductor laser that should--by averting light loss with a nano-patterned metal coating akin to a contact lens--enable highly sensitive portable chemical sensors and cheaper, more efficient optical communications.
The new technology consists of a metal grating patterned on the light-emitting face of the laser. The grating decreases the divergence of the laser light by a factor of 25, eliminating the need for bulky, expensive mirrors and lenses. "It's a hell of a lot smaller" than traditional optics, says Alan Willner, who leads the Optical Communications Laboratory at the University of Southern California. "You can integrate it right on the [laser] structure," says Willner, who was not involved in the research. What's more, by adjusting the design of the metal grating, the researchers say, they can tune it to work with any kind of semiconductor laser.
Semiconductor lasers are widely used in everything from DVD players to telecommunication networks. In chemical-sensing systems, they're used to illuminate gaseous compounds whose identity and concentration can be determined by looking at the spectrum of light they emit.
As light travels out of a laser, it spreads out in a cone shape. Even with meticulously aligned lenses and mirrors, some light is wasted. These additional optics are expensive and make laser systems bulky. The Harvard researchers, led by physicist Federico Capasso, attacked the problem by depositing a layer of metal a few hundred nanometers thick on the facet of a laser, then etching it with slits and an aperture. Such metal gratings can be created using conventional fabrication techniques.
A large portion of light coming out the aperture bends 90 degrees and then propagates down the metal grating in a form of energy called surface plasmons. The grooves in the metal grating then scatter this energy into a narrow beam of light.
The researchers demonstrated the technique on a quantum-cascade laser, a type of laser developed by Capasso at Bell Labs in 1994. Quantum-cascade lasers can emit light over a broad spectrum--from the infrared to the visible. Light from the type of quantum-cascade laser used to test the gratings normally diverges at angles ranging from 40 to 80 degrees. In an article published online this week in the journal Nature Photonics, the Harvard and Hamamatsu researchers report that light from their laser diverges by only 2.5 degrees without significantly reducing the laser's power output.
This difference could make it possible to integrate quantum-cascade lasers into portable chemical sensors. Systems incorporating such lasers can detect a wide range of compounds with great sensitivity. However, due to divergence, these lasers are currently impractical for chemical sensors. The lasers aren't powerful enough over long distances to perform sensitive measurements. Bulky lenses improve their sensitivity but make it difficult to transport them.
Bruker Optics, of Billerica, MA, is collaborating with Capasso to develop chemical sensors incorporating compact lasers for the battlefield. "Quantum-cascade lasers would be immensely useful to monitor the output from power plants and automobiles and to detect chemical agents," says Tom Tague, chief scientist at Bruker Optics.
"This is very exciting work," says Claire Gmachl, a professor of electrical engineering at Princeton University. "This is an important advance for quantum-cascade lasers, but also offers new prospects for other types of semiconductor lasers." The metal gratings "should be useful over a plethora of applications, for any optical signal processing," says Willner.
http://www.technologyreview.com/Infotech/21135/page1/


 Monksdream
12 months ago
Monksdream
12 months ago
 stocktrademan
9 years ago
stocktrademan
9 years ago
 Renee
10 years ago
Renee
10 years ago
 Penny Roger$
13 years ago
Penny Roger$
13 years ago

 Hot Features

