Rand Capital Declares Total Fourth Quarter Cash Dividend of $0.63 per Share; Full Year 2023 Dividend Distributions up 60%
December 05 2023 - 3:15PM
Business Wire
Total fourth quarter dividend consists of
regular quarterly cash dividend of $0.25 per share and special cash
dividend of $0.38 per share
Total 2023 cash dividend distributions of $1.33
per share up 60% over 2022
Rand Capital Corporation (Nasdaq: RAND) (“Rand”), a business
development company providing alternative financing for lower
middle market companies, announced today that its Board of
Directors declared a total quarterly cash dividend of $0.63 per
share comprised of a $0.25 per share regular quarterly cash
dividend and a $0.38 per share special cash dividend. Each of the
dividends will be distributed on or about December 29, 2023, to
shareholders of record as of December 18, 2023. Rand has
approximately 2.6 million shares outstanding.
Daniel P. Penberthy, President and CEO, commented, “Rand has
delivered strong results thus far during 2023 with continued
earnings momentum driven by the improvement of our portfolio
composition that is focused on income-producing investments.
Additionally, we sold our debt and equity investment in Dealer
Solutions and Design during the second quarter, which resulted in a
sizable net gain. This overall performance enabled an increase to
our quarterly dividend distribution earlier in the year and the
distribution of the $0.38 per share special dividend during the
fourth quarter of 2023.
“Further demonstrating the strength of our strategy is the total
$1.33 per share of cash dividends paid this year, which is up 60%
over 2022 and up 200% over a two-year period. Looking forward, we
believe we can continue to replicate our success by leveraging our
multiple sources of capital to grow our portfolio and drive
investment income growth that will help to support future
dividends.”
Additional Information Regarding Dividend
Distributions
The amount and timing of dividend distributions, including
future dividend distributions, are subject to the discretion of
Rand’s Board of Directors. When declaring distributions, Rand’s
Board of Directors reviews estimates of taxable income available
for distribution, which may differ from consolidated net income
under generally accepted accounting principles due to (i) changes
in unrealized appreciation and depreciation, (ii) temporary and
permanent differences in income and expense recognition, and (iii)
the amount of spillover income carried over from a given year for
distribution in the following year.
The final determination of taxable income for each tax year, as
well as the tax attributes for distributions in such tax year, will
be made after the close of the tax year.
ABOUT RAND CAPITAL
Rand Capital (Nasdaq: RAND) is an externally managed business
development company (BDC). The Company’s investment objective is to
maximize total return to its shareholders with current income and
capital appreciation by focusing its debt and related equity
investments in privately-held, lower middle market companies with
committed and experienced managements in a broad variety of
industries. Rand invests in early to later stage businesses that
have sustainable, differentiated and market-proven products,
revenue of more than $2 million and a path to free cash flow or up
to $5 million in EBITDA. The Company’s investment activities are
managed by its external investment adviser, Rand Capital
Management, LLC. Additional information can be found at the
Company’s website where it regularly posts information:
https://www.randcapital.com/.
Safe Harbor Statement
This press release contains “forward-looking statements” within
the meaning of Section 27A of the Securities Act of 1933, as
amended, and Section 21E of the Securities Exchange Act of 1934, as
amended. All statements, other than historical facts, including but
not limited to statements regarding the strategy of the Company and
its outlook; statements regarding the implementation of the
Company’s strategy and its growth trajectory; and any assumptions
underlying any of the foregoing, are forward-looking statements.
Forward-looking statements concern future circumstances and results
and other statements that are not historical facts and are
sometimes identified by the words “may,” “will,” “should,”
“potential,” “intend,” “expect,” “endeavor,” “seek,” “anticipate,”
“estimate,” “overestimate,” “underestimate,” “believe,” “could,”
“project,” “predict,” “continue,” “target” or other similar words
or expressions. Should one or more of these risks or uncertainties
materialize, or should underlying assumptions prove to be
incorrect, actual results may vary materially from those indicated
or anticipated by such forward-looking statements. The inclusion of
such statements should not be regarded as a representation that
such plans, estimates or expectations will be achieved. Important
factors that could cause actual results to differ materially from
such plans, estimates or expectations include, among others, (1)
evolving legal, regulatory and tax regimes; (2) changes in general
economic and/or industry specific conditions; and (3) other risk
factors as detailed from time to time in Rand ’s reports filed with
the Securities and Exchange Commission (“SEC”), including Rand’s
annual report on Form 10-K for the year ended December 31, 2022,
quarterly reports on Form 10-Q, and other documents filed with the
SEC. Consequently, such forward-looking statements should be
regarded as Rand’s current plans, estimates and beliefs. Except as
required by applicable law, Rand assumes no obligation to update
the forward-looking information contained in this release.
View source
version on businesswire.com: https://www.businesswire.com/news/home/20231205894122/en/
Company: Daniel P. Penberthy President and CEO
716.853.0802 dpenberthy@randcapital.com
Investors: Deborah K. Pawlowski / Craig P. Mychajluk Kei
Advisors LLC 716-843-3908 / 716-843-3832 dpawlowski@keiadvisors.com
/ cmychajluk@keiadvisors.com
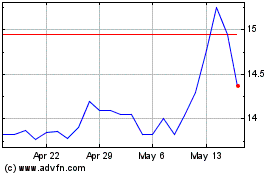
Rand Capital (NASDAQ:RAND)
Historical Stock Chart
From Dec 2024 to Jan 2025

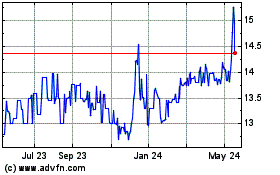
Rand Capital (NASDAQ:RAND)
Historical Stock Chart
From Jan 2024 to Jan 2025
