Form 424B3 - Prospectus [Rule 424(b)(3)]
May 13 2024 - 1:26PM
Edgar (US Regulatory)
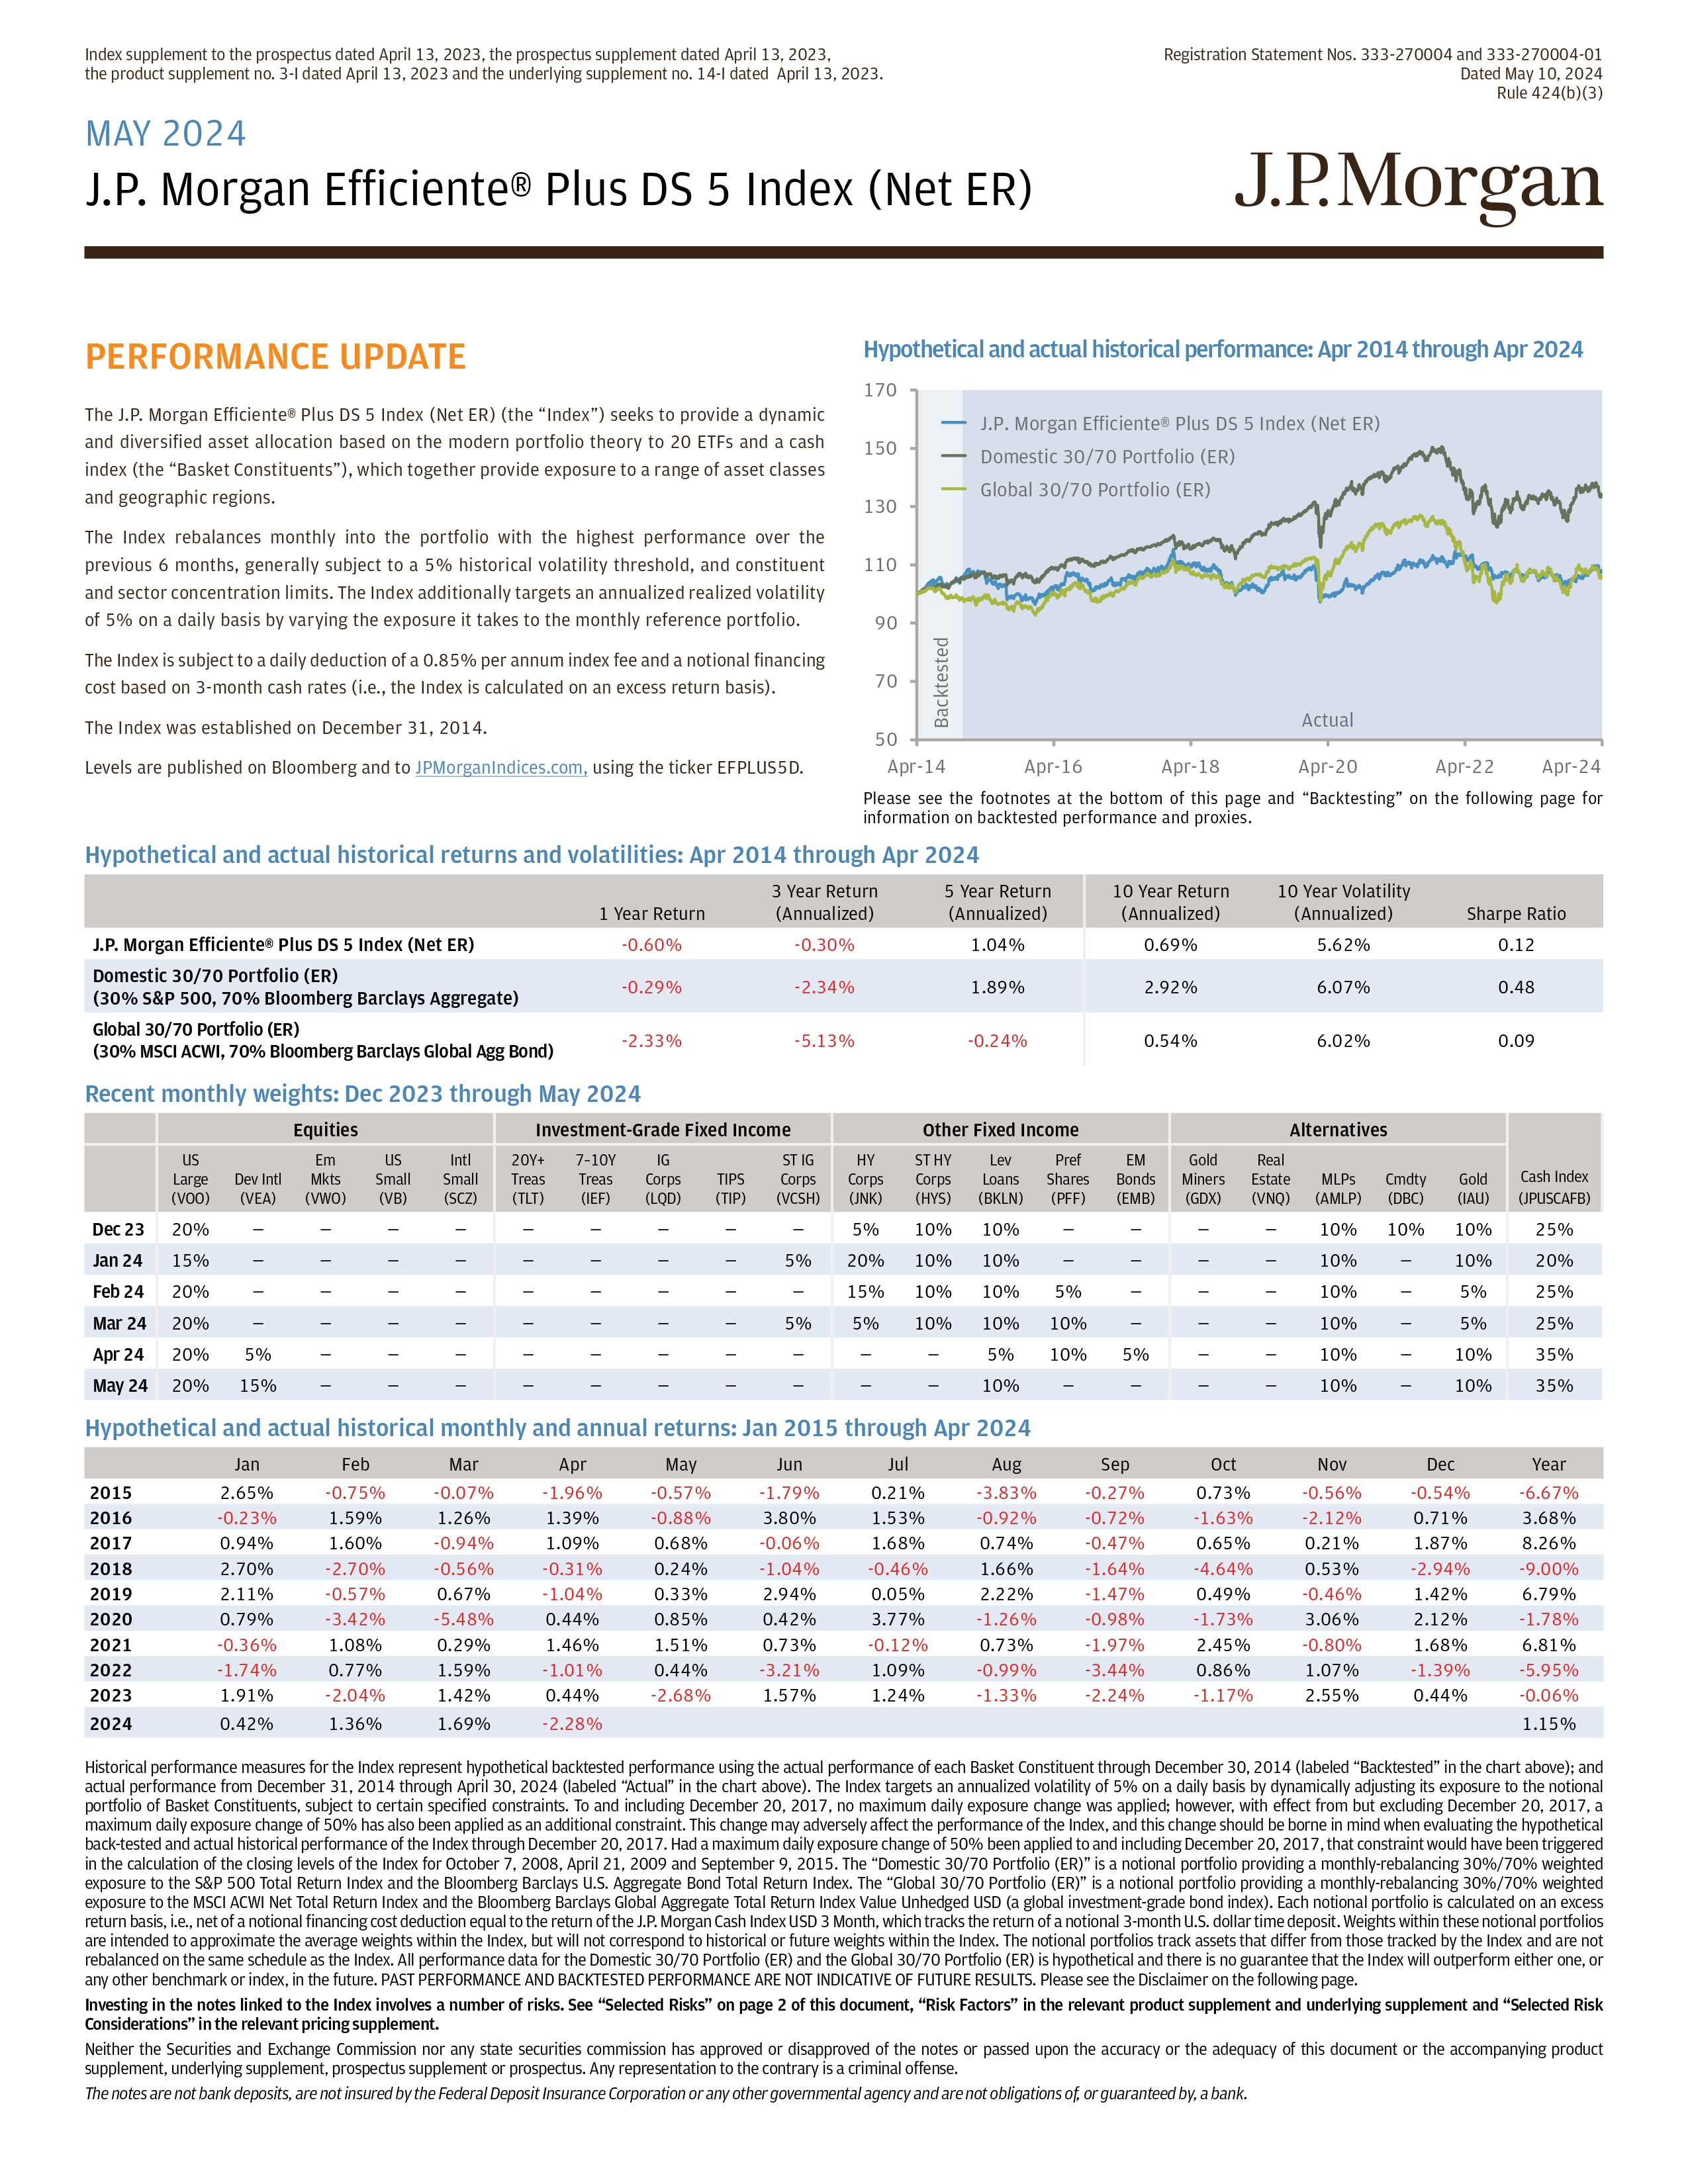
Index supplement to the prospectus dated April 13, 2023, the prospectus supplement dated April 13, 2023, the product supplement no. 3 - I dated April 13, 2023 and the underlying supplement no. 14 - I dated April 13, 2023. Registration Statement Nos. 333 - 270004 and 333 - 270004 - 01 Dated May 10, 2024 Rule 424(b)(3) Hypothetical and actual historical performance: Apr 2014 through Apr 2024 Please see the footnotes at the bottom of this page and “Backtesting” on the following page for information on backtested performance and proxies. Hypothetical and actual historical returns and volatilities: Apr 2014 through Apr 2024 Sharpe Ratio 10 Year Volatility (Annualized) 10 Year Return (Annualized) 5 Year Return (Annualized) 3 Year Return (Annualized) 1 Year Return 0.12 5.62% 0.69% 1.04% - 0.30% - 0.60% J.P. Morgan Efficiente® Plus DS 5 Index (Net ER) 0.48 6.07% 2.92% 1.89% - 2.34% - 0.29% Domestic 30/70 Portfolio (ER) (30% S&P 500, 70% Bloomberg Barclays Aggregate) 0.09 6.02% 0.54% - 0.24% - 5.13% - 2.33% Global 30/70 Portfolio (ER) (30% MSCI ACWI, 70% Bloomberg Barclays Global Agg Bond) Recent monthly weights: Dec 2023 through May 2024 Cash Index (JPUSCAFB) Alternatives Other Fixed Income Investment - Grade Fixed Income Equities Gold (IAU) Cmdty (DBC) MLPs (AMLP) Real Estate (VNQ) Gold Miners (GDX) EM Bonds (EMB) Pref Shares (PFF) Lev Loans (BKLN) ST HY Corps (HYS) HY Corps (JNK) ST IG Corps (VCSH) TIPS (TIP) IG Corps (LQD) 7 – 10Y Treas (IEF) 20Y+ Treas (TLT) Intl Small (SCZ) US Small (VB) Em Mkts (VWO) Dev Intl (VEA) US Large (VOO) 25% 10% 10% 10% — — — — 10% 10% 5% — — — — — — — — — 20% Dec 23 20% 10% — 10% — — — — 10% 10% 20% 5% — — — — — — — — 15% Jan 24 25% 5% — 10% — — — 5% 10% 10% 15% — — — — — — — — — 20% Feb 24 25% 5% — 10% — — — 10% 10% 10% 5% 5% — — — — — — — — 20% Mar 24 35% 10% — 10% — — 5% 10% 5% — — — — — — — — — — 5% 20% Apr 24 35% 10% — 10% — — — — 10% — — — — — — — — — — 15% 20% May 24 Hypothetical and actual historical monthly and annual returns: Jan 2015 through Apr 2024 Year Dec Nov Oct Sep Aug Jul Jun May Apr Mar Feb Jan - 6.67% - 0.54% - 0.56% 0.73% - 0.27% - 3.83% 0.21% - 1.79% - 0.57% - 1.96% - 0.07% - 0.75% 2.65% 2015 3.68% 0.71% - 2.12% - 1.63% - 0.72% - 0.92% 1.53% 3.80% - 0.88% 1.39% 1.26% 1.59% - 0.23% 2016 8.26% 1.87% 0.21% 0.65% - 0.47% 0.74% 1.68% - 0.06% 0.68% 1.09% - 0.94% 1.60% 0.94% 2017 - 9.00% - 2.94% 0.53% - 4.64% - 1.64% 1.66% - 0.46% - 1.04% 0.24% - 0.31% - 0.56% - 2.70% 2.70% 2018 6.79% 1.42% - 0.46% 0.49% - 1.47% 2.22% 0.05% 2.94% 0.33% - 1.04% 0.67% - 0.57% 2.11% 2019 - 1.78% 2.12% 3.06% - 1.73% - 0.98% - 1.26% 3.77% 0.42% 0.85% 0.44% - 5.48% - 3.42% 0.79% 2020 6.81% 1.68% - 0.80% 2.45% - 1.97% 0.73% - 0.12% 0.73% 1.51% 1.46% 0.29% 1.08% - 0.36% 2021 - 5.95% - 1.39% 1.07% 0.86% - 3.44% - 0.99% 1.09% - 3.21% 0.44% - 1.01% 1.59% 0.77% - 1.74% 2022 - 0.06% 0.44% 2.55% - 1.17% - 2.24% - 1.33% 1.24% 1.57% - 2.68% 0.44% 1.42% - 2.04% 1.91% 2023 1.15% - 2.28% 1.69% 1.36% 0.42% 2024 Historical performance measures for the Index represent hypothetical backtested performance using the actual performance of each Basket Constituent through December 30 , 201 4 (labeled “Backtested” in the chart above) ; and actual performance from December 31 , 201 4 through April 30 , 202 4 (labeled “Actual” in the chart above) . The Index targets an annualized volatility of 5 % on a daily basis by dynamically adjusting its exposure to the notional portfolio of Basket Constituents, subject to certain specified constraints . To and including December 20 , 2017 , no maximum daily exposure change was applied ; however, with etfect from but excluding December 20 , 2017 , a maximum daily exposure change of 50 % has also been applied as an additional constraint . This change may adversely atfect the performance of the Index, and this change should be borne in mind when evaluating the hypothetical back - tested and actual historical performance of the Index through December 20 , 2017 . Had a maximum daily exposure change of 50 % been applied to and including December 20 , 2017 , that constraint would have been triggered in the calculation of the closing levels of the Index for October 7 , 2008 , April 21 , 200 9 and September 9 , 2015 . The “Domestic 30 / 70 Portfolio (ER)” is a notional portfolio providing a monthly - rebalancing 30 % / 70 % weighted exposure to the S&P 50 0 Total Return Index and the Bloomberg Barclays U . S . Aggregate Bond Total Return Index . The “Global 30 / 70 Portfolio (ER)” is a notional portfolio providing a monthly - rebalancing 30 % / 70 % weighted exposure to the MSCI ACWI Net Total Return Index and the Bloomberg Barclays Global Aggregate Total Return Index Value Unhedged USD (a global investment - grade bond index) . Each notional portfolio is calculated on an excess return basis, i . e . , net of a notional financing cost deduction equal to the return of the J . P . Morgan Cash Index USD 3 Month, which tracks the return of a notional 3 - month U . S . dollar time deposit . Weights within these notional portfolios are intended to approximate the average weights within the Index, but will not correspond to historical or future weights within the Index . The notional portfolios track assets that ditfer from those tracked by the Index and are not rebalanced on the same schedule as the Index . All performance data for the Domestic 30 / 70 Portfolio (ER) and the Global 30 / 70 Portfolio (ER) is hypothetical and there is no guarantee that the Index will outperform either one, or any other benchmark or index, in the future . PAST PERFORMANCE AND BACKTESTED PERFORMANCE ARE NOT INDICATIVE OF FUTURE RESULTS . Please see the Disclaimer on the following page . Investing in the notes linked to the Index involves a number of risks . See “Selected Risks” on page 2 of this document, “Risk Factors” in the relevant product supplement and underlying supplement and “Selected Risk Considerations” in the relevant pricing supplement . Neither the Securities and Exchange Commission nor any state securities commission has approved or disapproved of the notes or passed upon the accuracy or the adequacy of this document or the accompanying product supplement, underlying supplement, prospectus supplement or prospectus . Any representation to the contrary is a criminal otfense . The notes are not bank deposits, are not insured by the Federal Deposit Insurance Corporation or any other governmental agency and are not obligations of, or guaranteed by, a bank . MAY 2024 J.P. Morgan Efficiente® Plus DS 5 Index (Net ER) 70 90 PERFORMANCE UPDATE The J . P . Morgan Efficiente® Plus DS 5 Index (Net ER) (the “Index”) seeks to provide a dynamic and diversified asset allocation based on the modern portfolio theory to 20 ETFs and a cash index (the “Basket Constituents”), which together provide exposure to a range of asset classes and geographic regions . The Index rebalances monthly into the portfolio with the highest performance over the previous 6 months, generally subject to a 5% historical volatility threshold, and constituent 110 and sector concentration limits. The Index additionally targets an annualized realized volatility of 5% on a daily basis by varying the exposure it takes to the monthly reference portfolio. The Index is subject to a daily deduction of a 0.85% per annum index fee and a notional financing cost based on 3 - month cash rates (i.e., the Index is calculated on an excess return basis). The Index was established on December 31, 2014. Levels are published on Bloomberg and to JPMorganIndices.com , using the ticker EFPLUS5D. 130 150 170 Apr - 22 Apr - 24 J.P. Morgan Efficiente® Plus DS 5 Index (Net ER) Domestic 30/70 Portfolio (ER) Global 30/70 Portfolio (ER) Backtested Actual 50 Apr - 14 Apr - 16 Apr - 18 Apr - 20
MAY 2024 | J.P. Morgan Efficiente® Plus DS 5 Index (Net ER) Selected Risks Our affiliate, J.P. Morgan Securities plc (“JPMS plc”), is the Index Sponsor and may adjust the Index in a way that atfects its level. The policies and judgments for which JPMS plc is responsible could have an impact, positive or negative, on the level of the Index and the value of your investment. JPMS plc is under no obligation to consider your interest as an investor with returns linked to the Index. The level of the Index is calculated on an excess return basis (net of a notional financing cost) and reflects the daily deduction of 0.85% per annum. The Index was established on December 31, 2014, and has a limited operating history. There are risks associated with a momentum - based investment strategy. If market conditions do not represent a continuation of prior observed trends, Index performance may be adversely impacted. The Index comprises notional assets and liabilities. There is no actual portfolio of assets to which any person is entitled or in which any person has any ownership interest. The Index may not be successful, may not outperform any alternative strategy and may not approximate its target volatility of 5%. The investment strategy used to construct the Index involves monthly rebalancing and weighting constraints that are applied to the Basket Constituents, and daily adjustments to the exposure to the monthly reference portfolio, which may adversely impact performance. The Index will be partially uninvested when the cash index is included in the monthly reference portfolio and when the Index’s exposure to the monthly reference portfolio is less than 100%. Any uninvested portion will earn no return. Changes in the values of the Basket Constituents may otfset each other. There are risks associated with correlation between the Basket Constituents. If the performances of the Basket Constituents become highly correlated during periods of negative performance, Index performance may be adversely impacted. Each Basket Constituent composing the Index may be replaced by a substitute constituent upon the occurrence of certain extraordinary events. The Index should not be compared to any other index or strategy sponsored by any of our affiliates and cannot necessarily be considered a revised, enhanced or modified version of any other J.P. Morgan index. The securities of our parent company, JPMorgan Chase & Co., are held by several of the Basket Constituents. The commodity futures contracts underlying the Invesco DB Commodity Index Tracking Fund are subject to uncertain legal and regulatory regimes. The performance of an ETF, particularly during periods of market volatility, may not correlate with the performance of its reference index. SOFR has a limited history and its future performance cannot be predicted based on historical performance. SOFR may be volatile and may be more volatile than other benchmark or market interest rates. The Index is subject to risks associated with non - U . S . securities markets (including emerging market risks, and currency exchange risk), small capitalization stocks, preferred stocks, fixed income securities and loans (including interest - rate related risks and credit risk), risks associated with the real estate industry and MLPs, and risks associated with investments in commodity futures contracts and gold . The risks identified above are not exhaustive. You should also review carefully the related “Risk Factors” section in the relevant product supplement and underlying supplement and “Selected Risk Considerations” in the relevant pricing supplement. Disclaimer The information contained in this document is for discussion purposes only . Any information relating to performance contained in these materials is illustrative and no assurance is given that any indicative returns, performance or results, whether historical or hypothetical, will be achieved . J . P . Morgan undertakes no duty to update this information . In the event of any inconsistency between the information presented herein and any offering documents, the offering documents shall govern . Backtesting : Hypothetical backtested performance measures have inherent limitations and are designed with the benefit of hindsight . Alternative modelling techniques might produce significantly different results and may prove to be more appropriate . For time periods prior to the launch of a Basket Constituent that is an ETF or an ETN, and prior to that Basket Constituent’s satisfaction of a minimum liquidity standard, backtesting uses alternative performance derived from the reference index tracked by that Basket Constituent as of the live date of the Index, after deducting hypothetical fund expenses equal to such Basket Constituent’s expense ratio as of the live date of the Index, rather than actual performance of that Basket Constituent for that period . The use of alternative “proxy” performance information in the calculation of hypothetical backtested weights and levels may have resulted in different, perhaps significantly different, weights and higher levels than would have resulted from the use of actual performance information of the Basket Constituents . Prior to February 25 , 2020 , the Basket Constituent providing exposure to Master Limited Partnerships was the ETRACS Alerian MLP Infrastructure Index ETN, but on that date it was replaced with the Alerian MLP ETF, an ETF which tracks the same reference index . Prior to December 31 , 2021 , the Cash Constituent (referred to as “Cash Index” in the table) was the JPMorgan Cash Index USD 3 Month . Past performance, and especially hypothetical backtested performance, is not indicative of future results . This type of information has inherent limitations and you should carefully consider these limitations before placing reliance on such information . The 10 Year Volatility (Annualized) on the previous page is a measure of market risk, calculated as of the square root of two hundred and fifty - two ( 252 ) multiplied by the sample standard deviation of the daily logarithmic returns of each applicable index or portfolio (considering only days for which levels are available for all three) over the preceding 10 years . The Sharpe Ratio on the previous page is a measure of risk - adjusted performance, calculated as the 10 Year Return (Annualized) divided by the 10 Year Volatility (Annualized) . Investment suitability must be determined individually for each investor, and CDs linked to the Index may not be suitable for all investors . This material is not a product of J . P . Morgan Research Departments . Copyright © 2024 JPMorgan Chase & Co . All rights reserved . For additional regulatory disclosures, please consult : www . jpmorgan . com/disclosures . Information contained on this website is not incorporated by reference in, and should not be considered part of, this document . This monthly update document replaces and supersedes all prior written materials of this type previously provided with respect to the Index .
JP Morgan Chase (NYSE:JPM)
Historical Stock Chart
From Apr 2024 to May 2024

JP Morgan Chase (NYSE:JPM)
Historical Stock Chart
From May 2023 to May 2024
