Guardian Capital Group Limited Announces 2013 Third Quarter Operating Results
November 11 2013 - 2:42PM
Marketwired Canada
Guardian Capital Group Limited (TSX:GCG)(TSX:GCG.A)

All per share figures disclosed below are stated on a diluted basis.


----------------------------------------------------------------------------
----------------------------------------------------------------------------
For the periods ended
 September 30                      Three Months           Nine Months
($ in thousands, except per
 share amounts)                       2013     2012        2013         2012
----------------------------------------------------------------------------
----------------------------------------------------------------------------
Net revenue                    $    25,173 $ 21,370 $    73,371  $    62,214
Operating earnings                   6,898    4,647      18,367       14,347
Net gains                            3,183    2,045       4,419        1,481
Net earnings before net gains
 (losses) on securities held
 for sale                            8,602    6,045      19,922       13,262
Net gains (losses) on
 securities held for sale              432    2,849        (296)       3,475
Net earnings available to
 shareholders                        8,946    8,750      19,452       16,641
----------------------------------------------------------------------------
Adjusted cash flow from
 operations available to
 shareholders                  $     7,128 $  5,091 $    18,719  $    15,737
EBITDA available to
 shareholders                        8,176    6,064      22,506       18,473
----------------------------------------------------------------------------
Per Share
Net earnings before net gains
 (losses) on securities held
 for sale                      $      0.27 $   0.18 $      0.64  $      0.41
Net earnings available to
 shareholders                         0.29     0.27        0.63         0.52
Adjusted cash flow from
 operations available to
 shareholders                         0.23     0.16        0.61         0.49
EBITDA available to
 shareholders                         0.26     0.19        0.73         0.58
----------------------------------------------------------------------------
----------------------------------------------------------------------------
As at                                   2013                   2012
($ in millions, except per       September             December    September
 share amounts)                         30  June 30          31           30
----------------------------------------------------------------------------
----------------------------------------------------------------------------
Assets under management        $    21,201 $ 20,379 $    18,832  $    17,983
Assets under administration         10,790   10,322       9,918        9,165
Value of corporate holdings of
 securities                            433      394         380          377
Shareholders' equity                   394      355         354          336
----------------------------------------------------------------------------
Per Share
Value of corporate holdings of
 securities                    $     13.76 $  12.51 $     11.99  $     11.82
Shareholders' equity                 12.51    11.27       11.16        10.54
----------------------------------------------------------------------------


The Company continues to generate asset growth through relatively strong
performance and net asset flows. The assets under management increased to $21.2
billion as at September 30, 2013, an increase of 4% quarter over quarter and 18%
year over year. Assets under administration increased to $10.8 billion as at
September 30, 2013, an increase of 5% from the prior quarter and 18% from 2012.


For the third quarter of 2013, the Company is reporting net earnings before
gains on securities held for sale of $8.6 million or $0.27 per share, compared
to $6.0 million or $0.18 per share in 2012. This 43% increase was brought about
by improvements both in operating earnings across all main business segments,
and net gains. Net gains of $3.2 million were recorded during the quarter,
mainly as a result of the sale by the Company of 100,000 shares of the Bank of
Montreal for proceeds of $6.6 million. Net earnings available to shareholders
for the quarter were $8.9 million or $0.29 per share, compared to $8.8 million
or $0.27 per share in the third quarter of 2012.


Adjusted cash flow from operations for the quarter was $7.1 million, or $0.23
per share, compared to $5.1 million, or $0.16 per share in the third quarter of
2012. EBITDA available to shareholders for the quarter were up 35% at $8.2
million, or $0.26 per share, compared to $6.1 million, or $0.19 per share for
the third quarter of 2012


The fair value of the Company's holdings of securities as at September 30, 2013
was $433 million, or $13.76 per share, compared with $380 million, or $11.99 per
share at December 31, 2012. The Company's shareholders' equity at


September 30, 2013 was $394 million, or $12.51 per share, compared with $354
million, or $11.16 per share at December 31, 2012.


The Board of Directors has declared a quarterly dividend of $0.055 per share,
payable on January 17, 2014, to shareholders of record on January 10, 2014.


Guardian Capital Group Limited is a diversified financial services company
founded in 1962, which provides institutional and high net worth investment
management services to clients; financial services to international investors;
and services to financial advisors in its national mutual fund dealer,
securities dealer, and insurance distribution network.


FOR FURTHER INFORMATION PLEASE CONTACT:
Guardian Capital Group Limited
Vern Christensen
Senior Vice-President and Secretary
(416) 947-4093


Guardian Capital Group Limited
George Mavroudis
President and Chief Executive Officer
(416) 364-8341
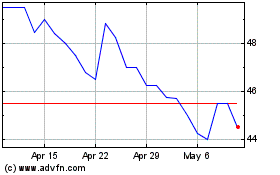
Guardian Capital (TSX:GCG)
Historical Stock Chart
From Apr 2024 to May 2024

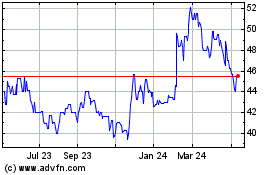
Guardian Capital (TSX:GCG)
Historical Stock Chart
From May 2023 to May 2024
