Imperial Metals Corporation (the “Company”)
(TSX:III) reports the 2019 metals production at the Red Chris mine
was 71.9 million pounds copper, 36,471 ounces gold, and 133,879
ounces silver.
Red Chris production for the fourth quarter of
2019 was 21.7 million pounds copper, 12,155 ounces gold, and 45,508
ounces silver. These results represent 100% of production
at Red Chris. All metals production increased in the
fourth quarter compared to the third quarter of 2019. Mill
throughput for the quarter averaged 27,784 tonnes per calendar
day.
Imperial’s 30% portion of Red Chris production
for the fourth quarter of 2019 was 6.5 million pounds copper, 3,646
ounces gold, and 13,652 ounces silver. For the year ended December
31, 2019, Imperial’s portion of Red Chris production, representing
100% for the period January 1 through August 14, 2019 and 30% of
production for the period August 15 through December 31, 2019, was
50.3 million pounds copper, 25,177 ounces gold, and 90,577 ounces
silver.
Metal production guidance (100%), provided by
Newcrest for the period August 15, 2019 to June 30, 2020 (to
conform to their annual year end of June 30, 2020) is in the range
of 63-79 million pounds copper and 36,000-50,000 ounces
gold.
Exploration Update
There are two drilling campaigns presently
underway at Red Chris. The first is the East Zone Resource
Definition Programme, designed to obtain geological, geotechnical
and metallurgical data to support future studies for underground
block cave mining. The second is the Brownfields Exploration
Programme, which is searching for additional zones of higher grade
mineralization within the Red Chris porphyry corridor. Drill
activity increased during the 2019 fourth quarter with six diamond
drill rigs in operation. Seven drill holes have been completed,
with a further five holes in progress for a total of 14,742m
drilled to December 31, 2019.
The East Zone Resource Definition Programme
comprises 16 holes; two holes have been completed and a further
five holes are in progress. To date, assay results for portions of
two of the holes have been received.
- RC591R returned 474m @ 0.63 g/t Au and 0.43 % Cu from 325m,
including
- 178m @ 0.74 g/t Au and 0.41 % Cu from 391m, including
- 46m @ 1 g/t Au and 0.64 % Cu from 519m, and
- 112m @ 1.1 g/t Au and 0.71 % Cu from 685m, including
- 62m @ 1.4 g/t Au and 0.86 % Cu from 733m
- RC591R also returned 64m @ 1.6 g/t Au and 1.1 % Cu from 847m,
including
- 62m @ 1.7 g/t Au and 1.1 % Cu from 847m, including
- 56m @ 1.8 g/t Au and 1.2 % Cu from 851m
- RC595 returned 720m @ 0.59 g/t Au and 0.56 % Cu from 394m
(partial result; assays pending), including
- 386m 0.82 g/t Au and 0.73 % Cu from 668m, including
- 126m @ 1.1 g/t Au and 0.85 % Cu from 800m
Newcrest intends to construct, at the completion
of the East Zone Resource Definition Programme, a new Resource
Model incorporating both historical Imperial Metals’ and 2019
Newcrest drilling data.
The Brownfields Exploration Programme has
identified an additional higher grade zone and expanded the
footprint of the Gully mineralization:
- RC603 returned 124m @ 0.58 g/t Au and 0.42 % Cu from 466m,
including
- 94m @ 0.71 g/t Au and 0.51 % Cu from 470m, including
- 10m @ 1.4 g/t Au and 0.71 % Cu from 518m
- RC603 also returned 304m @ 0.44 g/t Au and 0.2 % Cu from 802m,
including
- 52m @ 1.1 g/t Au and 0.47 % Cu from 948m, and
- 16m @ 0.92 g/t Au and 0.16 % Cu from 1016m
Additional drilling at Gully is planned to map
out the extent of high grade mineralization.
Significant Red Chris Intercepts:
|
Drill Holes |
From (m) |
To (m) |
Width (m) |
Gold (g/t) |
Copper (%) |
|
RC589 |
664 |
868 |
204 |
0.35 |
0.29 |
|
including |
814 |
866 |
52 |
0.65 |
0.62 |
|
RC590 |
592 |
1064 |
472 |
0.29 |
0.19 |
|
including |
846 |
880 |
34 |
0.58 |
0.46 |
|
RC591R* |
325 |
799 |
474 |
0.63 |
0.43 |
|
including |
391 |
569 |
178 |
0.74 |
0.41 |
|
including |
519 |
565 |
46 |
1.0 |
0.64 |
|
including |
685 |
797 |
112 |
1.1 |
0.71 |
|
including |
733 |
795 |
62 |
1.4 |
0.86 |
|
RC591R* |
847 |
911 |
64 |
1.6 |
1.1 |
|
including |
847 |
909 |
62 |
1.7 |
1.1 |
|
including |
851 |
907 |
56 |
1.8 |
1.2 |
|
RC595 |
394 |
1114 |
720** |
0.59 |
0.56 |
|
including |
668 |
1054 |
386 |
0.82 |
0.73 |
|
including |
800 |
926 |
126 |
1.1 |
0.85 |
|
RC603 |
466 |
590 |
124 |
0.58 |
0.42 |
|
including |
470 |
564 |
94 |
0.71 |
0.51 |
|
including |
518 |
528 |
10 |
1.4 |
0.71 |
|
RC603 |
802 |
1106 |
304 |
0.44 |
0.2 |
|
including |
948 |
1000 |
52 |
1.1 |
0.47 |
|
including |
1016 |
1032 |
16 |
0.92 |
0.16 |
|
RC604 |
264 |
522 |
258 |
0.2 |
0.2 |
*drilling in progress, **partial intercept,
assays pending
Jim Miller-Tait, P.Geo., Imperial VP
Exploration, is the designated Qualified Person as defined by
National Instrument 43-101 for the Red Chris exploration programs,
and has reviewed this news release. Red Chris samples for the
2019 drilling reported were analysed at Bureau Veritas Mineral
Laboratories in Vancouver. A full QA/QC program using blanks,
standards and duplicates was completed for all diamond drilling
samples submitted to the labs. Significant assay intervals reported
represent apparent widths. Insufficient geological information is
available to confirm the geological model and true width of
significant assay intervals.
Plan view map and cross sections are available
on imperialmetals.com.
About Imperial
Imperial is a Vancouver exploration, mine
development and operating company. The Company, through its
subsidiaries, owns a 30% interest in the Red Chris mine, and a 100%
interest in both the Mount Polley and Huckleberry copper mines in
British Columbia. Imperial also holds a 48% interest in the Ruddock
Creek lead/zinc property.
Company Contacts
Brian Kynoch | President |
604.669.8959Andre Deepwell | Chief Financial
Officer | 604.488.2666Sabine Goetz
| Shareholder Communications |
604.488.2657 | investor@imperialmetals.com
Cautionary Note Regarding
Forward-Looking Statements
Certain information contained in this news
release are not statements of historical fact and are
“forward-looking” statements. Forward-looking statements relate to
future events or future performance and reflect Company
management’s expectations or beliefs regarding future events and
include, but are not limited to, statements regarding the Company’s
expectations with respect to metal production guidance and
estimates, current drilling programs at Red Creek to support future
studies for underground block cave mining and to identify
additional zones of mineralization and expectations regarding the
construction and timing of a new resource model for drilling
data.
In certain cases, forward-looking statements can
be identified by the use of words such as "plans", "expects" or
"does not expect", "is expected", "outlook", "budget", "scheduled",
"estimates", "forecasts", "intends", "anticipates" or "does not
anticipate", or "believes", or variations of such words and phrases
or statements that certain actions, events or results "may",
"could", "would", "might" or "will be taken", "occur" or "be
achieved" or the negative of these terms or comparable terminology.
By their very nature forward-looking statements involve known and
unknown risks, uncertainties and other factors which may cause the
actual results, performance or achievements of the Company to be
materially different from any future results, performance or
achievements expressed or implied by the forward-looking
statements.
In making the forward-looking statements in this
release, the Company has applied certain factors and assumptions
that are based on information currently available to the Company as
well as the Company’s current beliefs and assumptions. These
factors and assumptions and beliefs and assumptions include, the
risk factors detailed from time to time in the Company’s interim
and annual financial statements and management’s discussion and
analysis of those statements, all of which are filed and available
for review on SEDAR at www.sedar.com. Although the Company has
attempted to identify important factors that could cause actual
actions, events or results to differ materially from those
described in forward-looking statements, there may be other factors
that cause actions, events or results not to be as anticipated,
estimated or intended, many of which are beyond the Company’s
ability to control or predict. There can be no assurance that
forward-looking statements will prove to be accurate, as actual
results and future events could differ materially from those
anticipated in such statements. Accordingly, readers should not
place undue reliance on forward-looking statements and all
forward-looking statements in this news release are qualified by
these cautionary statements.
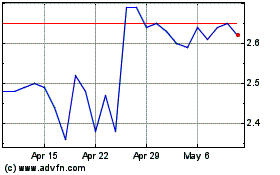
Imperial Metals (TSX:III)
Historical Stock Chart
From Dec 2024 to Jan 2025

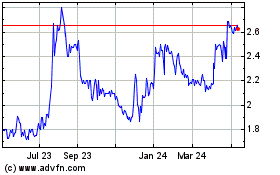
Imperial Metals (TSX:III)
Historical Stock Chart
From Jan 2024 to Jan 2025
