Key Support Levels: $0.25, $0.20, $0.15

XRP/USD Long-term Trend: Bearish
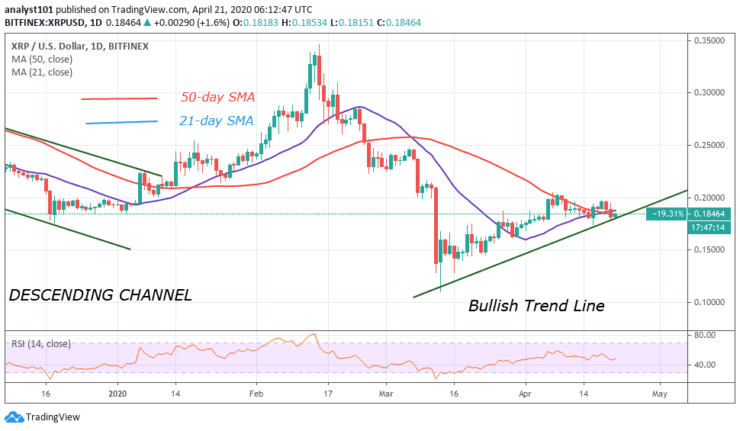
Ripple has continued to sink after failing to hold above $0.18. Its initial battle was at $0.20500 resistance. After two unsuccessful attempts to break it, it was repelled to $0.18 low. The bulls regrouped and moved up but were stopped at the $0.19500 resistance.
Since April 10, the market has been fluctuating between $0.18 and $0.19500 to break the minor resistance at $0.19500. The bears have overwhelmed the bulls as the $0.18 support is under threat. The bears broke the current support as the bulls pulled back at $0.18450 high at the time of writing.

Daily Chart Indicators Reading:
Recently, the coin has continued its downward move as it has been repelled at the $0.20500 and $0.19500 resistances.XRP has fallen to level 47 of the Relative Strength Index period 14. It means it is in the downtrend zone and below the centerline 50.
XRP/USD Medium-term Trend: Bullish
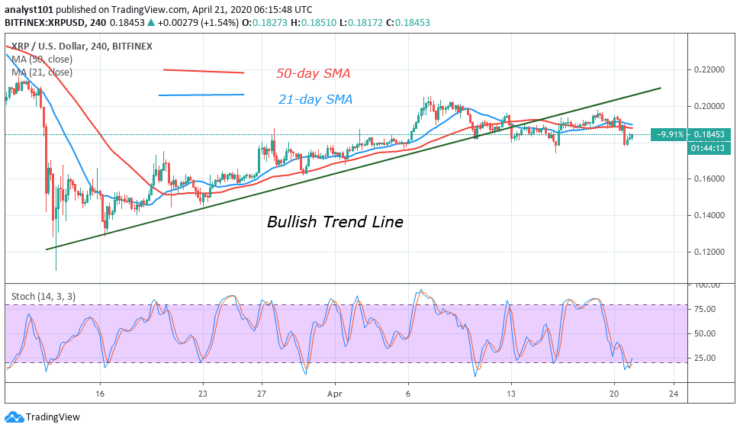
On the 4 hour chart, Ripple is in an uptrend. A trend line is drawn showing the support levels of price. The upward move has been hindered by the $0.20500 and $0.19500 resistances. The bears have broken below $0.18 but the bulls pulled back above the support.

4-hour Chart Indicators Reading
The 50-day and the 21-day SMA are sloping upward indicating the upward move. XRP has fallen below 20% range of the daily stochastic. This implies that Ripple is in the oversold region. Buyers are likely to emerge to push XRP upward move.
General Outlook for Ripple (XRP)
Ripple continues to fall after being resisted from the $0.20500 and $0.19500 price level. The bulls are presently defending the $0.18 support. On the downside, if the bears break below the $0.18 support, XRP will drop to $0.174 or $0.17. In the meantime, the $0.18 support is likely to hold as the coin is in a bullish momentum.
Source: https://learn2.trade

 Hot Features


