Hot Features

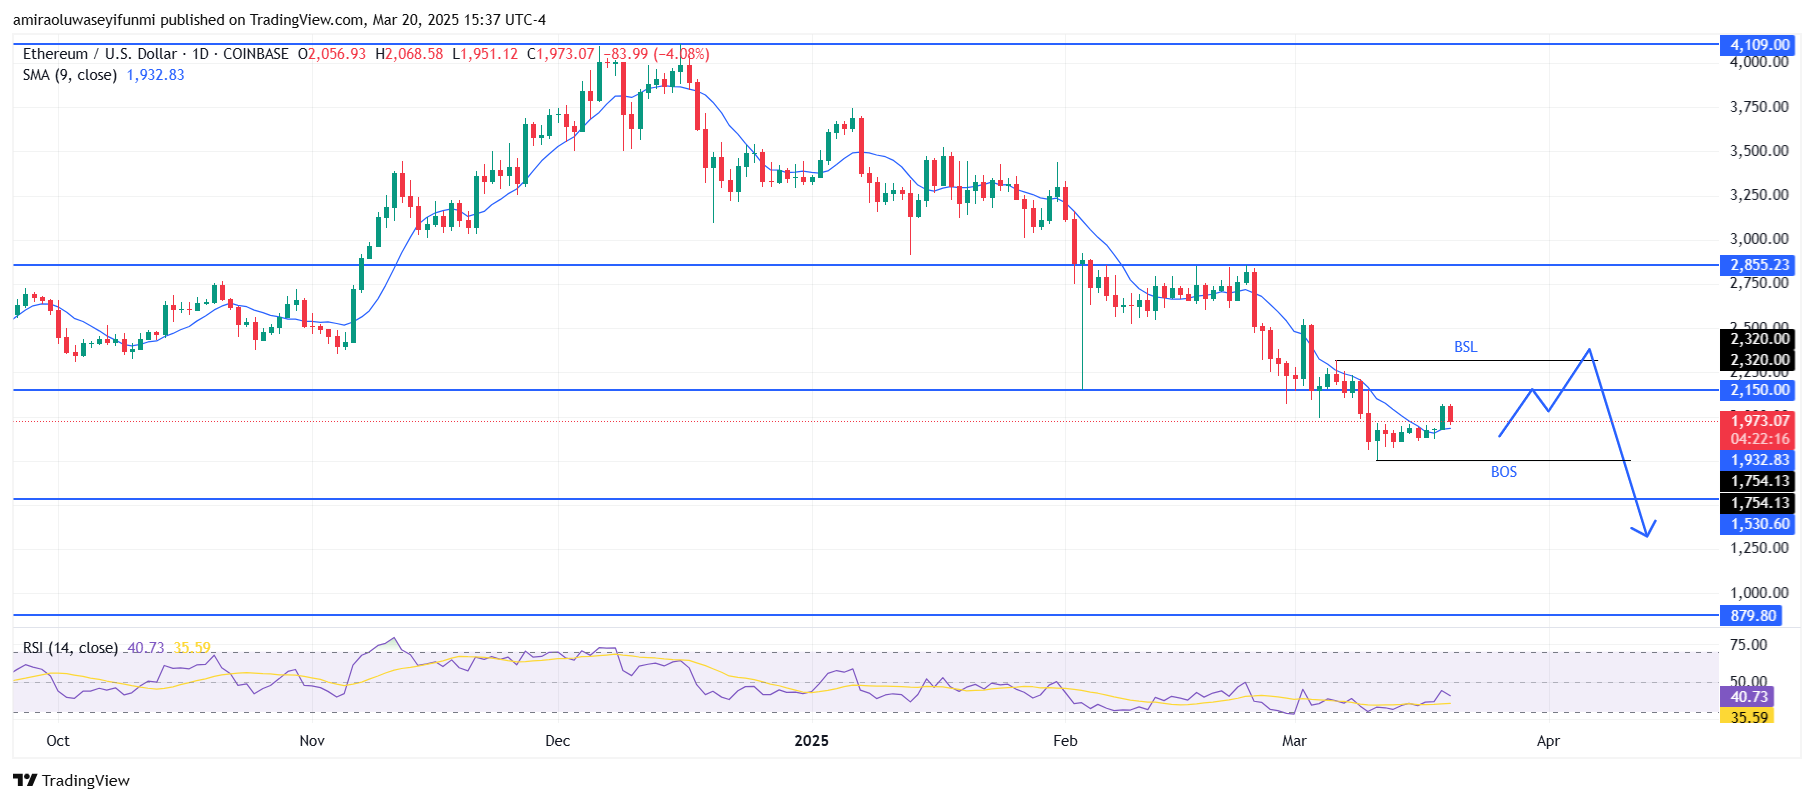
ETHUSD shows bearish continuation signals with further downside potential. Price action shows a break of structure (BOS) around $1,750, confirming bearish dominance. The price recently tapped into the $2,150 level, which acts as a key resistance zone. Additionally, buy-side liquidity (BSL) near $2,320 may attract a short-term retracement before further declines. The market has consistently formed lower highs and lower lows, reinforcing the ongoing bearish structure.
If the bearish momentum holds, ETHUSD is likely to face further rejection at $2,150 or $2,320 before moving lower. A sustained break below $1,750 could open the door for a drop toward the $1,530 support level. In the event of increased selling pressure, a further decline toward $880 may become a long-term possibility. Traders should monitor the price reaction near key resistance levels for confirmation of the next bearish wave.
ETH Key Levels
Supply Levels:$2150, $2860, $4110
Demand Levels: $1750, $1530, $880
What Are the Indicators Saying?
The ETHUSD daily chart indicates a bearish outlook, supported by technical indicators. The 9-day Simple Moving Average (SMA) at approximately $1,930 is acting as dynamic resistance, limiting upward momentum. The Relative Strength Index (RSI) is at 40.71, signaling weak buying pressure and a continuation of the bearish trend. With the RSI hovering near oversold territory (35.59), there is limited room for upward correction before further declines.
Learn from market wizards: Books to take your trading to the next level