Hot Features

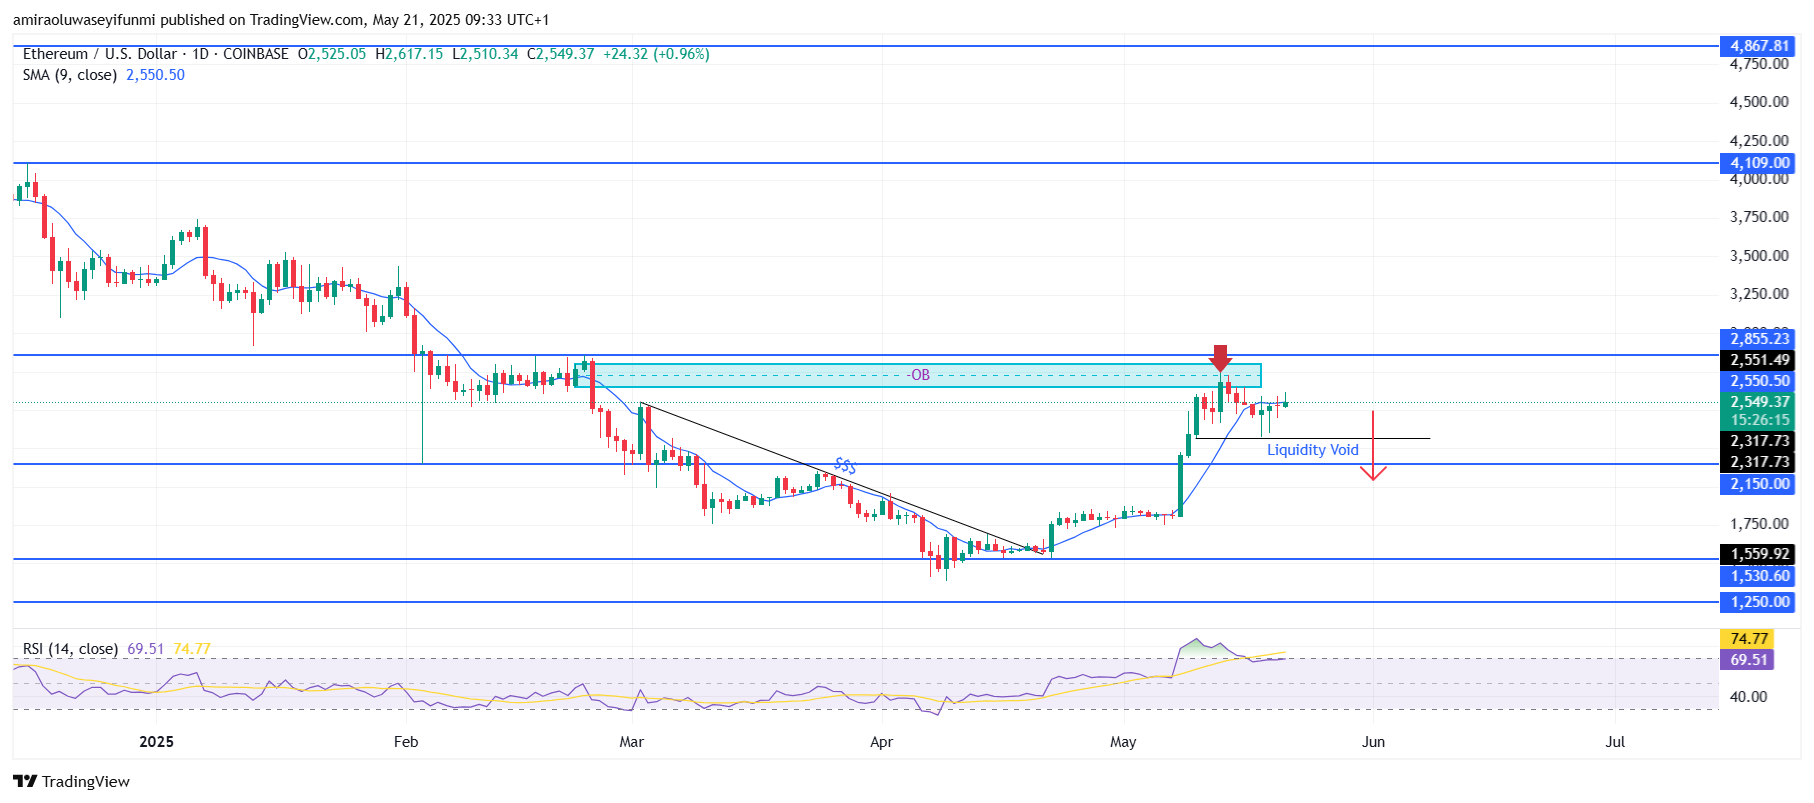
ETHUSD faces rejection at the order block and eyes downside levels. Price action shows that ETHUSD recently tested and was rejected at a significant order block between $2,550 and $2,860. A red bearish candle emerged after touching this supply zone, indicating institutional sell pressure. The failure to hold above $2,550, despite previous bullish attempts, further validates this area as a strong resistance. Additionally, the chart shows a previous break in structure followed by a bearish market shift, suggesting the current rally may be a retracement rather than a trend continuation.

Looking forward, ETHUSD may attempt to fill the visible liquidity void beneath current levels. A breakdown from the $2,550 zone could lead to a sharp move toward the next major support levels around $2,150. If bearish momentum intensifies, the market could extend losses to $1,560 or even $1,530, where the previous demand zone lies. Overall, unless bulls reclaim and hold above $2,860 with strong volume, the bias remains bearish with further downside expected in the coming days.
 ETH Key Levels
Supply Levels: $2860, $4110, $4870
Demand Levels: $2150, $1530, $1250
What are the indicators saying?
On the daily chart, ETHUSD shows signs of weakness, with indicators supporting a bearish outlook. The price is currently trading around $2,550, which coincides with the 9-day Simple Moving Average (SMA), indicating a potential pivot point. The Relative Strength Index (RSI) is hovering near 69, just below the overbought region, suggesting slowing bullish momentum and the possibility of a reversal. The proximity to the 70 level means any further downside pressure could tilt the RSI toward neutral, confirming weakening buying strength.
Learn from market wizards: Books to take your trading to the next level