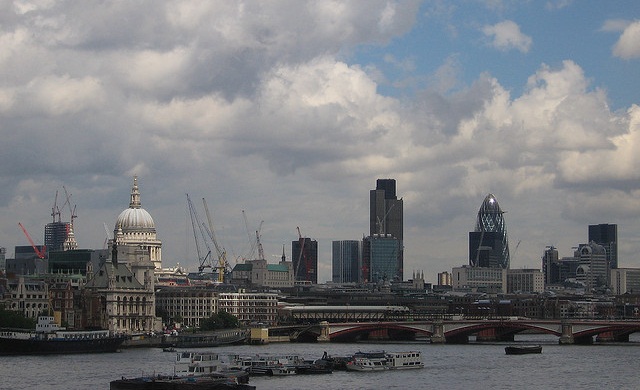
TClarke (LSE:CTO), specialists in supplying and fitting the electrics, mechanical items and ICT systems to make buildings work, are major subcontractors for many of the notable tall buildings in central London, e.g. the Shard, and for other less prestigious buildings around the country.

The Great Recession caused losses, as the managers tendered for work at below cost. In the last two years margins have been rebuilt, because managers can afford to be much more choosey in accepting offers for tender.
They can charge higher prices because they are one of the few teams of electrical and mechanical fitters (1,376 strong) who can take on a complex building.
Now that there is a boom in building completions TClarke is well positioned to benefit from the pressure on principal contractors to hire reliable and capable subcontractors.
In the last property boom in 2006 its shares reached £2.50. I bought in November 2015 at 79.16p.
Following the announcement of the results for the period to December 2016 they are now at 78.25p – 80p, giving a market capitalisation of 41.6m shares x 80p = £33.3m.
(Previous Newsletters: 5th – 10th Nov 2015, 19th Nov 2015 26th Nov 2015, 20th – 22nd April 2016, 9th May 2016)
Cyclically adjusted price earnings ratio
I bought TClarkes shares for my Modified cyclically adjusted price earning ratio, CAPE, portfolio. Let’s look at an updated calculation of its CAPE.
| Pence per share | EPS (Basic) | EPS (“adjusted”) | Dividend |
| 2007 | 14.33 | 14.33 | 12 |
| 2008 | 22.12 | 26.67 | 13 |
| 2009 | 10.03 | 12.51 | 13 |
| 2010 | 8.91 | 12.44 | 8.5 |
| 2011 | 9.69 | 7.34 | 3 |
| 2012 | 2.05 | 4.4 | 3 |
| 2013 | 2.51 | 4.14 | 3.1 |
| 2014 | -1.58 | 1.06 | 3.1 |
| 2015 | 0.13 | 8.16 | 3.1 |
| 2016 | 5.45 | 11.6 | 3.2 |
| AVERAGE | 7.36 | 10.27 |
The CAPE using basic eps: 80p/7.36p = 10.9……………………………….To read the rest of this article, and more like it, subscribe to my premium newsletter Deep Value Shares – click here http://newsletters.advfn.com/deepvalueshares/subscribe-1

 Hot Features


