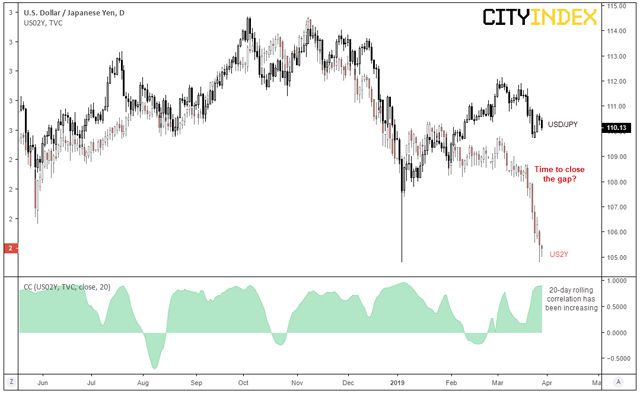
With bond yields continuing to fall, it’s becoming too difficult for other markets to ignore and raises the prospects that sentient could finally crack. And that could see a lower USD/JPY.
Whilst equity markets remain defiantly near cycle highs, they have shown signs of wobbling. Furthermore, we’re watching other markets feel the strain following an otherwise positive start to the year. CAD/CHF tracks a bearish path, emerging markets appear to be carving out a triple top, copper’s breakout failed and USD/CHF rolled over from its high. And finally, USD/JPY is showing signs of joining yields lower.

We’ve been waiting a while for the positive correlation to return between USD/JPY and US2Y. When it broke down near the end of February, yields remained stuck in a choppy, sideways range whilst USD/JPY grinded higher in a corrective fashion. Yet with the sharp drop in yields and USD/JPY now turning lower, we’re waiting to see if it can roll over and close its gap.

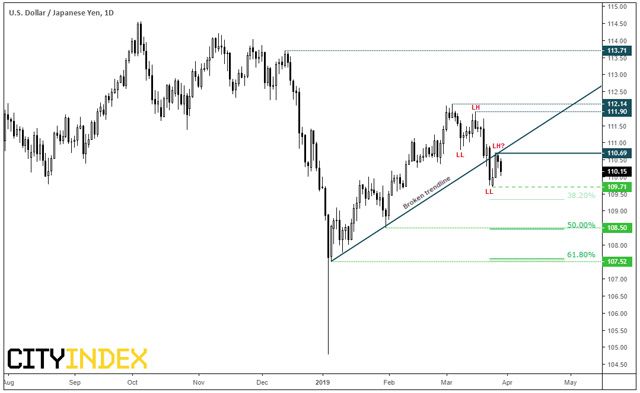
We can see on the daily chart that USD/JPY has carved out a series of lower highs and lows and, more recently, broken its bullish trendline. The trendline has already been respected as resistance, although it’s not uncommon to see markets creep up inside a broken trendline before finally rolling over (gold is a good example of this right now). Therefore, we’d allow some breathing room for it to carve out some interim highs before turning lower – assuming it does, of course. But with prices already turning lower we may have seen a swing high at 110.69.
Therefore, a direct break below 109.70 assumes a run towards the 108.50 and 107.52 lows where the 50% and 61.8% retracement levels also reside. Whilst the 38.2% may provide support, we’re less concerned by it as there are no other technical levels in the area to provide a stronger argument for the level holding. A break above the broken trendline and / or the 110.69 puts this onto the backburner.
City Index: Spread Betting, CFD and Forex Trading on 12,000+ global markets including Indices, Shares, Forex and Bitcoin. Click here to find out more.

 Hot Features


