Solana Reclaims Key Levels Amid Market Volatility – Reclaim $210 And New Highs Are Next
January 14 2025 - 8:00PM
NEWSBTC
Solana (SOL) finds itself at a crucial juncture following a
volatile day of trading. The price plunged over 11%, briefly
dipping below the $170 mark before staging an impressive recovery.
In just a few hours, SOL managed to reclaim the $182 level, a
critical demand zone that has proven to be a key area of interest
for investors. Related Reading: Ethereum Is Forming A 1-Hour
Symmetrical Triangle – Bullish Breakout Or Deeper Correction? Top
analyst Jelle shared a technical price chart highlighting Solana’s
resilience during this turbulent period. According to Jelle, SOL
took out its recent lows, successfully retested the 200-day
exponential moving average (EMA), and ultimately closed the day
above all significant key levels. This pattern indicates potential
strength in the market and raises the question: what’s next for
Solana? Investors and traders are eyeing the next move
as Solana consolidates above its critical demand zone. Will
Solana leverage this recovery to push toward new highs, or will
bearish pressure take over again? The coming days will be pivotal
in determining the trajectory of this market leader. Solana Shows
Strength After Weeks of Selling Pressure Solana (SOL) is displaying
renewed strength after enduring a 36% decline from its all-time
high of $264 in late November to yesterday’s low of $168. The sharp
drop followed weeks of consistent selling pressure, leaving
investors uncertain about the immediate future. However, optimism
is beginning to return as SOL shows signs of resilience. Top
analyst Jelle shared a technical analysis on X, highlighting
Solana’s impressive recovery in recent price action. According to
Jelle, SOL took out its recent lows, retested the 200-day
exponential moving average (EMA) successfully, and closed the day
above all critical levels. This behavior suggests that buyers are
stepping in at key support zones, providing a much-needed lifeline
to the price. Jelle also points out that reclaiming the $210 mark
could set the stage for Solana to challenge its previous highs.
While optimism builds following yesterday’s rebound, caution is
warranted as further consolidation or retests of support levels
remain possible. The market’s next phase will largely depend on
whether Solana can maintain its newfound momentum. Related Reading:
Chainlink Forms A Daily Bullish Pattern – Top Analyst Eyes Breakout
To $30 As SOL continues to stabilize, investors are keeping a close
eye on critical resistance levels, particularly the $210 mark,
which could signal the start of a new bullish trend. However, with
lingering risks, the coming days will be crucial in determining
Solana’s ability to sustain its recovery and potentially move
toward new highs. Price Action: Testing Crucial Levels Solana (SOL)
is trading at $186, showing signs of stabilization after a sharp
recovery from its recent lows. However, the price has yet to
confirm a breakout above the $192 level, a critical resistance zone
that bulls need to reclaim to shift market sentiment and
potentially change the current trend. A successful reclaim of the
$192 mark would signal strength and open the door for further
upside. The next significant target for SOL would be breaking above
the local high near $223, which could pave the way for a broader
bullish trend. Such a move would likely attract renewed investor
interest and signal that the market is ready for a sustained rally.
On the flip side, failing to reclaim the $192 level could expose
Solana to downside risks. In such a scenario, the price may revisit
lower demand zones, potentially testing support levels around $170.
This would extend the consolidation phase and delay any significant
upward momentum. Related Reading: XRP Scores A Lower High Break On
Daily – ATH Next? The next few days will be crucial for SOL, as
bulls and bears battle for control at these pivotal levels. Traders
and investors should watch closely to determine whether Solana can
overcome resistance or faces further consolidation. Featured image
from Dall-E, chart from TradingView
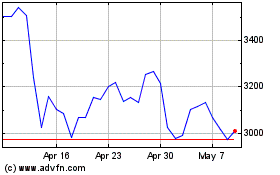
Ethereum (COIN:ETHUSD)
Historical Stock Chart
From Dec 2024 to Jan 2025

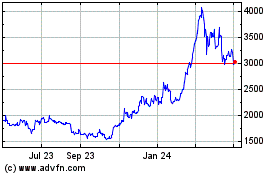
Ethereum (COIN:ETHUSD)
Historical Stock Chart
From Jan 2024 to Jan 2025
