FTSE 4Good USA 100 Key Figures
|
FTSE 4Good USA 100 Balance Sheet| %1$s Balance Sheet | | Sorry No Data Available |
|
 Share Price Performance| Share Price Performance | | Sample Period † | High | Low | | 1 week | 26,692.04 | 25,770.60 |
| 4 weeks | 26,692.04 | 25,170.20 |
| 12 weeks | 26,692.04 | 24,828.85 |
| 1 year | 26,692.04 | 20,864.45 |
Share Price Chart (5 years)| Share Price Chart (5 years) | 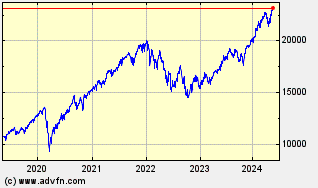 |
|
FTSE 4Good USA 100 Historic Returns| %1$s Historic Returns | | Giorni da oggi † | Open | Change | % | Open Avg. | Avg. Daily Vol [m] | Total Vol [m] | VWAP | | 1 week | 25,770.60 | 769.60 | 2.99 | 25,770.60 | - | | - |
| 4 weeks | 26,395.10 | 145.10 | 0.55 | 25,170.20 | - | | - |
| 12 weeks | 24,911.31 | 1,628.89 | 6.54 | 24,828.85 | - | | - |
| 26 weeks | 24,673.90 | 1,866.30 | 7.56 | 22,435.92 | - | | - |
| 1 year | 21,012.70 | 5,527.50 | 26.31 | 20,864.45 | - | | - |
| 3 years | 18,302.16 | 8,238.04 | 45.01 | 14,160.95 | - | | - |
| 5 years | 13,258.71 | 13,281.49 | 100.17 | 8,951.92 | - | | - |
| † periods calculated are whole weeks rather than calendar months | |
|
