Form SCHEDULE 13D/A - General Statement of Acquisition of Beneficial Ownership: [Amend]
February 06 2025 - 7:00PM
Edgar (US Regulatory)
SCHEDULE 1
Transactions in the Shares of Common Stock of the
Issuer by the Reporting Person During the Past Sixty (60) Days
The following table sets
forth all transactions in the shares of Common Stock reported herein effected during the past sixty (60) days by the Reporting Person.
Except as noted below, all such transactions were effected by the Reporting Person in the open market through brokers and the price per
share excludes commissions. Where a price range is provided in the column titled “Price Range ($)”, the price reported in
the column titled “Price Per Share ($)” is a weighted average price. These shares of Common Stock were sold or purchased in
multiple transactions at prices between the price ranges indicated in the column titled “Price Range ($)”. The Reporting Person
will undertake to provide to the staff of the SEC, upon request, full information regarding the shares of Common Stock sold or purchased
at each separate price.
| Trade Date |
Shares Purchased (Sold) |
Price Per Share ($) |
Price Range ($) |
| 01/10/2025 |
(250,000) |
33.12 |
32.69 – 33.53 |
| 01/10/2025 |
(1,000,000) |
33.17 |
32.69 – 33.53 |
| 01/13/2025 |
(1,250,000) |
32.61 |
32.26 – 32.98 |
| 01/14/2025 |
(1,000,000) |
33.03 |
32.73 – 33.21 |
| 01/31/2025 |
(1,300,000) |
30.71 |
30.51 – 30.94 |
| 02/03/2025 |
(950,000) |
30.62 |
30.48 – 30.84 |
| 02/06/2025 |
62,000 |
30.96 |
30.92
– 31.00 |
| |
|
|
|
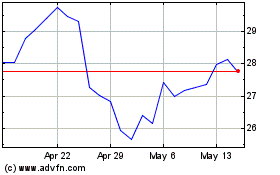
Southwest Airlines (NYSE:LUV)
Historical Stock Chart
From Jan 2025 to Feb 2025

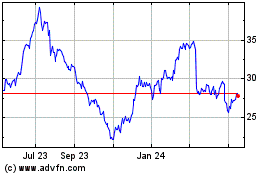
Southwest Airlines (NYSE:LUV)
Historical Stock Chart
From Feb 2024 to Feb 2025
