 Drmicrocap
11 years ago
Drmicrocap
11 years ago
Carroll Shelby Cal Baseball Day at University of California, Berkeley Proves a Success, to Become Annual Tradition
Business Wire Carroll Shelby International
February 18, 2014 12:59 PM
GARDENA, Calif.--(BUSINESS WIRE)--
Carroll Shelby International (CSBI.PK), the parent company of Carroll Shelby Licensing and Shelby American, announced today that the first annual Carroll Shelby Cal Baseball, which was held on Saturday, Feb. 15, 2014, at Evans Diamond located on the campus of the University of California, Berkeley, was a success. It will become an annual event beginning in 2015.
“The Carroll Shelby Cal Baseball Day was a testament of the excitement that surrounds the Shelby brand,” said Ari Kopmar, executive vice president of consumer initiatives. “We successfully bridged America’s favorite performance car with America’s favorite past time in a way that’s never been done before. Not only was our reception strong among Shelby and Ford enthusiasts, but the support from the baseball fans and university students was tremendous. We’re excited about making the Carroll Shelby Cal Baseball Day an annual tradition.”
A special “Show and Shine” car exhibit was located outside the stadium and featured Shelby and Ford-powered cars owned by Team Shelby members and Ford enthusiasts from across northern California. Among the featured Ford Shelby Mustangs was Mark Lopez’s ’66 Shelby GT350, which has been owned by his family since they purchased it in 1967. It was originally sold by Shelby American to Competition Press, who then sold it to the Lopez family.
“I was a little apprehensive about hosting a Team Shelby event in conjunction with a college baseball game,” said Michael McGuirk, president of the California Team Shelby region. “However, Carroll Shelby Cal Baseball Day turned out to be a spectacular event that Shelby and baseball fans alike fully embraced. The Shelby and Ford ‘Show and Shine’ generated a lot of foot traffic and exposed the Shelby brand to a younger demographic. The support our Team Shelby chapter received from Carroll Shelby International was phenomenal.”
In addition to the “Show and Shine,” Carroll Shelby Cal Baseball Day was kick started with a special video presentation about Carroll Shelby and his contribution to American muscle car performance. Neil Cummings, co-CEO of Carroll Shelby International and a trustee for the Carroll Shelby Foundation, threw the opening pitch for the first double header game; Joe Conway, Co-CEO of Carroll Shelby International and CEO of Shelby American, threw the opening pitch for the second game. Shelby merchandise including apparel, die cast collectibles and remote control cars were used as prizes during the game. An animated race video featuring a Shelby Super Snake GT500, Shelby Daytona Coupe and Shelby Cobra was also created for the event and will be shown at games throughout the season.
Dates for the 2015 Carroll Shelby Cal Baseball Day are still being considered.
About Carroll Shelby Licensing
Auto manufacturer and entrepreneur Carroll Shelby is one of the most famous and successful high performance visionaries in the world. A pioneer for modern automotive licensing programs, he began licensing his name and designs for various products beginning in the 1960s. He founded Carroll Shelby Licensing Inc., which is the exclusive holder of trademarks and vehicle design rights for some of the most famous muscle cars and high-performance vehicles. CSL also holds trademark rights for Shelby-branded apparel, accessories and collectibles. For more information about the company or licensing opportunities, call (310) 914-1843, fax (310) 538-8189 or write CSL at 19021 S Figueroa St., Gardena, CA 90248, or visit carrollshelby.com, shelbylicensing.com or carrollshelbyinternational.com.
About Shelby American, Inc.
Shelby American manufactures and markets performance vehicles and related products. The company builds authentic continuation Cobras, including the 427 S/C, 289 FIA and 289 street car component vehicles. Shelby American offers the Shelby 1000, GT500 Super Snake, GT and GTS post-title packages for the 2005-2014 Ford Mustang, as well as the 2013-2014 Shelby Focus ST and 2012-2014 Ford Raptor. For more info, visit www.shelbyamerican.com.
Safe Harbor Statement
The statements contained in this press release that are not purely historical, including statements regarding the Company’s expectations, hopes, beliefs, intentions, or strategies regarding the future, are forward-looking statements within the meaning of Section 27A of the Securities Act of 1933, as amended, and Section 21E of the Securities Exchange Act of 1934, as amended. Actual results may differ materially from those expected because of various known and unknown risks and uncertainties, including, but not limited to, the continuing effects of the U.S. recession and global credit environment, other changes in general economic and industry conditions, the award or loss of significant client assignments, timing of contracts, recruiting and new business solicitation efforts, currency fluctuations, and other factors affecting the financial health of our clients. These and other risks are described in the Company’s most recent annual report on Form 10-K and subsequent reports filed with or furnished to the U.S. Securities and Exchange Commission. The forward-looking statements included in this press release are based on information available to the Company on the date hereof, and the Company assumes no obligation to update any such forward-looking statements.
Contact:
TimePiece PR & Marketing
Scott Black, 214-520-3430
SBlack@TPRM.com
Drmicrocap
11 years ago
Shelby American Commemorates 50th Anniversary FIA Cobra with Special Edition Car
Iconic Shelby FIA Cobra to be Celebrated
Business Wire Shelby American, Inc.
January 17, 2014 1:03 PM
Shelby American Commemorates 50th Anniversary FIA Cobra with Special Edition Car.
View photo
To celebrate the birth of the 289 Ford powered roadsters, Shelby American will offer 50 limited edition …
SCOTTSDALE, Ariz.--(BUSINESS WIRE)--
In 1964, Shelby American, today a wholly owned subsidiary of Carroll Shelby International Inc. (CSBI:PK) introduced the FIA version of the small block Cobra, which competed in the 1964 World Manufacturers Championship series against marques like Aston Martin, Jaguar and Corvette. To celebrate the birth of the 289 Ford powered roadsters, Shelby American will offer 50 limited edition continuation (CSX7000) Shelby 289 FIA Cobras. Each will be painted “Viking Blue” with FIA stripes and roundels, feature a black FIA interior, special billet anniversary badges, original style wheels and a variety of additional options. The 50th Anniversary FIA Shelby Cobra will be introduced at the annual Barrett-Jackson Auction in Scottsdale, Ariz, on Friday, Jan. 17, 2014.
“The 289 FIA Shelby Cobras were among the most important cars in American racing history,” said John Luft, president of Shelby American. “The FIA Cobras built during that period were piloted by racing legends including Ken Miles, Dan Gurney, Phil Hill and Bob Bondurant. Thus, some of the most revered drivers in the sport put the 289 FIA Cobra into the winner’s circle. Combining a robust, powerful American engine with a lightweight chassis was sheer brilliance. Shelby’s formula still resonates today and is followed by automakers worldwide.”
Shelby American built the 289 FIA Cobras for racing; modifications included a new dash, widened front and rear fenders, cut-back doors, new dampers, racing wheels featuring the pin-drive hub, oil cooler scoops and a competition spec 289 small block engine.
Today, the CSX7000 Continuation Shelby Cobra 289 FIA’s are component vehicles that can be fitted with a proper drive train by a customer or automotive professional. Each car is built to order and delivered as a rolling chassis, less drive train, with a Shelby American issued MSO.
“Our CSX7000 cars incorporate safety and performance improvements, without sacrificing driving excitement or originality,” added Vince LaViolette, senior designer and head of R&D at Shelby American. “With a small block V8 pushing only 2,100 lbs., it’s the lightest Cobra ever built with an incredible power-to-weight ratio. This allows the small block Cobra to dive deep into corners and pull through with incredible precision and accuracy.”
The Continuation Shelby Cobra 289 FIA vehicles retain everything from the authentic style suspension to the graceful body lines, but are upgraded to contemporary standards. Shelby American uses modern disc brakes, a stronger frame and the bodies are available in either aluminum or fiberglass. The 50th Anniversary Edition also features a complete exhaust for a small block Ford V8, a special fitted car cover and optional detachable steering wheel.
“The importance and historical significance of these cars was the fact that they brought a small shop in Southern California to the forefront of international racing on two continents within the same year,” said Shelby Expert and SAAC Member Jeff Gagnon. “Shelby American took it to Ferrari, Corvette and other well-supplied, well-funded and established race teams and manufacturers. That was no small feat, even in those simpler times.”
The 50th Anniversary CSX7000 FIA Continuation Cobra will begin at $94,995 for a fiberglass or $159,995 for an aluminum bodied car, excluding drive train. Each will be documented in our ‘World Registry’ by Shelby American. Cobras can be purchased through a network of Shelby American Cobra dealers. Information about options and availability can be found at http://www.shelbyamerican.com/50fia.asp.
About Shelby American, Inc. and Carroll Shelby Licensing
Founded by legend Carroll Shelby, Shelby American manufactures and markets performance vehicles and related products. The company builds authentic continuation Cobras, including the 427 S/C, 289 FIA and 289 street car component vehicles; it offers the Shelby GT, 1000, GT350, GT500 Super Snake and GTS post-title packages for the 2005-2014 Ford Mustang. Shelby American also builds the Shelby Raptor muscle truck and Shelby Focus ST hot hatch. For more information, visit www.shelbyamerican.com. Shelby American is a subsidiary of Carroll Shelby International Inc. (CSBI.PK). Carroll Shelby Licensing Inc., also a wholly owned division, is the exclusive holder of Carroll Shelby's trademarks and vehicle design rights. It also holds trademark rights for Shelby-branded apparel, accessories and collectibles. Info is at www.shelbylicensing.com.
Photos/Multimedia Gallery Available: http://www.businesswire.com/multimedia/home/20140117005705/en/
MULTIMEDIA AVAILABLE:http://www.businesswire.com/cgi-bin/mmg.cgi?eid=50785926&lang=en
Contact:
TPRM
Scott Black, 214-520-3430
sblack@tprm.com
Drmicrocap
11 years ago
Shelby American Brings Back Iconic Shelby GT for 2014 with World-Class Power and Performance
Supercharged Optioned Shelby GT/SC Offers up to 624 HP
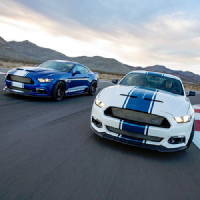
Shelby GT unveiled at the LA Auto Show
Available in 430 HP naturally aspirated, 525 HP or 624 HP GT/SC versions
Shelby GT/SC version expected to go 0-60 mph in 3.7 seconds
Business Wire Shelby American, Inc.
November 21, 2013 2:30 PM
Shelby American Brings Back Iconic Shelby GT for 2014 with World-Class Power and Performance.
View gallery
Shelby GT unveiled at the LA Auto Show. Available in 430 HP naturally aspirated, 525 HP or 624 HP GT/SC …
LOS ANGELES--(BUSINESS WIRE)--
Shelby American, a wholly owned subsidiary of Carroll Shelby International Inc. (CSBI:PK), returned one of its most popular cars to the lineup today by unveiling the Shelby GT at the LA Auto Show. The new generation Shelby GT is based on the 2014 Ford Mustang GT with an incredibly attractive base price and 430 HP. The optional Shelby GT/SC supercharged model comes in either a 525 HP or a staggering 624 HP version, making it the most potent version of the car ever made.
“The Shelby GT was one of the most important vehicles in modern day Shelby history,” said John Luft, president of Shelby American. “It kicked off Shelby’s rebirth in Las Vegas by putting a Mustang-based small block car into Ford dealerships. Ever since the Shelby GT went out of production, people have clamored for its return.”
In 2007, Ford Division, Carroll Shelby and Ford Racing created the Shelby GT. Beginning as 4.6L Mustang GT’s assembled at Ford’s Flat Rock, Mich. plant, they were shipped to Shelby in Las Vegas for transformation. The 320 HP 2007 Shelby GT coupes were all Performance White or Black with silver stripes. In 2008, Shelby added Vista Blue and a choice of coupe or convertible. About 8,000 Shelby GT’s were built.
The Shelby GT was wildly popular and the people who snagged one have been one of the most passionate owner groups. The cars were often tailored with custom parts to fit an owner’s personality and then driven hard on both the street and track. The Shelby GT totally dominated its SCCA racing class in 2007 and 2008.
“Based on the standard Mustang GT, the total cost of our entry-level 2014 Shelby GT is only about $45,000, yet offers so much more than the previous model,” said, Gary Patterson, Shelby American VP of Sales. “The performance-to-price ratio makes the Shelby GT perfect for any serious pony car enthusiast.”
The new Shelby GT is a post-title program; Ford dealers send a customer’s Mustang GT coupe or convertible to Shelby for upfit. Every material performance aspect of the car is enhanced or replaced to create a potent, balanced performer worthy of the Shelby name. Entry-level package upgrades include a Ford Racing suspension, Shelby branded exhaust, intake and engine tune for 430 HP, specially designed wheels and tires, short shifter, hood and Le Mans stripes that make it uniquely Shelby. Every Shelby GT version is 50 state emissions legal and runs on pump gas.
One of the car’s most appealing aspects is the opportunity for personalization. Choosing from an array of options, customers can opt for a more hard-edged suspension, better braking and supercharger upgrades, as well as a vast selection of performance and styling parts from Shelby Performance Parts.
“While the Shelby GT is very affordable for such an exclusive vehicle, a post title program allows us to take performance to new levels,” said Shelby American VP of Production, Gary Davis. “Working with partners like Ford Racing, it is docile enough to be a daily driver and still dominate the track on the weekends.”
The 624 HP Shelby GT/SC version is expected to blast from 0-60 mph in about 3.7 seconds; the quarter mile time should be in the mid 11 second range. The car should also pull over 1 G on the lateral skid-pad.
“No other carmaker offers this level of performance, heritage and iconic styling at this price, making the Shelby GT the best all-around American car in its class,” said Luft. “Each car will be issued a Shelby American CSM number for documentation in our Shelby American Worldwide Registry to help maximize potential future value.”
The price of the base Shelby GT package, not including the car, is $14,995, making a nicely equipped car about $45,000 in total. The Shelby GT/SC package begins at $27,995. Customers can build their Shelby GT online at www.shelbyamerican.com/2014shelbygt.
About Shelby American, Inc. and Carroll Shelby Licensing
Founded by legend Carroll Shelby, Shelby American manufactures and markets performance vehicles and related products. The company builds authentic continuation Cobras, including the 427 S/C, 289 FIA and 289 street car component vehicles; it offers the Shelby GT, 1000, GT350, GT500 Super Snake and GTS post-title packages for the 2005-2014 Ford Mustang. Shelby American also builds the Shelby Raptor muscle truck and Shelby Focus ST hot hatch. For more information, visit www.shelbyamerican.com. Shelby American is a division of Carroll Shelby International Inc. (CSBI.PK). Carroll Shelby Licensing Inc., also a wholly owned division, is the exclusive holder of Carroll Shelby's trademarks and vehicle design rights. It also holds trademark rights for Shelby-branded apparel, accessories and collectibles. Info is at www.shelbylicensing.com.
Photos/Multimedia Gallery Available: http://www.businesswire.com/multimedia/home/20131121006297/en/
MULTIMEDIA AVAILABLE:http://www.businesswire.com/cgi-bin/mmg.cgi?eid=50756223&lang=en
Contact:
TPRM
Scott Black, 214-520-3430
sblack@tprm.com
 Papa Bear
11 years ago
Papa Bear
11 years ago
CBSI: Recent Shelby American News!
www.marketwatch.com/story/shelby-american-renews-planet-shelby-cobras-dealer-and-license-agreements-2013-08-01
press release
Aug. 1, 2013, 11:15 a.m. EDT
Shelby American Renews Planet Shelby Cobra's Dealer and License Agreements
LAS VEGAS, Aug 01, 2013 (BUSINESS WIRE) -- Officials with Shelby American, a wholly owned subsidiary of Carroll Shelby International Inc., (CSBI.PK), announced today that Planet Shelby Cobra's dealer and licensing agreements have been renewed. Under the new five year agreements, Planet Shelby Cobra can immediately resume the sale and delivery of official Shelby Cobras to its impressive base of customers.
"We're pleased that one of our most important advocates and Shelby Cobra dealers will stay in the fold," said Joe Conway, CEO of Shelby American.
"Stephen Becker, President of Planet Shelby Cobra has had a long relationship with Shelby American and its vehicles," added Neil Cummings, CEO of Carroll Shelby Licensing, Inc. "We look forward to many more years of working with Stephen to make one of the world's most famous sports cars available to the those who hunger for a truly unique American experience."
Founded by Stephen Becker, one of the world's foremost experts in Shelby cars, Planet Shelby Cobra is one of the most successful dealers in the world. In addition to offering the genuine big block, street and FIA Cobra, Planet Shelby Cobra can deliver a continuation Shelby Daytona Coupe or Shelby edition GT40. The cars are available as component rollers or completed by one of Planet Cobra's experts.
"Joe Conway and Neil Cummings are doing a tremendous job moving Shelby forward," said Stephen Becker, President and CEO of Planet Shelby Cobra. "They're continuing Carroll Shelby's legacy as the designer and builder of the most iconic and exciting sports cars in history."
From Shelby American's state of the art manufacturing facility in Las Vegas, the company builds the Cobra 427 S/C (CSX4000/6000), Cobra 289 FIA (CSX7000) and street Cobra (CSX8000) component vehicles. While still true to their heritage, these genuine Cobras incorporate subtle updates to make them even more enjoyable to own. They are available through select dealers, including Planet Shelby Cobra.
"With the 50th anniversary of the FIA Cobra in 2014 and the 427 big block Cobra in 2015, the demand for genuine Shelbys continues to build," added Becker. "There are exciting changes ahead as all the dealers work together with Shelby American to continue what Carroll Shelby started over five decades ago."
About Planet Shelby Cobra
Planet Shelby Cobra is the most trusted resource for buying and selling genuine Shelbys today. In the business for over 30 years, experts at Planet Shelby Cobra have access to unlimited contacts, databases and insider information that can help enthusiasts buy or sell a Shelby Cobra or vintage Shelby Mustang at the best possible price. Led by Stephen Becker, a well-known and respected Shelby expert, Planet Shelby Cobra offers premium customer service, unmatched experience and historically correct documentation for each vehicle sold. More information is available at www.goplanetcobra.com.
About Shelby American, Inc.
Shelby American manufactures and markets performance vehicles and related products. The company builds authentic continuation Cobras, including the 427 S/C, 289 FIA and 289 street car component vehicles. Shelby American offers the Shelby 1000, GT350, GT500 Super Snake, and GTS post-title packages for the current generation Ford Mustang, as well as the 2013 Shelby Focus ST and Shelby Raptor. For more info, visit www.shelbyamerican.com.
cts.businesswire.com/ct/CT?id=bwnews&sty=20130801006205r1&sid=cmtx6&distro=nx
SOURCE: Shelby American
 DFLY
16 years ago
DFLY
16 years ago
Recent News>>>>
Shelby Terlingua Racing Team to Celebrate Rebirth with "Bullrun" Blowout in Its Texas Birthplace
Carroll Shelby Invites Enthusiasts to Join Him at Event
Aug 8, 2008 2:14:00 PM
Copyright Business Wire 2008
View Additional ProfilesLAS VEGAS--(BUSINESS WIRE)--
Shelby Automobiles Inc., a wholly owned subsidiary of Carroll Shelby International Inc., (Pink Sheets: CSBI), Carroll Shelby and designer/artist Bill Neale are celebrating the rebirth of the famous Terlingua Racing Team with the first annual "Shelby Bullrun Challenge" in West Texas on Sept. 25-28, 2008. The event includes a combination of driving events and parties for celebrities and enthusiasts that will rival the ones that gave rise to the Terlingua legend 40 years ago.
"We created the Shelby Terlingua Racing Team so our small group of rebels could have some real fun," noted Carroll Shelby, founder of Shelby Automobiles. "Now, I'm inviting a new generation to return with me for a weekend they'll always remember."
The Shelby Bullrun Challenge is open to any enthusiast in an original Shelby vehicle (including a Cobra, Series 1, GT350, GT500, Shelby GT, Dodge GL-H, Tiger, etc.), a Ford GT or Mustang. Activities will include a challenging 350 mile rally, an open road 12 mile time trial, a competitive driving course on an airstrip and a 1/2 mile drag race in the Big Bend area. Other activities will include a car show, hole-in-one golf competition, Texas "shootout", chili cook off and autograph sessions with Mr. Shelby.
"This will be an exceptional automotive event deep in the heart of Texas," added Amy Boylan, president of Shelby Automobiles. "The Shelby Bullrun Challenge is a once-in-a-lifetime opportunity to be part of a small, intimate group with celebrities like Tom Yeager and Bill Neale, who was a co-founder of the group. And we're going to have high octane fun with some of the most fantastic cars on earth. We're even bringing some new Terlingua Racing Team supercharged Shelby Mustangs to test out."
The Terlingua Racing Team's roots began when Ford Motor Company asked Carroll Shelby to turn its Mustang into a race winner. His team created a competition version of the Shelby GT350 for that purpose. About that time, Shelby and a few close friends including Bill Neale, Dave Witts, Tom Tierney and David E. Davis, Jr., were enjoying the Terlingua area of the Texas Rio Grande region. Thumbing their nose at the establishment, they lived hard and enjoyed life to its fullest between winning races.
As a symbol of their lifestyle, Neale designed a logo that is black and yellow, with a rabbit holding his paw in the air. That livery, along with a host of performance enhancements are now part of a Shelby Automobiles post title package for the V6 Ford Mustang and current production Shelby Cobras.
"Though the Terlingua Racing Team flew under the radar after Shelby stopped building GT350s and GT500s in the 1960s, its flying high again today," noted Neale. "With Shelby Autos creating Terlingua Racing Team edition versions of the Ford Mustang and Cobra, it was time to bring back some of the extracurricular activities that make racing, and life, so much more meaningful."
The event package includes a stay at the Lajitas Resort, one of the most exclusive locations in the Southwest, all meals, drivers' welcoming dinner, final awards party, charity auction for special Terlingua and Shelby memorabilia and exclusive Team Shelby gifts. The price for the weekend is $2,500 (based on two drivers in shared accommodation). The package also includes a Team Shelby membership.
To participate in the event, contact samantha@bullrun.com or visit www.teamshelby.com.
About Shelby Automobiles, Inc. and Carroll Shelby Licensing
Founded by legend Carroll Shelby, Shelby Automobiles, Inc., (www.shelbyautos.com) manufactures and markets performance vehicles and related products. Shelby Automobiles is a division of Carroll Shelby International, Inc. (CSBI.PK). Carroll Shelby Licensing Inc., also a wholly owned division, is the exclusive holder of Carroll Shelby's trademarks and vehicle design rights. It also holds trademark rights for Shelby-branded apparel, accessories and collectibles. For information, visit www.carrollshelbyinternational.com.
Source: Shelby Automobiles Inc.
TimePiece Public Relations
Scott Black
214-520-3430 x 303
sblack@tprm-usa.com
Carroll Shelby Automotive Technology Center Launched at Northeast Texas Community College
Applications for Program Chair Now Being Accepted
Jul 17, 2008 6:50:00 PM
Copyright Business Wire 2008
View Additional ProfilesDALLAS--(BUSINESS WIRE)--
Carroll Shelby, chairman and founder of Carroll Shelby International Inc. (Pink Sheets:CSBI), and Northeast Texas Community College have created the new Carroll Shelby Automotive Technology Center to offer young people an opportunity to learn valuable skills in the automotive field. The program will include a state-of-the-art facility and instruction in automotive and body repair.
The Carroll Shelby Automotive Technology Program is expected to enroll the first class in Fall 2008. This intensive, hands-on program is designed to train mechanics to enter the workforce immediately upon graduation.
"I want to help young people improve their lives through the industry that has been so good to me," said Mr. Shelby. "By giving them valuable new skills, they can be proud, productive members of society."
The program will be housed in a new automotive facility which features a climate controlled shop space, lifts, paint booth, three classrooms with roll-up doors to bring in cars, office and shower/changing rooms. The curriculum will include real-life experience, as students will build an automobile during their last semester. The goal is for these cars to be autographed by Mr. Shelby and sold. Proceeds of the sale will be used to help sustain the program.
The college is actively seeking a program Chair. That individual will be charged with building on the current programs, which include the AAS degree in Automotive Repair, an Auto Body Repair program offering a one year certificate or a two year AAS degree and a Diesel program offering three certificates and a two-year AAS degree.
"This gift is truly a unique opportunity for NTCC," noted Dr. Herbert Riedel, NTCC Vice President for Instruction and Student Development. "The partnership with Mr. Shelby will allow us to build a world-class automotive program in Northeast Texas. It will be invaluable to our college, our region, and most importantly, to our students."
Northeast Texas Community College has served students since 1985 in a beautiful wooded, rural setting. University-bound students have a full range of quality course offerings with many extras, such as athletics intramurals, a film series, and world-class musical performances. Through partnerships with Texas A&M University - Texarkana, Texas A&M University - Commerce and The University of Texas at Tyler, students can complete a bachelor's degree in education, nursing, and social work at NTCC.
In addition to the credited program, the partnership will also include various continuing education opportunities for community members. Other future projects could also include the creation of a Shelby Automobiles modification center and a test track on the NTCC campus.
Mr. Shelby and his companies will contribute a minimum of $525,000. These funds will be designated for student scholarships and support of the program. Other sponsors are expected to join the program. Additional information is available at www.ntcc.edu.
About Shelby Automobiles, Inc. and Carroll Shelby Licensing
Founded by legend Carroll Shelby, Shelby Automobiles, Inc., (www.shelbyautos.com) manufactures and markets performance vehicles and related products. Shelby Automobiles is a division of Carroll Shelby International, Inc. (CSBI.PK). Carroll Shelby Licensing Inc., also a wholly owned division, is the exclusive holder of Carroll Shelby's trademarks and vehicle design rights. It also holds trademark rights for Shelby-branded apparel, accessories and collectibles. For information, visit www.carrollshelbyinternational.com.
Source: Shelby Automobiles, Inc.
Ford Motor Company to Help Shelby Autos Return to Racing with Road America Team
-- Shelby Automobiles continues to manufacture authentic Cobras.
Jul 15, 2008 7:42:00 PM
Copyright Business Wire 2008
View Additional ProfilesDEARBORN, Mich.--(BUSINESS WIRE)--
Thanks to Ford Motor Company's sponsorship of the 2008 Kohler International Challenge with Brian Redman at Road America, an official factory racing team from Shelby Automobiles, a wholly owned subsidiary of Carroll Shelby International Inc., (Pink Sheets:CSBI) will once again roar onto the track. Four authentic Shelby 427 Cobras will compete in the races in Elkhart Lake, Wisc., beginning July 17 through 20, 2008. This is the first factory race initiative from Shelby Autos and Ford Motor Company since 1969.
"Ford and Shelby made racing history once, so it's very exciting to come full circle again," said Carroll Shelby. "Now we're going to make history again together. My goal is to return us to professional racing and this is just the beginning."
The Kohler International Challenge with Brian Redman is one of the largest vintage gatherings in the USA with over 30 classes of cars in ten groups. Sanctioned by the Sportscar Vintage Racing Association, the event features vintage race cars competing on Road America, the world's fastest permanent road course. Tom Barnard, Vincent Dean, AC and Tim Korzen will pilot four CSX4000 427 Cobras in Group 10.
"The partnership between Ford and Shelby put the blue oval in the winners circle in everything from SCCA races to LeMans," said Robert Parker, manager of Ford Car Marketing. "We're proud to sponsor the Shelby team for the Road America Races and look forward to participating side by side with our fans and consumers."
Shelby cars dominated the racing scene during the 1960's through its own efforts or factory support of private teams. The 289 and 427 Cobras won road racing and drag racing championships worldwide while Ford Shelby Mustangs trounced sedan teams under the Shelby banner.
"It was never a matter of if, but when Shelby would make it back to the track," added Amy Boylan, president of Shelby Automobiles. "Thanks to our relationship with Ford, we're evaluating all of our options for a racing program. I look forward to bringing home championships again."
Carroll Shelby, one of America's greatest race car drivers, dominated sports car racing in the mid-1950s. His crowning achievement as a driver came in 1959, when he won the 24 hours of Le Mans. Upon retiring from racing, Shelby forged a relationship with Ford and founded Shelby American to create the Cobra sports car. Today his company, Shelby Automobiles, continues to build the Cobra as a component vehicle in the 289 street car, FIA and 427 S/C models.
About Shelby Automobiles, Inc.
Founded by legend Carroll Shelby, Shelby Automobiles, Inc., manufactures and markets performance vehicles and related products. The company manufactures authentic continuation Cobras, including the 427 S/C, 289 FIA and 289 street car component vehicles. The company partnered with Ford Motor Company to launch the new Shelby GT500, Shelby GT and Shelby GT500KR, which are based on the Mustang. For more information about Shelby Automobiles and to see the build of a 2008 Ford Shelby GT500KR, visit www.shelbyautos.com.
About Ford Motor Company
Ford Motor Company, a global automotive industry leader based in Dearborn, Mich., manufactures or distributes automobiles in 200 markets across six continents. With more than 280,000 employees and more than 100 plants worldwide, the company's core and affiliated automotive brands include Ford, Jaguar, Land Rover, Lincoln, Mercury, Volvo, Aston Martin and Mazda. The company provides financial services through Ford Motor Credit Company. For more information regarding Ford's products, please visit www.fordvehicles.com.
Source: Shelby Automobiles, Inc. and Ford Motor Company
----------------------------------------------
Shelby Automobiles
Inc.
Scott Black
214-520-3430
sblack@tprm-usa.com
"Luck is a matter of preparation meeting opportunity."
My Ihub board link:
#board-5966

 GuessWhichHedgeFund
6 years ago
GuessWhichHedgeFund
6 years ago
 Quik18holes
10 years ago
Quik18holes
10 years ago
 pitadog
17 years ago
pitadog
17 years ago
 dffhogs
18 years ago
dffhogs
18 years ago
 geowen57
18 years ago
geowen57
18 years ago
 Dream
18 years ago
Dream
18 years ago

 Hot Features
