NYBob
3 years ago
NYBob
3 years ago
$nagoya1 Is 2022 The Year For Gold & Silver? If The Central Banks & Private Citizens Keep Buying, It Will Be!
699 views Dec 8, 2021
https://www.youtube.com/watch?v=O137v49P7X8
TM You Lucky; Massive Price Change In Gold And Silver | Andrew Maguire & Danielle DiMartino Gold & Silver Forecast
8,328 viewsDec 10, 2021
https://www.youtube.com/watch?v=MWR3y8rbuSA
$Ep.56 LFTV: Basel III - The Elephant in the Room - Unprecedented Impact
for Gold and Silver
5,311 views Dec 10, 2021
https://www.youtube.com/watch?v=Y0l7dNC5lq8
C19 Note; Dollar has Stage 4 Cancer – Rob Kirby
By Greg Hunter On December 7, 2021 In Market Analysis No Comments
https://usawatchdog.com/dollar-has-stage-4-cancer-rob-kirby/
Bitcoin CRASH tied to Evergrande DEFAULT
17770 views
https://www.brighteon.com/8333fcd0-ce14-4cca-9272-088574c30545
$Davos Is Making The Central Bank Case For Gold
BY TYLER DURDEN - MONDAY, DEC 06, 2021 - 06:30 AM
Authored by Tom Luongo via Gold, Goats, 'n
Guns blog,
https://www.zerohedge.com/geopolitical/davos-making-central-bank-case-gold
https://www.youtube.com/watch?v=Y0l7dNC5lq8
$In GOD We Trust - Real Money - AU Safety 6000yrs )
https://www.kitconet.com/images/quotes_7a.gif?1493417496003
http://www.kitconet.com/images/live/au0001wb.gif
https://www.kitco.com/images/live/silver.gif?0.8344882022363285
Gold & Silver is the only REAL Legal Tender -
by The Founding Fathers for your -
Rights, Liberty and Freedom -
http://www.biblebelievers.org.au/monie.htm
https://www.usdebtclock.org/
God Bless
https://investorshub.advfn.com/boards/read_msg.aspx?message_id=166747120
Ps.
opinion appreciated
https://investorshub.advfn.com/boards/read_msg.aspx?message_id=166760568
$Mandalay Resources Corporation Announces Financial Results for the
Third Quarter of 2021 more
https://mandalayresources.com/
https://mandalayresources.com/news/
https://mandalayresources.com/investors/investor-presentations/
$MANDALAY RESOURCES CORPORATION ANNOUNCES FINANCIAL
RESULTS FOR THE SECOND QUARTER OF 2021
TORONTO, ON, August 11, 2021 --
Ex....
$Kirkland Lake Gold beside Mandalay's Mine High Grade -
KL should buy MNDJF which is very oversold & undervalued,
IMO!
Announces New High-Grade, Visible-Gold Bearing
Intersections Down-Plunge of Swan Zone, at Cygnet and at Robbin’s Hill
– Fosterville Mine
August 30, 2021
https://www.kl.gold/news-and-media/press-release-details/2021/Kirkland-Lake-Gold-Announces-New-High-Grade-Visible-Gold-Bearing-Intersections-Down-Plunge-of-Swan-Zone-at-Cygnet-and-at-Robbins-Hill--Fosterville-Mine/default.aspx
$Mandalay Resources Corporation ("Mandalay" or the
"Company") (TSX: MND, OTCQB: MNDJF) is pleased to announce its financial results for the
quarter ended June 30, 2021.
The Company’s condensed and consolidated interim financial results for the quarter ended June
30, 2021, together with its Management’s Discussion and Analysis (“MD&A”) for the
corresponding period, can be accessed under the Company’s profile
on www.sedar.com and on
the Company’s website at
http://www.mandalayresources.com
$All currency references in this press
release are in U.S. dollars except as otherwise indicated.
Second Quarter 2021 Highlights:
• Quarterly revenue of $51.4 million – second highest since Q2 2016;
• Adjusted EBITDA of $23.1 million;
• $12.7 million free cash flow and $26.6 million in net cash flow from operating activities;
• Adjusted net income of $11.5 million ($0.13 or C$0.15 per share);
• Consolidated net income of $4.8 million ($0.05 or C$0.06 per share);
and
• Quarter ending cash balance of $39.1 million.
Dominic Duffy, President and CEO of Mandalay, commented:
“Mandalay Resources is pleased to deliver strong financial results for the second quarter of 2021,
as the Company continues to execute against our operational strategy and is on track to attain
our 2021 production and cost guidance.
During the second quarter, the Company generated $12.7 million in free cash flow and ended the
quarter with a cash balance of $39.1 million. As the Company continues to generate strong free
cash flow, the emerging strength of our balance sheet significantly improves our abilities to fund
near-term growth opportunities. During this quarter, the Company also repaid $3.8 million
towards our Syndicated Facility leaving $51.4 million owing.”
Mr. Duffy continued, “During the quarter the Company generated $51.4 million in consolidated
revenue and $23.1 million in adjusted EBITDA, resulting in an EBITDA margin of 45%, and a year
to date adjusted EBITDA of $49.2 million. Mandalay earned $11.5 million ($0.13 or C$0.15 per
share) in adjusted net income during the second quarter, marking our sixth consecutive quarter
of profitability.”
Mr. Duffy added, “Our consolidated cash and all-in sustaining costs per saleable gold equivalent
ounce during the second quarter of 2021 were $960 and $1,342, respectively, an increase as
compared to the $851 and $1,230 during the same period last year. The main reasons for this
were due to foreign exchange movements, with local currencies strengthening against the U.S.
dollar, a decrease in gold production at Björkdal for the quarter due to lower grade stoping and
increased infill exploration spend at both sites.
https://mandalayresources.com/site/assets/files/3116/mnd_q2_2021_fpr_final.pdf
$Mandalay Resources Corporation Announces Production and
Sales Results for the Second Quarter of 2021 and Change to
Senior Management
TORONTO, ON, July 14, 2021 —
https://mandalayresources.com/site/assets/files/3102/mnd_press_release_q2_2021_production_sales_finalv2_clean.pdf
$Mandalay Resources Corporation ("Mandalay" or the "Company")
(TSX: MND, OTCQB: MNDJF) announced today its production and sales
results for the second
quarter of 2021.
Second Quarter 2021 Production Highlights:
• Solid quarterly production at each site, with further production
improvements expected in
the coming quarters;
• Consolidated saleable gold equivalent production of 28,843 ounces –
fourth consecutive
quarter of increased production; and
• Consolidated 28,115 ounces of gold equivalent sold – second highest
quarterly amount in
three years (since Q2 2018).
Dominic Duffy, President and CEO of Mandalay, commented:
https://mandalayresources.com/site/assets/files/3102/mnd_press_release_q2_2021_production_sales_finalv2_clean.pdf
$Mandalay Resources Extends Main Zone and Confirms the Eastern Extension of Lake Zone at Its Björkdal Operation
Mandalay Resources Corporation
June 29, 2021
https://ca.finance.yahoo.com/news/mandalay-resources-extends-main-zone-110000495.html
https://mandalayresources.com/site/assets/files/3094/2021_06_29_mz_lz_release_final.pdf
$This NR confirms that Costerfield = Fosterville at depth, where gold at
depth is in high grade veins
in quartz with stibnite largely absent.
$Mandalay Resources Corporation Announces Production and
Sales Results for the Second Quarter of 2021 and Change to
Senior Management
TORONTO, ON, July 14, 2021 —
https://mandalayresources.com/site/assets/files/3102/mnd_press_release_q2_2021_production_sales_finalv2_clean.pdf
$Mandalay Resources Corporation ("Mandalay" or the "Company")
(TSX: MND, OTCQB: MNDJF) announced today its production and sales
results for the second
quarter of 2021.
Second Quarter 2021 Production Highlights:
• Solid quarterly production at each site, with further production
improvements expected in
the coming quarters;
This implies that the gold is all free gold recoverable at 90 percent
plus recovery through the gravity circuit.
10,000 square meters times an average of 66.45 g/t over a 1.8 meter
mining width based on 6 holes equates to about 115,000 ounces of free
gold over the Eastern Vein, while....
$Mandalay Resources Extends the Newly Discovered Shepherd Zone and
Provides Update on the Costerfield Mineral System
June 8, 2021
//www.youtube.com/watch?v=7HcWQpojnHY
https://youtu.be/7HcWQpojnHY
https://mandalayresources.com/news/mandalay-resources-extends-the-newly-discovered-shepherd-zone-and-provides-update-on-the-costerfield-mineral-system/
https://mandalayresources.com/news/
Mandalay Resources Extends the Newly Discovered Shepherd Zone and
Provides Update on the Costerfield Mineral System
T.MND | 7 hours ago
Eastern and Western veining horizons are extended in the Shepherd Zone, with numerous high-grade gold intercepts along a 400 metre strike extent
TORONTO, June 08, 2021 (GLOBE NEWSWIRE) -- Mandalay Resources Corporation ("Mandalay" or the "Company") (TSX: MND, OTCQB: MNDJF) is pleased to provide an update on the newly discovered Shepherd Zone at its Costerfield Operation in Victoria, Australia.
The Eastern vein has now been traced over 300 metres (“m”) of strike length and approximately 100 m in vertical extent. The mineralization remains open to the south and at depth (Figure 2).
The Western vein has now been traced over 400 m of strike length and approximately 100 m in vertical extent and remains open to the south and at depth (Figure 4).
$New Drilling Highlights:
Eastern Veining
172.3 g/t gold over true width of 0.27 m in BC213; and
69.5 g/t gold over true width of 1.11 m in BC210 including:
406.0 g/t gold over true width of 0.14 m
Western Veining
33.7 g/t gold over true width of 3.22 m in BC201 including:
127.0 g/t gold over true width of 0.69 m ;
712 . 8 g/t gold over true width of 0.10 m in BC205; and
19.4 g/t gold over true width of 4.84 m in BC210 including:
657.3 g/t gold over true width of 0.13 m
https://mandalayresources.com/news/
So in the coming weeks and months when you see MND going from its current
price to over $10 USD per share,
it will be because big money knows this is another FOSTERVILLE
and they will reprice the stock after the last of
the small retail investors are out.
IMHO the current yoyo trading action is a few market makers
trying to pick off the last of the few remaining loose shares.
by ganndolph1 (174) sth.
https://stockhouse.com/companies/bullboard?symbol=t.mnd&postid=33208812
$Costerfield = Fosterville = BESIDE KIRKLAND LAKE GOLD MINE = WHY KL
SHOULD BUY IT = at depth, where gold at depth is in high grade veins
in quartz with stibnite largely absent.
$The following link shows the Mandalay Resources drilling addressed in
the news release.
//www.youtube.com/watch?v=riDBUuHcT3M
https://youtu.be/riDBUuHcT3M
$This NR confirms that Costerfield = Fosterville at depth, where gold at
depth is in high grade veins
in quartz with stibnite largely absent.
This implies that the gold is all free gold recoverable at 90 percent
plus recovery through the gravity circuit.
10,000 square meters times an average of 66.45 g/t over a 1.8 meter
mining width based on 6 holes equates to about 115,000 ounces of free
gold over the Eastern Vein, while
20,000 square meters times an average of 12.2 g/t over a 1.8 meter
mining width based on 4 holes equates to another 42,000 ounces of free
gold at the Western Vein.
Since these results are based on two drilling platforms confirming these
high grade gold intercepts from two different angles, small wonder why
the company has accelerated its exploration drilling program.
This reminds me of Crocodile Gold, except in the case of
Mandalay Resources, 80 percent of the stock is in the hands of large
institutional firms.
Yet their market makers are still capping this stock at
$2.00 USD per share, and hoping that retail investors would
cough up their shares at that bottom basement price.
$MAJOR PRODUCTION UPLIFT, STABLE OPERATIONS
GROWING PRODUCTION
from 81,568 oz gold equivalent in 2018 to 105-117,000 AuEq oz in 2021
$COSTERFIELD GOLD & ANTIMONY MINE IN AUSTRALIA -
[Suppressed Image]
Significant production growth expected via Youle vein
Deep hole drilling below Youle and Cuffley
Testing shallow targets around old-workings
Target and generative testing focus in 2021
$BJÖRKDAL GOLD MINE, SWEDEN -
[Suppressed Image]
Step change in underground production. Increasing underground production
with higher-grade ore from Aurora zone.
HIGH-POTENTIAL EXPLORATION UPSIDE
CONTINUING REGIONAL EXPLORATION
programs on known targets; seeking repetition of mineralization
BJÖRKDAL
Extensional drilling at aurora
Defining mineralization and assessing the economics of the high-grade skarn deposit
FULLY-FUNDED
Cash position of $34.2M at 2020 year-end affords Mandalay with the
financial flexibility to continue funding its exploration programs and
sets the Company up for future profitability and growth
COSTERFIELD
High-grade Youle vein the major growth catalyst
BJÖRKDAL
Ramping up underground production, focusing on higher-cash margin ore
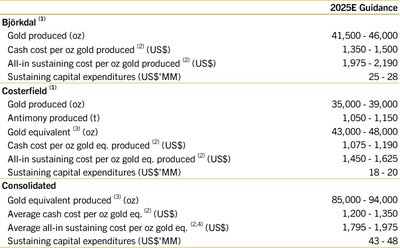
2021 GUIDANCE
LATEST PRESENTATION
Q4 2020 PRODUCTION REPORT
Q4 AND YE2020 FINANCIAL
2020 RESERVES AND RESOURCES
https://mandalayresources.com/investors/why-invest/
https://mandalayresources.com/news/mandalay-resources-corporation-discovers-new-gold-rich-structural-domain-below-the-youle-mine-1/
https://www.mandalayresources.com
NYBob
4 years ago
Mandalay Resources Corporation Intersects 0.11 Metres of 460.5 g/t
Gold and 0.20 Metres of 165.1 g/t Gold in Initial Stepout ...
January 29 2021 - 07:30AM
GlobeNewswire Inc.
Share On Facebook
Mandalay Resources Corporation ("Mandalay" or the "Company") (TSX: MND,
OTCQB: MNDJF) is pleased to provide preliminary details on the initial
intercepts into a newly discovered veining horizon underneath and
related to the Youle deposit at its Costerfield operations (Victoria,
Australia).
Highlights:
460.5 g/t gold over a partially recovered true width of 0.11 m in BC176;
and
165.1 g/t gold over a true width of 0.20 m in BC176W1 wedge hole off
BC176.
Notes:
True width of BC176 is quoted from only recovered core. There is
approximately an additional 40% of veined core that was not recovered.
Further intercept details can be found in Table 1 in the Appendix to this document.
Dominic Duffy, President and Chief Executive Officer of Mandalay, commented, “We are excited by the initial drill hole underneath the Youle deposit as it returned a very significant intersection of high gold grades in both the parent hole and confirmatory wedge hole approximately one metre away. At approximately 90 metres below the last intercept on Youle, this discovery may indicate a new gold mineralized structure below and separate from the high-grade Youle deposit. This is a major milestone for our exploration program so early in the year and reinforces our planned 2021 program of deeper drilling below several of the known deposits.”
The Initial Intercept
Study of the structural dynamics within and surrounding the Youle deposit highlighted the distinct probability of a continuation to auriferous veining within a subvertical geometry underneath the westerly-dipping Youle deposit. BC176 was the initial drill hole within the program to test this target. At approximately 90 metres below the deepest known intercept on Youle and 200 metres below current on vein development, BC176 intercepted a quartz structure with abundant visible gold (Figure 1 and 3). Unfortunately, the intercept was not fully recovered and it is estimated that approximately 40% of the intercept was ground away in the drilling process. 0.58 m (down hole length) of core containing the auriferous quartz vein was recovered assaying 460.5 g/t gold.
Figure 1. Photograph of the BC176 intercept with enlarged image of the gold seen on the edge of the core.
https://www.globenewswire.com/NewsRoom/AttachmentNg/6c26085d-6aba-4324-b007-3b5b68ada343
As the intercept was not fully recovered, a casing wedge was set 20 m above the initial intercept and another capture of the vein was achieved approximately 1 m to the south. This time the vein was fully recovered and a 0.20 m vein was observed. Again, the vein exhibited grains of gold through the quartz alongside blebs of stibnite (Figure 2). This vein was also sampled and assayed at 165.1 g/t gold over a true width of 0.20 m.
Figure 2. Photograph of the BC176W1 intercept which is a twin of the initial poorly recovered BC176 intercept. The figure also shows an image of a gold grain approximately 2 mm in diameter taken under microscope.
https://www.globenewswire.com/NewsRoom/AttachmentNg/6c860088-2d9e-4726-a166-669b3544252e
Measurements from the oriented core show this intercept to be subvertical to east dipping which is a stark contrast to the predominantly westerly dipping Youle vein, however, analogues can be found in the upper portions of Youle and the historic Costerfield mine where subvertical auriferous veining is prevalent. Within BC176 other quartz veining was intercepted including a west-dipping laminated quartz vein and another subvertical vein in the same orientation as the gold bearing vein. To date, gold has not been visually detected in the other veins and the remaining core has not yet been sampled. Structural interpretation and the relationship to Youle proper is also only preliminary at this time.
Drilling is ongoing to test the extent of the visually auriferous, veining and the parallel vein sets. Mandalay will continue to supply updates as more results become available.
Figure 3. Longitudinal section of Youle illustrating the location of the BC176 and BC176W1 intercept. As the intercepts are within 1m of each, one dot portrays both intercepts.
https://www.globenewswire.com/NewsRoom/AttachmentNg/4ee0b9cb-729f-4940-8a7f-27d6cb8548b5
Notes:
True width of BC176 is quoted from only recovered core. There is approximately an additional 40% of veined core that was not recovered.
Drilling and Assaying
All diamond drill core was logged and sampled by Costerfield geologists. All samples were sent to OnSite Laboratory Services in Bendigo, Victoria, Australia, for sample preparation and analysis by fire assay for gold, and Atomic Absorption Spectroscopy (AAS) for antimony. Site geological and metallurgical personnel have implemented a QA/QC procedure that includes systematic submission of standard reference materials and blanks within batches of drill and face samples submitted for assay. Costerfield specific reference materials produced from Costerfield ore have been prepared and certified by Geostats Pty Ltd., a specialist laboratory quality control consultancy. See Technical Report entitled “Costerfield Operation, Victoria, Australia NI 43-101 Report” dated March 30, 2020, available on SEDAR (www.sedar.com) for a complete description of drilling, sampling, and assaying procedures.
Qualified Person:
Chris Davis, Vice President of Operational Geology and Exploration at Mandalay Resources, is a Chartered Professional of the Australasian Institute of Mining and Metallurgy (MAusIMM CP(Geo)), and a Qualified Person as defined by NI 43-101. He has reviewed and approved the technical and scientific information provided in this release.
For Further Information
Dominic Duffy
President and Chief Executive Officer
Edison Nguyen
Manager, Analytics and Investor Relations
Contact:
647.260.1566
About Mandalay Resources Corporation
Mandalay Resources is a Canadian-based natural resource company with producing assets in Australia and Sweden, and care and maintenance and development projects in Chile. The Company is focused on growing production at its gold and antimony operation in Australia, and gold production from its operation in Sweden to generate near term cash flow.
Forward-Looking Statements:
This news release contains "forward-looking statements" within the meaning of applicable securities laws, including statements regarding the exploration and development potential of the Youle deposit (Costerfield). Readers are cautioned not to place undue reliance on forward-looking statements. Actual results and developments may differ materially from those contemplated by these statements depending on, among other things, changes in commodity prices and general market and economic conditions. The factors identified above are not intended to represent a complete list of the factors that could affect Mandalay. A description of additional risks that could result in actual results and developments differing from those contemplated by forward-looking statements in this news release can be found under the heading “Risk Factors” in Mandalay’s annual information form dated March 30, 2020, a copy of which is available under Mandalay’s profile at www.sedar.com. In addition, there can be no assurance that any inferred resources that are discovered as a result of additional drilling will ever be upgraded to proven or probable reserves. Although Mandalay has attempted to identify important factors that could cause actual actions, events or results to differ materially from those described in forward-looking statements, there may be other factors that cause actions, events or results not to be as anticipated, estimated or intended. There can be no assurance that forward-looking statements will prove to be accurate, as actual results and future events could differ materially from those anticipated in such statements. Accordingly, readers should not place undue reliance on forward-looking statements.
Appendix
Table 1. Youle Extensional Drilling Composites
Drill Hole
ID From
(m) To
(m) Drill
Width (m) True
Width (m) Au Grade
(g/t) Sb Grade
(%) AuEq
(g/t) AuEq (g/t) over
min. 1.8m
mining width
BC176 194.67 195.25 0.58 0.11 460.5 0.1 460.6 28.1
BC076W1 194.96 195.32 0.36 0.20 165.1 0.0 165.1 18.3
Notes:
1. The AuEq (gold equivalent) grade is calculated using the following formula:
AuEq g per t = Au g per t + Sb% ×
Au price per g × Au processing recovery
Sb price per 10kg×Sb processing recovery
Figures used are based on a 9-month average from April through December of 2020: Au $/oz = 1,834 Sb $/t = 5,672 Au Recovery = 91.2% and Sb Recovery = 96.6%
2. True width of BC176 is quoted from only recovered core. There is approximately an additional 40% of veined core that was not recovered.
Primary Logo
Mandalay Resources (TSX:MND)
Historical Stock Chart
From Jan 2021 to Feb 2021 Click Here for more Mandalay Resources Charts. Mandalay Resources (TSX:MND)
Historical Stock Chart
From Feb 2020 to Feb 2021 Click Here for more Mandalay Resources Charts.
Mandalay Resources (TSX:MND)
Intraday Stock Chart
Monday 1 February 2021 Click Here for more Mandalay Resources Charts.
Bjorkdal Gold Mine, Sweden
Costerfield gold and antimony mine in Australia
NYBob
5 years ago
Mandalay Resources Corporation Announces Execution of Definitive Agreement for the Sale of the Challacollo Silver-Gold Project in Chile
T.MND | November 12, 2019
TORONTO, Nov. 12, 2019 (GLOBE NEWSWIRE) --
Mandalay Resources Corporation ("Mandalay" or the "Company") (TSX: MND, OTCQB: MNDJF) is pleased to announce that it has entered into a definitive agreement with Aftermath Silver Ltd. (“Aftermath”) (TSX-V:AAG.H) in respect of the previously announced transaction in which Aftermath will acquire Minera Mandalay Challacollo Limitada (“MMC”), which currently owns the Challacollo silver-gold project located in Region I (Tarapaca) of Chile (the “Challacollo Project”).
Pursuant to the terms of the transaction, Aftermath will purchase 100% of MMC in exchange for total consideration of up to CAD$10,000,000, consisting of CAD$7,000,000 in non-contingent consideration (the “Non-Contingent Consideration”) plus a 3% net smelter returns royalty on production at the Challacollo Project, capped at CAD$3,000,000.
The Non-Contingent Consideration is payable as follows:
CAD$1,000,000 in cash payable on or before November 19, 2019;
CAD$1,000,000 in cash payable on or before December 30, 2020; and
CAD$5,000,000 (the “Final Payment”) payable on or before April 21, 2021.
The Final Payment will be payable, at Aftermath’s option, in cash or common shares of Aftermath (“Aftermath Shares”). In addition, Aftermath may elect to defer payment of 50% of the Final Payment by one year by increasing the amount of the Final Payment by CAD$500,000 (such that the Final Payment would consist of CAD$2,500,000 payable on or before April 21, 2021 and CAD$3,000,000 payable on or before April 21, 2022).
In connection with the transaction, Aftermath will also assume Mandalay’s existing contingent payment and royalty obligations to SSR Mining with respect to the Challacollo Project under the terms of Mandalay’s acquisition of the Challacollo Project from SSR Mining in December 2013.
Final completion of the transaction (at which time the transfer of ownership of MMC will occur) is subject to the satisfaction of certain conditions, including Mandalay’s receipt of all of the Non-Contingent Consideration. Pending final completion, Aftermath will have the right to conduct certain exploration and drilling activities on the Challacollo Project. Aftermath will be conducting an exploration campaign on existing permitted drill pads as soon as possible.
Dominic Duffy, President and Chief Executive Officer of Mandalay, commented, ”We are pleased to see the Aftermath transaction executed and the restart of an exploration campaign on the concession. This transaction continues Mandalay’s objective of creating value from its non-operating assets, with the previously announced transactions at Cerro Bayo and the sale of non-core concessions at Challacollo to a third party, also completed in the last quarter. Mandalay is now well positioned to focus on improving operations at Björkdal and Costerfield with these projects in Chile resolved.”
For Further Information:
Dominic Duffy
President and Chief Executive Officer
Edison Nguyen
Manager, Analytics and Investor Relations
Contact:
647.260.1566
About Mandalay Resources Corporation:
Mandalay Resources is a Canadian-based natural resource company with producing assets in Australia and Sweden, and care and maintenance and development projects in Chile. The Company is focused on growing production at its gold and antimony operation in Australia, and gold production from its operation in Sweden to generate near-term cash flow.
About Aftermath Silver Ltd:
Aftermath Silver Ltd. is a Canadian junior exploration company engaged in acquiring, exploring, and developing mineral properties with an emphasis on silver in Chile. The Company is focused on growth through the discovery and acquisition of quality projects in stable jurisdictions. Aftermath continues to seek new opportunities to take advantage of the relatively low silver price.
Forward-Looking Statements:
This news release contains "forward-looking statements" within the meaning of applicable securities laws, including statements regarding the proposed sale of MMC to Aftermath Silver. There is no assurance that the proposed transaction will be completed on the terms set out in this press release or at all. Actual results and developments may differ materially from those contemplated by these statements depending on, among other things, changes in commodity prices and general market and economic conditions. The factors identified above are not intended to represent a complete list of the factors that could affect Mandalay. A description of additional risks that could result in actual results and developments differing from those contemplated by forward-looking statements in this news release can be found under the heading “Risk Factors” in Mandalay’s annual information form dated March 28, 2019, a copy of which is available under Mandalay’s profile at www.sedar.com. In addition, there can be no assurance that any inferred resources that are discovered as a result of additional drilling will ever be upgraded to proven or probable reserves. Although Mandalay has attempted to identify important factors that could cause actual actions, events or results to differ materially from those described in forward-looking statements, there may be other factors that cause actions, events or results not to be as anticipated, estimated or intended. There can be no assurance that forward-looking statements will prove to be accurate, as actual results and future events could differ materially from those anticipated in such statements. Accordingly, readers should not place undue reliance on forward-looking statements.
image: https://www.globenewswire.com/newsroom/ti?nf=Nzc1NjQ5MCMzMjE3NzE3IzIwMjg0ODA=
image: https://ml.globenewswire.com/media/b5f2fa1c-f64d-4f0c-a9c7-ff4d73fc1ef0/small/mandalay-resources-logo.jpg
Primary Logo
GlobeNewswire
November 12, 2019 - 5:44 AM PST
Tags:
INDUSTRIAL METALS & MINERALS
1
Read more at https://stockhouse.com/news/press-releases/2019/11/12/mandalay-resources-corporation-announces-execution-of-definitive-agreement-for#hQtaLvhsfht0wEbW.99
NYBob
5 years ago
Mandalay Resources Corporation Announces Production and Sales Results for the Third Quarter of 2019 and Revised Full-Year 2019 Guidance
T.MND |
TORONTO, Oct. 17, 2019 (GLOBE NEWSWIRE) --
Mandalay Resources Corporation ("Mandalay" or the "Company") (TSX: MND, OTCQB: MNDJF) announced today its production and sales results for the third quarter of 2019.
In the third quarter of 2019, Mandalay produced 16,625 saleable ounces of gold equivalent and sold 17,814 ounces of gold equivalent.
Dominic Duffy, President and Chief Executive Officer of Mandalay, commented, “Mandalay’s production was lower than forecast over the third quarter of this year as a result of Costerfield’s underperformance in the Brunswick lode, whilst Björkdal continued its dependable performance of 11,888 ounces of saleable gold produced.”
Mr. Duffy continued, “At Björkdal, production continued in line with expectations, while mining at the open pit was paused at the end of July. We anticipate an increase in production in the fourth quarter as we recommence the mining of a higher-grade skarn zone, after infill drilling was carried out during the third quarter. In addition, we plan to increase the production rate from the Aurora zone as more levels are developed. We remain on target to achieve full-year guidance at Björkdal.”
Mr. Duffy continued, “At Costerfield, we produced 3,103 ounces of saleable gold and 402 tonnes of saleable antimony, as persisting poor ground conditions in the Brunswick lode limited the production rate and lowered the grade due to significant dilution from overbreak. The metallurgy of the ore has also been problematic with significantly lower than planned gold recoveries for the quarter, although antimony recoveries were as planned. With Youle production gradually coming online in the fourth quarter, we anticipate an increase in production compared to the third quarter as there will be less Brunswick ore through the mill. Furthermore, an initial test of approximately 1,600 tonnes of Youle development ore was processed through the mill with early indications showing comparable, if not better than, recoveries seen in the previously mined Cuffley lode.”
Mr. Duffy continued, “Despite the positive developments we expect at both sites during the fourth quarter and beyond, the aforementioned production and recovery issues related to the Brunswick deposit will require an update to our 2019 production and unit costs. We have not increased our total operational cost at both sites, although due to the significant drop in production forecast from Costerfield, expected cash costs and all-in costs at the Costerfield mine, and therefore on a consolidated basis, have been increased. Separately, due to lower than expected capital spend for the year, the upper limit of capital guidance at both operating sites have been lowered by US$2 million. Details are shown further below in this press release.”
Mr. Duffy continued, “The poor gold recoveries and lower grades due to dilution in the Brunswick lode are expected to continue to impact Costerfield’s production for the first six months of 2020. However, as the Youle lode ramps up this becomes less relevant and from the third quarter of 2020, it is anticipated that the Youle lode will be the sole feed source for the Costerfield mine.”
Mr. Duffy concluded, “Mandalay fully anticipates Costerfield to be revitalized with the ramp up at Youle which we expect to generate positive momentum into 2020. At Björkdal, the Company intends to build on its third quarter production and focus on targeting higher-grade underground skarn material and ramping up Aurora production for increased overall gold production.”
Saleable production for the quarter ended September 30, 2019:
In the third quarter of 2019, the Company produced a total of 14,983 ounces of gold and 402 tonnes of antimony, representing a total of 16,625 ounces of gold equivalent, versus 13,442 ounces of gold and 505 tonnes of antimony in the third quarter of 2018, representing a total of 16,874 ounces of gold equivalent.
Production at Björkdal was 11,880 ounces of gold in the third quarter of 2019, as compared to 8,504 ounces of gold in the third quarter of 2018.
Production at Costerfield was 3,103 ounces of gold and 402 tonnes of antimony in the third quarter of 2019, versus 4,938 ounces gold and 505 tonnes antimony in the third quarter of 2018.
Saleable production for the nine months ended September 30, 2019:
The Company produced a total of 51,017 ounces gold and 1,348 tonnes antimony, representing a total of 58,065 ounces of gold equivalent production, versus 51,899 ounces gold and 1,613 tonnes of antimony in the corresponding nine months of 2018, representing a total of 62,395 ounces of gold equivalent.
Production at Björkdal was 40,508 ounces gold.
Production at Costerfield was 10,509 ounces gold and 1,348 tonnes antimony.
Table 1 – Third Quarter and Nine Month Saleable Production for 2019 and 2018
Metal Source Three months
ended
September 30
2019 Three months
ended
September 30
2018 Nine months
ended
September 30
2019 Nine months
ended
September 30
2018
Gold (oz) Björkdal 11,880 8,504 40,508 35,237
Costerfield 3,103 4,938 10,509 16,662
Total 14,983 13,442 51,017 51,899
Antimony (t) Costerfield 402 505 1,348 1,613
Average quarterly prices:
Gold US$/oz 1,473 1,213
Antimony US$/t 6,015 8,252
Au Eq.(1) (oz) Björkdal 11,880 8,504 40,508 35,237
Costerfield 4,745 8,370 17,557 27,158
Total 16,625 16,874 58,065 62,395
Quarterly gold equivalent ounces (“Au Eq. oz”) produced is calculated by multiplying the saleable quantities of gold (“Au”), and antimony (“Sb”) in the period by the respective average market prices of the commodities in the period, adding the two amounts to get a “total contained value based on market price”, and then dividing that total contained value by the average market price of Au in the period. Average Au price in the period is calculated as the average of the daily LME PM fixes in the period, with price on weekend days and holidays taken of the last business day; average Sb price in the period is calculated as the average of the daily average of the high and low Rotterdam warehouse prices for all days in the period, with price on weekend days and holidays taken from the last business day. The source for all prices is www.metalbulletin.com.
Sales for the third quarter ended September 30, 2019:
In the third quarter of 2019, the Company sold a total of 16,132 ounces of gold and 412 tonnes of antimony, representing a total of 17,814 ounces of gold equivalent, versus 15,144 ounces of gold and 486 tonnes of antimony in the third quarter of 2018, representing a total of 18,450 ounces of gold equivalent.
Björkdal sold 13,006 ounces of gold in the third quarter of 2019, versus 10,400 ounces of gold in the third quarter of 2018.
Costerfield sold 3,126 ounces of gold and 412 tonnes of antimony in the third quarter of 2019, versus 4,744 ounces of gold and 486 tonnes of antimony in the third quarter of 2018.
Sales for the nine months ended September 30, 2019:
The Company sold 53,750 ounces gold and 1,361 tonnes antimony, representing a total of 60,815 ounces of gold equivalent, versus 58,448 ounces gold and 1,725 tonnes antimony in the third quarter of 2018, representing a total of 69,650 ounces of gold equivalent.
Björkdal sold 43,160 ounces gold.
Costerfield sold 10,590 ounces gold and 1,361 tonnes antimony.
Table 2 – Third Quarter and Nine Month Sales for 2019 and 2018
Metal Source Three months
ended
September 30
2019 Three months
ended
September 30
2018 Nine months
ended
September 30
2019 Nine months
ended
September 30
2018
Gold (oz) Björkdal 13,006 10,400 43,160 40,505
Costerfield 3,126 4,744 10,590 17,943
Total 16,132 15,144 53,750 58,448
Antimony (t) Costerfield 412 486 1,361 1,725
Average quarterly prices:
Gold US$/oz 1,473 1,213
Antimony US$/t 6,015 8,252
Au Eq. (1) (oz) Björkdal 13,006 10,400 43,160 40,505
Costerfield 4,808 8,050 17,655 29,145
Total 17,814 18,450 60,815 69,650
Quarterly Au Eq. oz sold is calculated by multiplying the saleable quantities of Au, and Sb in the period by the respective average market prices of the commodities in the period, adding the two amounts to get a “total contained value based on market price”, and then dividing that total contained value by the average market price of Au for the period. The source for all prices is www.metalbulletin.com with price on weekend days and holidays taken of the last business day.
Mandalay’s updated guidance for 2019 production, cash costs, all-in costs and capital expenditures is set out below together with the original guidance amounts. In addition to the factors noted above, the revised guidance reflects updated metal prices as there has been a significant decline in the price of antimony, and a significant increase in the price of gold since the initial announcement of the original guidance on January 16, 2019. These changes negatively impact projected consolidated gold equivalent production relative to the original guidance. As a result, the tables below present (i) revised 2019 guidance reflecting assumed metal prices of Au$1,396/oz and Sb$6,682/t, (ii) 2019 guidance as originally presented (based on the metal prices of Au$1,200/oz and Sb$8,200/t), and (iii) the original 2019 guidance adjusted to reflect assumed metal prices of Au$1,396/oz and Sb$6,682/t.
Table 3 – Revised 2019 Full-Year Guidance
2019E
Björkdal
Gold produced (oz) 50,000 – 56,000
Cash cost(1) per oz gold produced $800 – $950
All-in cost(1) per oz gold produced $1,030 – $1,180
Capital expenditures $18M – $20M
Costerfield
Gold produced (oz) 13,000 – 17,000
Antimony produced (t) 2,000 – 2,300
Gold equivalent(2) (oz) 23,000 – 28,000
Cash cost(1) per oz gold eq. produced $1,300 – $1,450
All-in cost(1) per oz gold eq. produced $1,700 – $1,850
Capital expenditures $21M – $23M
Consolidated
Gold equivalent(2) produced (oz) 72,000 – 84,000
Average cash cost(3) per oz gold eq. $975 – $1,125
Average all-in cost(3) per oz gold eq. $1,325 – $1,500
Capital expenditures $39M – $43M
Cash cost and all-in cost are non-IFRS measures. See “Non-IFRS Measures” at the end of this press release.
Assumes metal prices of: Au $1,396/oz, Sb $6,682/t
Consolidated costs per Au Eq. oz includes corporate overhead spending and total care and maintenance costs at Cerro Bayo.
Table 4 – Original 2019 Full-Year Guidance
2019E
Björkdal
Gold produced (oz) 50,000 – 56,000
Cash cost(1) per oz gold produced $800 – $950
All-in cost(1) per oz gold produced $1,030 – $1,180
Capital expenditures $18M – $22M
Costerfield
Gold produced (oz) 23,000 – 30,000
Antimony produced (t) 2,600 – 3,100
Gold equivalent produced(2) (oz) – revised prices 35,000 – 45,000
Gold equivalent produced(3) (oz) 41,000 – 51,000
Cash cost(1,3) per oz gold eq. produced $790 – $920
All-in cost(1,3) per oz gold eq. produced $1,050 – $1,180
Capital expenditures $21M – $25M
Consolidated
Gold equivalent produced(2) (oz) – revised prices 85,000 – 101,000
Gold equivalent produced(3) (oz) 91,000 – 107,000
Average cash cost(3,4) per oz gold eq. $850 – $980
Average all-in cost(3,4) per oz gold eq. $1,130 – $1,280
Capital expenditures $39M – $47M
Cash cost and all-in cost are non-IFRS measures. See “Non-IFRS Measures” at the end of this press release.
Assumes metal prices of: Au $1,396/oz, Sb $6,682/t
Original metal prices used in the January 16, 2019 press release were Au $1,200/oz, Sb $8,200/t
Consolidated costs per Au Eq. oz includes corporate overhead spending and total care and maintenance costs at Cerro Bayo
For Further Information:
Dominic Duffy
President and Chief Executive Officer
Edison Nguyen
Manager, Analytics and Investor Relations
Contact:
647.260.1566
About Mandalay Resources Corporation:
Mandalay Resources is a Canadian-based natural resource company with producing assets in Australia and Sweden, and care and maintenance and development projects in Chile. The Company is focused on growing production at its gold and antimony operation in Australia, and gold production from its operation in Sweden to generate near-term cash flow.
Forward-Looking Statements:
This news release contains "forward-looking statements" within the meaning of applicable securities laws, including statements regarding the Company’s production of gold and antimony for the 2019 fiscal year. Readers are cautioned not to place undue reliance on forward-looking statements. Actual results and developments may differ materially from those contemplated by these statements depending on, among other things, changes in commodity prices and general market and economic conditions. The factors identified above are not intended to represent a complete list of the factors that could affect Mandalay. A description of additional risks that could result in actual results and developments differing from those contemplated by forward-looking statements in this news release can be found under the heading “Risk Factors” in Mandalay’s annual information form dated March 28, 2019, a copy of which is available under Mandalay’s profile at www.sedar.com. In addition, there can be no assurance that any inferred resources that are discovered as a result of additional drilling will ever be upgraded to proven or probable reserves. Although Mandalay has attempted to identify important factors that could cause actual actions, events or results to differ materially from those described in forward-looking statements, there may be other factors that cause actions, events or results not to be as anticipated, estimated or intended. There can be no assurance that forward-looking statements will prove to be accurate, as actual results and future events could differ materially from those anticipated in such statements. Accordingly, readers should not place undue reliance on forward-looking statements.
image: https://www.globenewswire.com/newsroom/ti?nf=Nzc0MzE0MCMzMTgzMzM2IzIwMjg0ODA=
image: https://ml.globenewswire.com/media/b5f2fa1c-f64d-4f0c-a9c7-ff4d73fc1ef0/small/mandalay-resources-logo.jpg
Primary Logo
GlobeNewswire
October 17, 2019 - 3:17 PM PDT
Tags: INDUSTRIAL METALS & MINERALS
Read more at https://stockhouse.com/news/press-releases/2019/10/17/mandalay-resources-corporation-announces-production-and-sales-results-for-the#hOtTTj5BgbK8t00L.99
https://www.mandalayresources.com/wp-content/uploads/2019/10/MND_Press_Release_Q3_2019_Production_Sales_FINAL.pdf
In GOD We Trust -
https://www.kitco.com/images/live/silver.gif?0.8344882022363285
http://www.kitconet.com/images/live/au0001wb.gif
Gold & Silver is the only REAL Legal Tender -
by The Founding Fathers for your -
Rights, Liberty and Freedom -
http://www.biblebelievers.org.au/monie.htm
God Bless America
Ps.
opinion appreciated
TIA
NYBob
5 years ago
Mandalay Resources Corporation Provides Exploration Update
T.MND
TORONTO, Sept. 30, 2019 (GLOBE NEWSWIRE) --
Mandalay Resources Corporation ("Mandalay" or the "Company") (TSX: MND, OTCQB: MNDJF) is pleased to present an update on the continuing exploration programs at its Costerfield operation in Victoria, Australia, as well as its Björkdal operation in Sweden.
The Company is also pleased to report additional diamond drilling results from both operations based on drilling that was carried out since the Company’s last exploration release on June 18, 2019.
Readers are advised to review the corresponding figures found at the end of this press release.
Exploration Update Highlights
Costerfield
Youle northern extensional drilling met with early success
Potential for further discovery at Costerfield with target test drilling from surface at MacDonald
First hole of Costerfield deep drilling completed at 1,700 metres (“m”). Program has advanced knowledge of the structural framework of the Costerfield mineral district. Commenced a shallower daughter hole allowing for exploration target testing
Björkdal
Aurora zone open to extension. Assay results continue to grow the potential resource
Drill results at newly discovered Lake Zone skarn deposit demonstrated that the skarn geology is continuing deeper.
Mandalay’s drilling programs have continued to yield encouraging results at both Costerfield and Björkdal operations. At Costerfield, the Company is testing extensions to the Youle orebody, (see table 1) and has completed the first hole of a deep drilling program under the known Costerfield mineralized system, in search of high-grade mineralization at depth. At Björkdal, the Company is testing up-dip and down-dip extensions to the Aurora mineralization and is also testing the down-dip extension of the newly discovered high-grade skarn at Lake zone (see tables 2, 3, 4, and 5).
Dominic Duffy, President and CEO of Mandalay, commented; “Recent drilling results at Costerfield and Björkdal continue to demonstrate the significant upside value potential of our operations.”
“At Costerfield, further testing of the northern extension of the high-grade Youle deposit is strengthening our confidence of grade continuity within the Inferred Resources. Additionally, drilling further north of the Youle line of lode resulted in the identification of continuous mineralization through a low-grade zone, along with indications of a higher-grade zone of antimony and gold concentration approximately 200 metres away from the existing Youle Inferred Resources at a target known as MacDonald.”
Mr. Duffy continued, “We are now well underway with phase 1 of our deep drilling program at Costerfield. The first deep hole was completed at a depth of 1,700 metres and has provided valuable structural information below the Costerfield and Youle deposits. One high potential target has already been generated further up-dip as a result of this first hole. A daughter hole will now be wedged off the parent hole to test this target. Multi-element geochemical assaying of core drilled through potential fluid conduits is currently underway, with geochemical vectoring techniques to be applied once the analysis is complete.”
Mr. Duffy concluded, “At Björkdal, drilling at the Aurora zone was not able to commence until May 2019. However, results demonstrated that Aurora is still open both vertically and along strike. Lastly, we commenced testing the down-dip extension of the newly discovered Lake Zone skarn deposit. Results to date, show that the skarn geology continues deeper, but further assay results are required before assessing to what depth this deposit economically extends.”
Mandalay Drilling Programs
Costerfield Drilling Programs
Mandalay continues its two exploration programs commenced in May 2019.
Youle Extension Drilling Program
The focus of the Youle extension program has been to delineate a complex high-grade zone to the north, expanding on the early success of the program reported in June 2019.
With the use of regional modelling, historic research, and structural information gained from the second quarter of 2019 drilling program, an additional package of gold and antimony concentration was interpreted to exist as a target north of a low-grade zone along the structural trend of Youle and the Main Costerfield mine. As a result, the Youle extension drilling was re-designed to prioritize drill testing of this zone and has met with initial success (refer to Drilling Results, Figure 1 and Table 1 for details).
This “shoot repetition” has now been observed multiple times through the district, most notably in the Cuffley, Brunswick and Augusta Deposits.
Costerfield Deep Drilling Program
As Mandalay continues to increase momentum within the Youle expansion program, it also advances deep targeted testing of the Costerfield line of lode following Mandalay’s developing understanding of gold enrichment environments. The first hole of this two-hole program with secondary wedge holes, has been completed at a depth of 1,700 m. This first hole was designed to investigate the deep environment at the northern end of the current mine area, below the historical Costerfield mine and the currently active Youle lode.
Björkdal Drilling Programs
Underground extensional and production drilling during 2019 has continued to focus on the high-grade mineralization recently discovered at Björkdal (i.e., Aurora Zone and Lake Zone skarn).
Both these horizons provide the Company with the potential to mine high-tonnage and higher-grade ore more cost effectively over the upcoming years.
Aurora Drilling Program
Underground drilling focused on extending the existing Aurora zone. Results to date confirm the potential for Aurora to be extended both up and down dip and along strike in both directions. Although drilling the upper section of Aurora has encountered problems due to the difficult nature of drilling positive gradient diamond drill holes, with several holes having to be abandoned when intercepting major faults before intercepting the Aurora zone. As a result, the focus of Aurora drilling has been changed to the deeper holes seeking to extend the higher-grade mineralization at depth. The upper holes will now be drilled from surface in later 2019 or early 2020. The zone is currently being mined on five active levels.
Lake Zone Skarn Program
The recognition of skarn related mineralization at Björkdal during 2018 is of interest due to its anomalously high grade. Seven diamond drill holes have recently been drilled with the aim to define the down dip extension of the mineralized body. These drill holes have demonstrated the continuation of the skarnified horizon further to the north and at depth.
Mandalay Drilling Results
Costerfield Drilling Results
Youle Extension Drilling Program
Drill hole BC071 has been completed, targeting the multiple veins that make up the northern high-grade area of Youle. This hole intercepted multiple parallel veins, with the most significant being 18.4 g/t gold (“Au”) and 5.7% antimony (“Sb”) over a true width of 0.24 m.
Other recent drilling within the program focused on testing for a northern continuation of mineralization. The structure that hosts the majority of Youle mineralization was intercepted in BC067AW1, BC067AW2 and BC070 with the structure being enriched in gold and antimony in all 3 intercepts.
Historic research, together with field mapping and LiDAR (light imaging, detection, and ranging) analysis has identified substantial workings along the line of the historic Costerfield mine to the north. From our understanding of the other mineralized packages in the district, a steeply plunging low-grade zone occurring between these workings and the Costerfield mine is likely, and fits with observations and inferences of bedding and faulting interactions to the north of Youle and Costerfield. From these findings a highly prospective zone now exists north of Costerfield mine, being the MacDonald target.
BC075 intercepted two mineralized zones. A gold and antimony bearing laminated quartz vein (0.42 m @ 7.2 g/t Au & 4.4% Sb), which is spatially associated with the historic workings, and additional quartz-stibnite veining (0.45 m @ 1.3 g/t Au & 7.3% Sb composite of multiple veins) approximately 80 m to the east of the initial intercept. These results support the northern enrichment model and excitingly indicate a potential for multiple veining and mining fronts.
Table 1: Youle Drilling Results (June 2019 – September 2019)
Hole ID Hole Completion Date Total hole Depth Intercept Easting (Mine Grid) Intercept Northing (Mine Grid) Intercept Elevation (Mine Grid) Drilled Width (m) True Width (m) Au Grade (g/t) Sb Grade (%) AuEq (g/t) over min. 1.8m
mining width
BC067AW1 4/07/2019 531.2 15441 7251 817 0.09 0.07 8.7 19.8 1.4
BC067AW2 17/07/2019 518.9 15406 7235 799 0.08 0.07 5.3 8.6 0.7
BC069 27/06/2019 699.6 No Significant Intercept
BC070 9/08/2019 734.8 15442 7350 747 0.31 0.22 0.8 0.5 0.2
BC071 5/08/2019 492.1 15392 7156 849 0.55 0.26 18.4 5.7 3.9
BC071 5/08/2019 492.1 15389 7156 854 0.28 0.20 2.1 3.4 0.8
BC075 10/09/2019 357.5 15521 7439 1122 0.51 0.42 7.2 4.4 3.2
BC075 10/09/2019 357.5 15608 7356 1048 0.52 0.45 1.3 7.3 3.1
Note:
- Assumes metal prices of: Au$1,450/ oz and Sb$7,000/ t
- AuEq (g/t) = Au (g) + Sb (%) x [Price per 10 Sb (kg) x Sb Recovery (%) / Price per 1 Au (g) x Au Recovery (%)]
Costerfield Deep Drilling Program
The upper majority of the first hole in this program (CD001) found a geological environment consistent with our current understanding; a west-dipping sequence of Upper Costerfield Formation siltstones passing into the turbidites and mudstones of the Lower Costerfield Formation. As anticipated by the geological model, a sequence of dark, carbon-rich turbidites and sandstones inferred to be favorable to high-grade gold mineralization was passed through between 904 – 995 m, which included quartz veining with anomalous gold values (up to 0.7 g/t Au) and minor visible stibnite mineralization (up to 0.01% Sb).
At a downhole depth of 1,015 m, a west-dipping fault containing laminated quartz with significant apparent thrust offset was intercepted (Figure 2). Below this fault, folded but predominantly east-dipping turbidites, giving way to siltstones disrupted by apparent strike-slip faulting was encountered. A large fault between 1,545 and 1,555 m marked a transition into dark-coloured, east-dipping slaty turbidites which displayed abundant irregular quartz veining leading up to a thick quartz blow between 1,583 – 1,595 m. This wide interval of quartz contained minor pyrite mineralization and zones of sericite-chlorite alteration.
Stratigraphic correlations between the Youle mine area, and the first 1,000 m of CD001 infer the existence of an anticlinal environment or thrust ramp in the area between, which presents a compelling target for Costerfield-style mineralization down-dip of the known Youle lode. This environment is additionally, likely to be coincident with the occurrence of the dark carbon-rich sandstones which enhance the potential for high-grade gold mineralization.
Trace-level analysis assays have been returned for the core down to a depth of 1,040 m, which display strong positive correlation between gold, antimony and arsenic (Figure 3). Of importance is a wide zone of enrichment of these elements, approximately between 975 – 1,040 m downhole, which appears to be centered on the large fault at 1,015 m. Additionally, silver (“Ag”) shows a strong relative enrichment in this zone on the footwall of the fault. Subsequent hyperspectral logging of CD001 has additionally brought to light a wide envelope of muscovite alteration surrounding this fault, mirroring the elevated assays. Muscovite alteration of wall rock white micas is a common feature of central Victorian gold deposits, and the coincidence of muscovite alteration and gold-antimony-arsenic enrichment here is interpreted as evidence of the large fault acting as an active conduit or feeder zone for ore-forming hydrothermal fluids. Assays from CD001 have been added to Mandalay’s regional multi-element geochemical database, which integrates exploration drill core, regolith and bedrock assays to fingerprint mineralized systems and lithological packages in the Costerfield area. The information contained within the database is constantly updated and used to refine exploration models which assist in the generation and testing of new mineralization targets.
The environment passed through in the latter 660 m of CD001 can be interpreted as the disrupted eastern limb of a regional-scale anticline, the thrust-offset crest of which hosts the Costerfield mine. This deep, capped-off eastern limb is in a similar structural position to the sub King Cobra mineralization at Augusta which contains some exceptionally high-grade gold assays. The steeply dipping fault at 1,545 m is interpreted to be analogous to the Lyre Fault which appears to be significant to setting up the sub King Cobra mineralized environment. Initial assays through this zone show anomalous gold and antimony however the method of analysis used, is designed for ore grade analysis and is not accurate at trace ranges.
The next hole in this program, CD001W1, has commenced wedging off CD001 at a depth of 400 m to investigate the carbonaceous sandstones near to their inferred culmination above the 1,015 m fault, and the environment immediately below (See Figure 2).
Björkdal Drilling Results
Since the Company’s last exploration press release on June 18, 2019, the Company has assayed 20 drill holes at the Aurora zone at Björkdal (see tables 4) and 4 drill holes at its Lake Zone skarn deposit (see table 5). Recent highlights from the Aurora and Lake Zone skarn assays include the following intercepts:
Table 2: Aurora Drilling Highlights
Hole ID True Width Au g/t
DOD2019-058 2.93 7.80
DOD2019-076 3.34 5.37
DOD2019-077 2.51 7.24
DOD2019-078 6.03 2.78
DOD2019-079 3.50 6.99
Table 3: Lake Zone Skarn Drilling Highlights
Hole ID True Width Au g/t
MU9-009A 0.65 23.77
MU9-014 1.65 14.31
Table 4: Aurora Drilling Results (June 2019 – September 2019)
Hole ID Hole Completion Date Intercept
Northing
(Mine Grid) Intercept
Easting
(Mine Grid) Intercept
Elevation
(Mine Grid) From (m) To
(m) Drilled
Width
(m) True Width (m) Au (g/t) Au (g/t) over min. 3 m mining width
DOD2019-052 06/07/2019 1755.778 1126.208 -402.341 120.2 125 4.8 4.45 0.74 0.74
DOD2019-054 20/07/2019 1751.489 1148.12 -396.642 111.9 114.95 3.05 2.98 1.86 1.85
DOD2019-058 07/08/2019 1737.463 1179.071 -373.329 81.37 84.7 3.33 2.93 7.80 7.62
DOD2019-062 11/08/2019 1744.189 1202.82 -374.002 77.16 84.74 7.58 7.37 1.20 1.20
DOD2019-064 14/08/2019 1745.167 1229.26 -373.199 76.4 85 8.6 8.46 1.44 1.44
DOD2019-065 17/08/2019 1740.74 1247.04 -361.376 81.65 84.6 2.95 2.78 1.13 1.05
DOD2019-071 11/08/2019 1743.136 1278.844 -354.397 93.1 101.25 8.15 7.65 2.10 2.10
DOD2019-072 17/08/2019 1746.972 1309.528 -355.602 92.53 95.14 2.61 2.61 0.75 0.65
DOD2019-073 21/08/2019 1753.994 1371.047 -347.596 115 119 4 3.51 1.25 1.25
DOD2019-074 23/07/2019 1754.501 1272.581 -378.005 73.85 75.55 1.7 1.65 2.32 1.28
DOD2019-075 27/06/2019 1767.642 1275.186 -399.987 78.4 82.6 4.2 4.07 1.54 1.54
DOD2019-076 30/06/2019 1763.209 1290.188 -389.498 75.15 78.5 3.35 3.34 5.37 5.37
DOD2019-077 02/07/2019 1773.238 1300.484 -402.742 83.08 85.72 2.64 2.51 7.24 6.04
DOD2019-078 20/07/2019 1775.85 1321.227 -399.189 81.9 88.05 6.15 6.03 2.78 2.78
DOD2019-079 18/07/2019 1761.896 1321.197 -377.872 75.45 78.97 3.52 3.50 6.99 6.99
MU9-019 08/08/2019 1858.279 1518.94 -529.552 150.2 158.35 8.15 5.24 1.46 1.46
MU9-020 18/08/2019 1887.54 1511.106 -600.533 204.7 224.15 19.45 9.19 1.57 1.57
POD2019-012 08/05/2019 1806.281 1414.745 -451.053 84.2 89 4.8 4.43 0.85 0.85
POD2019-013 11/05/2019 1803.162 1433.972 -446.062 78.16 85.55 7.39 7.07 1.47 1.47
POD2019-014 16/05/2019 1809.44 1445.913 -451.242 82.3 95.2 12.9 12.02 1.29 1.29
Table 5: Skarn Drilling Results (June 2019 – September 2019)
Hole ID Hole Completion Date Intercept
Northing
(Mine Grid) Intercept
Easting
(Mine Grid) Intercept
Elevation
(Mine Grid) From (m) To (m) Drilled
Width
(m) True Width (m) Au (g/t) Au min. 3m mining width (g/t)
MU9-009A 24/06/2019 1690.45 1586.03 -508.33 67.65 68.95 1.3 0.65 23.77 5.15
MU9-012 04/08/2019 1687.81 1612.9 -507.67 69.7 72 2.3 0.95 1.32 0.42
MU9-013 09/08/2019 1677.41 1637.61 -504.47 72.6 77.74 5.14 1.81 1.71 1.03
MU9-014 11/08/2019 1659.49 1619.51 -486.32 45.9 49.05 3.15 1.65 14.31 7.87
Figure 1: https://www.globenewswire.com/NewsRoom/AttachmentNg/39ab60c1-8d7f-42e2-ab79-516a1d5bb210
Figure 2: https://www.globenewswire.com/NewsRoom/AttachmentNg/8c0b8412-5a42-4f7e-909e-b3abb449db53
Figure 3: https://www.globenewswire.com/NewsRoom/AttachmentNg/a8c652ef-fb29-4e89-b323-8bbe23d04e0e
Figure 4: https://www.globenewswire.com/NewsRoom/AttachmentNg/0f63fdbb-b97f-4d19-9eeb-d23dc7671c53
Figure 5: https://www.globenewswire.com/NewsRoom/AttachmentNg/e281e025-2510-4f37-8c1e-83a9a4f35eb4
Figure 6: https://www.globenewswire.com/NewsRoom/AttachmentNg/bbf6894d-06c9-407e-86c3-d35d144fa1b7
Figure 7: https://www.globenewswire.com/NewsRoom/AttachmentNg/c570f17a-6077-415e-84fa-88bb51828bb5
Figure 8: https://www.globenewswire.com/NewsRoom/AttachmentNg/11e72bf7-c85a-4367-b770-6d09258bca45
Figure 9: https://www.globenewswire.com/NewsRoom/AttachmentNg/8fec8d46-d7a3-42d9-ac1e-a9bfd628f608
Drilling and Assaying
At Costerfield, diamond drill core was logged and sampled by Costerfield geologists. All samples were sent to OnSite Laboratory Services in Bendigo, Victoria, Australia, for sample preparation and assay. Site geological and metallurgical personnel have implemented a QA/QC process that includes the regular submission of standard reference materials and blanks with drill and face samples submitted for assay. Standard reference materials have been certified by Geostats Pty Ltd. (February 6, 2019 Technical Report entitled “Costerfield Operation, Victoria, Australia NI 43-101 Report”, available on SEDAR (www.sedar.com), which contains a complete description of drilling, sampling, and assaying procedures).
At Björkdal, all diamond drill core was logged and sampled by Björkdal geologists. Exploration drill hole samples (prefix MU) were sent to CRS Minlab Oy (CRS) in Kempele, Finland for sample preparation and assaying. Development Optimization drill hole samples (prefix DOD) were at the onsite lab ran by ALS for sample preparation and assaying (see March 28, 2019, Technical Report entitled “Technical Report on the Björkdal Gold Mine, Sweden”, available on SEDAR (www.sedar.com), which contains a complete description of drilling, sampling, and assaying procedures).
Assaying in both the CRS and ALS laboratories was conducted utilizing the Pal1000 (CRS) cyanide leaching processes. Mandalay’s rigorous QA/QC program included the use of standard reference samples, blanks, duplicates, repeats, and internal laboratory quality assurance procedures.
Qualified Person:
Chris Gregory, Vice President of Operational Geology and Exploration at Mandalay Resources, is a Member of the Australian Institute of Geoscientists (AIG), and a Qualified Person as defined by NI 43-101. He has reviewed and approved the technical and scientific information provided in this release.
For Further Information
Dominic Duffy
President and Chief Executive Officer
Edison Nguyen
Manager, Analytics and Investor Relations
Contact:
647.260.1566
About Mandalay Resources Corporation
Mandalay Resources is a Canadian-based natural resource company with producing assets in Australia and Sweden, and care and maintenance and development projects in Chile. The Company is focused on growing production at its gold and antimony operation in Australia, and gold production from its operation in Sweden to generate near term cash flow.
Forward-Looking Statements:
This news release contains "forward-looking statements" within the meaning of applicable securities laws, including statements regarding the exploration and development potential of the Youle deposit (Costerfield) and the Aurora Zone (Björkdal). Readers are cautioned not to place undue reliance on forward-looking statements. Actual results and developments may differ materially from those contemplated by these statements depending on, among other things, changes in commodity prices and general market and economic conditions. The factors identified above are not intended to represent a complete list of the factors that could affect Mandalay. A description of additional risks that could result in actual results and developments differing from those contemplated by forward-looking statements in this news release can be found under the heading “Risk Factors” in Mandalay’s annual information form dated March 28, 2019, a copy of which is available under Mandalay’s profile at www.sedar.com. In addition, there can be no assurance that any inferred resources that are discovered as a result of additional drilling will ever be upgraded to proven or probable reserves. Although Mandalay has attempted to identify important factors that could cause actual actions, events or results to differ materially from those described in forward-looking statements, there may be other factors that cause actions, events or results not to be as anticipated, estimated or intended. There can be no assurance that forward-looking statements will prove to be accurate, as actual results and future events could differ materially from those anticipated in such statements. Accordingly, readers should not place undue reliance on forward-looking statements.
image: https://www.globenewswire.com/newsroom/ti?nf=NzcyNDAxMiMzMTQwMTg1IzIwMjg0ODA=
image: https://ml.globenewswire.com/media/b5f2fa1c-f64d-4f0c-a9c7-ff4d73fc1ef0/small/mandalay-resources-logo.jpg
Primary Logo
Figure 1
image: https://ml.globenewswire.com/media/39ab60c1-8d7f-42e2-ab79-516a1d5bb210/medium/figure-1.png
Longitudinal Section and Plan Section of Youle (Costerfield) Illustrating Location of Recent Intercepts along with first access on Youle
Figure 2
image: https://ml.globenewswire.com/media/8c0b8412-5a42-4f7e-909e-b3abb449db53/medium/figure-2.png
Longitudinal Section Illustrating Current Drill Hole CD001 and Planned Drill Hole Locations of Costerfield Deep Drilling Program
Figure 3
image: https://ml.globenewswire.com/media/a8c652ef-fb29-4e89-b323-8bbe23d04e0e/medium/figure-3.png
Downhole trace-level geochemistry of CD001, showing correlation of elevated Au-Sb-As-Ag and hydrothermal muscovite alteration between 975-1040m.
Figure 4
image: https://ml.globenewswire.com/media/0f63fdbb-b97f-4d19-9eeb-d23dc7671c53/medium/figure-4.png
Björkdal Mine Scale Overview Map Showing the Location of the Aurora Zone and Lake Zone Skarn in Relation to Mine Development. Black Box Denotes Level Plan for Lake Zone Skarn
Figure 5
image: https://ml.globenewswire.com/media/e281e025-2510-4f37-8c1e-83a9a4f35eb4/medium/figure-5.png
Longitudinal Section of the Aurora Zone Illustrating Location of Recent Intercepts
Figure 6
image: https://ml.globenewswire.com/media/bbf6894d-06c9-407e-86c3-d35d144fa1b7/medium/figure-6.png
Cross Sections of Björkdal Mine Area Showing the Location and Current Size of the Aurora Zone (A-A’) and Lake Zone Skarn (C-C’), in which the Black Box Denotes Focused Cross Section in Figure 7
Figure 7
image: https://ml.globenewswire.com/media/c570f17a-6077-415e-84fa-88bb51828bb5/medium/figure-7.png
Cross Section Displaying the Current Limits of the Lake Zone Skarn Horizon
Figure 8
image: https://ml.globenewswire.com/media/11e72bf7-c85a-4367-b770-6d09258bca45/medium/figure-8.png
Cross Section Displaying the Current Limits of the Lake Zone Skarn Horizon
Figure 9
image: https://ml.globenewswire.com/media/8fec8d46-d7a3-42d9-ac1e-a9bfd628f608/medium/figure-9.png
Schematic Level Plan of the Lake Zone Skarn Horizon Illustrating Location of Recent Intercepts
GlobeNewswire
September 30, 2019 - 1:30 PM PDT
Tags:
INDUSTRIAL METALS & MINERALS
Read more at https://stockhouse.com/news/press-releases/2019/09/30/mandalay-resources-corporation-provides-exploration-update#q8fZvMJ7OJtZc0Ed.99
In GOD We Trust -
https://www.kitco.com/images/live/silver.gif?0.8344882022363285
http://www.kitconet.com/images/live/au0001wb.gif
Gold & Silver is the only REAL Legal Tender -
by The Founding Fathers for your -
Rights, Liberty and Freedom -
http://www.biblebelievers.org.au/monie.htm
God Bless America
Ps.
opinion appreciated
TIA
NYBob
10 years ago
Mandalay Resources Completes Acquisition of Elgin Mining -
Date : 09/10/2014 @ 4:05PM
Source : PR Newswire (US)
Stock : Elgin Mining (ELG)
Quote : 0.4 0.0 (0.00%) @ 2:05AM
Mandalay Resources Completes Acquisition of Elgin Mining
http://ih.advfn.com/p.php?pid=nmona&article=63547949
http://www.mandalayresources.com/
Elgin Mining (TSX:ELG)
Historical Stock Chart
1 Month : From Sep 2014 to Oct 2014
Click Here for more Elgin Mining Charts.
TORONTO, September 10, 2014 /PRNewswire/ --
Mandalay Resources Corporation ("Mandalay") (TSX: MND) and Elgin Mining Inc. ("Elgin") (TSX: ELG) are pleased to announce the completion of the acquisition of Elgin by Mandalay by way of a court-approved plan of arrangement (the "Arrangement").
Mr. Brad Mills, Chief Executive Officer of Mandalay, commented, "I am pleased to announce that we have successfully closed the Elgin transaction as planned, adding Elgin's Björkdal gold mine in Sweden as Mandalay's third producing mine in a top mining jurisdiction. We welcome all of the Elgin and Björkdal staff who are joining Mandalay and have worked hard to complete this transaction. We currently expect that the Björkdal mine will produce 8,000 to 10,000 ounces of gold during the fourth quarter of the year, which increases our overall 2014 Mandalay production guidance to a range of 138,000 to 148,000 ounces of gold equivalent."
Mr. Mills continued, "Our plans for the Björkdal mine will immediately focus on refining the life of mine resource and reserve model for the open pit and underground mines, improving the grade of production of both mines based upon this more granular model, evaluating and adopting new milling approaches in the plant to improve gold recovery and expand plant capacity. We will also evaluate all of the exploration potential on the property and commence an exploration program to expand reserves. We anticipate that we will start to see results from these efforts within the next three to six months. The first milestone will be the release of a new independent Technical Reserve and Resource Report which Mandalay has commissioned on the property."
Mr. Mills concluded, "In connection with our acquisition of Elgin, Mandalay has reviewed its property portfolio and decided to sell two assets which are now deemed non-core to our future plans. These assets are the Lupin gold mine, in Nunavut, Canada, and the La Quebrada copper-silver project in Chile."
The Plan of Arrangement
Pursuant to the Arrangement, Mandalay acquired each outstanding Elgin common share (each, an "Elgin Share") in exchange for CDN$0.37 in cash (the "Cash Consideration") or 0.4111 of a Mandalay common share (each, a "Mandalay Share") (the "Share Consideration"), subject to pro-ration if the aggregate Cash Consideration would exceed CDN$27 million or the aggregate Share Consideration would exceed 50 million Mandalay Shares.
Based on valid elections received prior to the election deadline and deemed elections, shareholders of Elgin (the "Elgin Shareholders") elected to receive:
the Share Consideration in respect of 188,980,537 Elgin Shares (which, at 0.4111 of a Mandalay Share per Elgin Share, would result in aggregate Share Consideration of approximately 77.7 million Mandalay Shares); and
the Cash Consideration in respect of 4,461,519 Elgin Shares (which, at CDN$0.37 per Elgin Share, would result in aggregate Cash Consideration of approximately CDN$1.7 million).
Since the aggregate Share Consideration would otherwise exceed 50 million Mandalay Shares, all elections (including deemed elections) have been pro-rated in the manner described in the management information circular dated July 25, 2014 prepared by Elgin in connection with the Arrangement. This has resulted in the number of Mandalay Shares that each Elgin Shareholder exchanged for the Share Consideration being reduced by applying an approximate 64.358% pro-ration factor.
For illustrative purposes only, and using the example of an individual holding 1,000 Elgin Shares:
if such Elgin Shareholder elected to receive Cash Consideration in respect of all of their Elgin Shares held, the Elgin Shareholder would be entitled to receive CDN$370 (being CDN$0.37 for each Elgin Share); or
if such Elgin Shareholder elected (or was deemed to have elected) to receive Share Consideration in respect of all of their Elgin Shares, the Elgin Shareholder would be entitled to receive approximately 264 Mandalay Shares in consideration for a portion of their Elgin Shares and CDN$131.88 cash in consideration for the remaining portion of the Elgin Shares.
Any questions or requests for assistance in surrendering certificates that formerly represented Elgin Shares in order to receive the Arrangement consideration may be directed to the depository, Computershare Investor Services Inc., by telephone at 1-800-564-6253 toll-free in North America, 1-514-982-7555 outside of North America or by e-mail at corporateactions@computershare.com.
De-listing of the Elgin Shares from the Toronto Stock Exchange ("TSX") is expected to occur shortly. Concurrent with the delisting of the Elgin Shares, Elgin will apply to all applicable Canadian securities regulatory authorities in order to cease to be a reporting issuer.
About Mandalay Resources Corporation
Mandalay Resources is a Canadian-based natural resource company with producing assets in Australia and producing and development projects in Chile. Mandalay is focused on executing a roll-up strategy, creating critical mass by aggregating advanced or in-production gold, copper, silver and antimony projects in Australia and the Americas to generate near-term cash flow and shareholder value.
Forward-Looking Statements
This news release contains forward-looking statements within the meaning of securities legislation and which are based on the expectations, estimates and projections of management of Mandalay as of the date of this news release unless otherwise stated, including statements regarding Mandalay's estimates of future production, its plans for the Björkdal mine and its planned sale of the Lupin and La Quebrada properties. Readers are cautioned not to place undue reliance on forward-looking statements. Actual results and developments may differ materially from those contemplated by these statements depending on, among other things, changes in commodity prices and general market and economic conditions. The factors identified above are not intended to represent a complete list of the factors that could affect Mandalay. A description of additional risks that could result in actual results and developments differing from those contemplated by forward-looking statements in this news release can be found under the heading "Risk Factors" in Mandalay's annual information form dated March 28, 2014, a copy of which is available under Mandalay's profile at http://www.sedar.com. Although Mandalay has attempted to identify important factors that could cause actual actions, events or results to differ materially from those described in forward-looking statements, there may be other factors that cause actions, events or results not to be as anticipated, estimated or intended. There can be no assurance that forward-looking statements will prove to be accurate, as actual results and future events could differ materially from those anticipated in such statements. Accordingly, readers should not place undue reliance on forward-looking statements.
Image with caption: "Mandalay Resources Corporation (CNW Group/Mandalay Resources Corporation)". Image available at: http://40rhel5streamview01.newswire.ca/media/2014/09/10/20140910-761633-42734-5c28e3ce-b114-49cd-9889-c3532704a75b.jpg
Image with caption: "Elgin Mining Inc. (CNW Group/Mandalay Resources Corporation)". Image available at: http://40rhel5streamview01.newswire.ca/media/2014/09/10/20140910-761633-42736-5c28e3ce-b114-49cd-9889-c3532704a75b.jpg
For further information:
Bradford Mills
Chief Executive Officer
Greg DiTomaso
Investor Relations
Contact:
+1-647-260-1566
NYBob
10 years ago
Mandalay Resources Completes Acquisition of Elgin Mining
Photo_Asset_1
TORONTO, Sept. 10, 2014 /CNW/ -
Mandalay Resources Corporation ("Mandalay") (TSX: MND)
and
Elgin Mining Inc. ("Elgin") (TSX: ELG)
are pleased to announce the completion of the acquisition of
Elgin by Mandalay by way of a court-approved plan of
arrangement (the "Arrangement").
http://web.tmxmoney.com/article.php?newsid=70218100&qm_symbol=MND:TSX
Mr. Brad Mills, Chief Executive Officer of Mandalay, commented, "I am pleased to announce that we have successfully closed the Elgin transaction as planned, adding Elgin's Björkdal gold mine in Sweden as Mandalay's third producing mine in a top mining jurisdiction. We welcome all of the Elgin and Björkdal staff who are joining Mandalay and have worked hard to complete this transaction. We currently expect that the Björkdal mine will produce 8,000 to 10,000 ounces of gold during the fourth quarter of the year, which increases our overall 2014 Mandalay production guidance to a range of 138,000 to 148,000 ounces of gold equivalent."
Mr. Mills continued, "Our plans for the Björkdal mine will immediately focus on refining the life of mine resource and reserve model for the open pit and underground mines, improving the grade of production of both mines based upon this more granular model, evaluating and adopting new milling approaches in the plant to improve gold recovery and expand plant capacity. We will also evaluate all of the exploration potential on the property and commence an exploration program to expand reserves. We anticipate that we will start to see results from these efforts within the next three to six months. The first milestone will be the release of a new independent Technical Reserve and Resource Report which Mandalay has commissioned on the property."
Mr. Mills concluded, "In connection with our acquisition of Elgin, Mandalay has reviewed its property portfolio and decided to sell two assets which are now deemed non-core to our future plans. These assets are the Lupin gold mine, in Nunavut, Canada, and the La Quebrada copper-silver project in Chile."
The Plan of Arrangement
Pursuant to the Arrangement, Mandalay acquired each outstanding Elgin common share (each, an "Elgin Share") in exchange for CDN$0.37 in cash (the "Cash Consideration") or 0.4111 of a Mandalay common share (each, a "Mandalay Share") (the "Share Consideration"), subject to pro-ration if the aggregate Cash Consideration would exceed CDN$27 million or the aggregate Share Consideration would exceed 50 million Mandalay Shares.
Based on valid elections received prior to the election deadline and deemed elections, shareholders of Elgin (the "Elgin Shareholders") elected to receive:
the Share Consideration in respect of 188,980,537 Elgin Shares (which, at 0.4111 of a Mandalay Share per Elgin Share, would result in aggregate Share Consideration of approximately 77.7 million Mandalay Shares); and
the Cash Consideration in respect of 4,461,519 Elgin Shares (which, at CDN$0.37 per Elgin Share, would result in aggregate Cash Consideration of approximately CDN$1.7 million).
Since the aggregate Share Consideration would otherwise exceed 50 million Mandalay Shares, all elections (including deemed elections) have been pro-rated in the manner described in the management information circular dated July 25, 2014 prepared by Elgin in connection with the Arrangement. This has resulted in the number of Mandalay Shares that each Elgin Shareholder exchanged for the Share Consideration being reduced by applying an approximate 64.358% pro-ration factor.
For illustrative purposes only, and using the example of an individual holding 1,000 Elgin Shares:
if such Elgin Shareholder elected to receive Cash Consideration in respect of all of their Elgin Shares held, the Elgin Shareholder would be entitled to receive CDN$370 (being CDN$0.37 for each Elgin Share); or
if such Elgin Shareholder elected (or was deemed to have elected) to receive Share Consideration in respect of all of their Elgin Shares, the Elgin Shareholder would be entitled to receive approximately 264 Mandalay Shares in consideration for a portion of their Elgin Shares and CDN$131.88 cash in consideration for the remaining portion of the Elgin Shares.
Any questions or requests for assistance in surrendering certificates that formerly represented Elgin Shares in order to receive the Arrangement consideration may be directed to the depository, Computershare Investor Services Inc., by telephone at 1-800-564-6253 toll-free in North America, 1-514-982-7555 outside of North America or by e-mail at corporateactions@computershare.com.
De-listing of the Elgin Shares from the Toronto Stock Exchange ("TSX") is expected to occur shortly. Concurrent with the delisting of the Elgin Shares, Elgin will apply to all applicable Canadian securities regulatory authorities in order to cease to be a reporting issuer.
About Mandalay Resources Corporation
Mandalay Resources is a Canadian-based natural resource company with producing assets in Australia and producing and development projects in Chile. Mandalay is focused on executing a roll-up strategy, creating critical mass by aggregating advanced or in-production gold, copper, silver and antimony projects in Australia and the Americas to generate near-term cash flow and shareholder value.
Forward-Looking Statements
This news release contains forward-looking statements within the meaning of securities legislation and which are based on the expectations, estimates and projections of management of Mandalay as of the date of this news release unless otherwise stated, including statements regarding Mandalay's estimates of future production, its plans for the Björkdal mine and its planned sale of the Lupin and La Quebrada properties. Readers are cautioned not to place undue reliance on forward-looking statements. Actual results and developments may differ materially from those contemplated by these statements depending on, among other things, changes in commodity prices and general market and economic conditions. The factors identified above are not intended to represent a complete list of the factors that could affect Mandalay. A description of additional risks that could result in actual results and developments differing from those contemplated by forward-looking statements in this news release can be found under the heading "Risk Factors" in Mandalay's annual information form dated March 28, 2014, a copy of which is available under Mandalay's profile at www.sedar.com. Although Mandalay has attempted to identify important factors that could cause actual actions, events or results to differ materially from those described in forward-looking statements, there may be other factors that cause actions, events or results not to be as anticipated, estimated or intended. There can be no assurance that forward-looking statements will prove to be accurate, as actual results and future events could differ materially from those anticipated in such statements. Accordingly, readers should not place undue reliance on forward-looking statements.
SOURCE Mandalay Resources Corporation
Photo_Asset_2
Image with caption: "Mandalay Resources Corporation (CNW Group/Mandalay Resources Corporation)". Image available at: http://photos.newswire.ca/images/download/20140910_C8885_PHOTO_EN_42734.jpg
Image with caption: "Elgin Mining Inc. (CNW Group/Mandalay Resources Corporation)". Image available at: http://photos.newswire.ca/images/download/20140910_C8885_PHOTO_EN_42736.jpg
Bradford Mills
Chief Executive Officer
Greg DiTomaso
Investor Relations
Contact:
647.260.1566
Copyright CNW Group 2014
Back
NYBob
10 years ago
Mandalay Resources Corporation (MND:TSX)
Exchange: TSX Exchange
http://web.tmxmoney.com/quote.php?qm_symbol=MND:TSX
Mandalay Resources Corporation Provides Update on Challacollo Infill Drilling and Feasibility Study Progress
TORONTO, September 10, 2014 /PRNewswire/ --
Mandalay Resources Corporation ("Mandalay" or the "Company") (TSX: MND, MND.WT) is pleased to provide an update on the progress of its infill drilling and feasibility study at its Challacollo, Chile, silver-gold project (click here for Figure 1 Property Map).
Key activities to date include:
The General Manager and Construction Manager have been hired and are managing the feasibility and permitting work.
The major components of the feasibility study (e.g. drilling, assaying, metallurgical studies, hydrogeological studies, plant and tailings design, environmental impact evaluation, overall feasibility study preparation and the permitting application) have been tendered and contracts established with selected contractors.
Baseline studies of environmental, community and social aspects of the project are in progress as part of the permitting plan.
Infill drilling of the existing Inferred Mineral Resource is complete. Through September 3, Mandalay had completed 6,469 meters of infill HQ diamond core in 36 holes. Assays have been received for 23 of these holes as reported in Table 1 below.
Drilling has shifted to testing extensions of the main Lolon vein and other vein targets in the district.
Metallurgical testing (assaying, crushing, comminution, agitation leaching, filtration) of bulk underground and diamond drill core samples is in progress for process selection and plant design.
Groundwater exploration and well development planning is in progress along with the evaluation of other infrastructure requirements.
Brad Mills, CEO of Mandalay, commented, "The feasibility study launched in March of this year is on track for its intended conclusion in the first quarter of 2015. We have identified and hired an excellent management team for the project, who are conducting the geological, metallurgical, hydrological, infrastructure, environmental and cultural studies at the planned pace and cost."
Mr. Mills continued, "Drilling results to date have demonstrated consistent continuity of mineralization and confirmed similar grades to those derived from previous drilling conducted by Silver Standard, from whom Mandalay purchased the project in February of this year. These drill results are also consistent with the Independent Technical Report and Mineral Resource estimated by RPA, published in January of this year. These new results give us confidence that the program will be successful in its objective of upgrading substantially all of the previously Inferred Mineral Resource to Indicated, ready to convert to Mineral Reserves once they are incorporated into a mine plan as part of a successful conclusion of the feasibility study."
The Drill Program
The current drill program commenced in May, 2014, with the objective to infill some 3.9 million tonnes of Inferred Mineral Resources at 193 grammes per tonne ("g/t") silver and 0.32 g/t gold as estimated by Roscoe Postle Associates ("RPA") in their technical report dated January 30, 2014 and entitled "Technical Report on the Challacollo Silver-Gold Project, Region 1, Chile" (the "RPA Report") and convert them to Indicated and Measured categories to support the mine design portion of the feasibility study.
Infill core drilling of the resource portion of the Lolon vein is now completed. In addition we have identified extensions to the main Lolon vein and other nearby veins that could add to the mineral resource inventory and these targets are now being followed up with additional drill testing. All drilling activities are expected to be completed by October.
A complete description of the property, geology and resources at the time of acquisition in February, 2014, is contained in the RPA Report, available on http://www.sedar.com.
(click here for Figure 2 Challacollo Veins)
(click here for Figure 3 Lolon Vein Long-Section)
Table 1 - Infill Drill Results through September 3, 2014
Int.
Int. Int. Int. TRUE Au Ag
Hole From To Angle Width Grade Grade
Hole_ID Depth (m) (m) (deg) (m) (g/t) (g/t)
DCH-01 200 87.2 101.0 30 6.9 0.07 42
DCH-02 116.6 80.5 93.9 30 6.7 0.09 32
DCH-03 175 97.1 121.4 60 21.0 0.28 27
DCH-04 142.9 115.0 117.4 60 2.1 0.03 17
DCH-05 158.7 98.0 122.5 36 14.4 0.17 52
DCH-06 190 143.7 164.9 32 11.2 0.34 134
DCH-07(1) 134.6
DCH-07A 199 166.0 187.7 44 15.1 0.43 306
DCH-08 187.3 158.6 163.9 40 3.4 0.40 266
DCH-09 148.7 106.5 129.2 60 19.6 0.48 239
DCH-10 190 150.4 179.8 30 14.7 0.28 277
DCH-11 132.6 98.1 119.5 57 17.9 0.42 155
DCH-12 145.2 96.0 103.6 60 6.6 0.48 351
DCH-13 242.5 193.4 219.0 50 19.6 0.08 111
DCH-14 241 196.4 206.1 40 6.2 0.32 121
DCH-15 162.5 113.6 122.0 40 5.4 0.26 104
DCH-16 200.7 169.0 186.9 50 13.7 0.20 250
DCH-17 163.9 140.4 159.7 40 12.4 0.31 70
DCH-18 215.5 188.7 202.5 50 10.6 0.10 83
DCH-19 161.9 118.2 139.4 60 18.4 0.32 92
DCH-20 250 172.6 214.4 45 29.6 0.32 171
DCH-21 136.4 98.2 128.5 30 15.2 0.68 232
DCH-22 212.7 167.0 199.7 30 16.4 0.38 97
DCH-23 107.8 72.0 98.3 40 16.9
DCH-24 170.7 77.2 102.7 60 22.1
DCH-25 130 95.0 117.9 40 14.7
DCH-26 180 126.0 153.8 30 13.9
DCH-27 110.7 39.1 61.4 30 11.2
DCH-28 120 69.7 106.0 30 18.2
DCH-29 120 45.8 83.0 50 28.5
DCH-30 140 75.3 99.3 30 12.0
DCH-31 387.5 126.7 130.2 30 1.7 0.02 3
DCH-32 130.7 106.7 113.3 40 4.2
DCH-33 128.2 72.0 91.1 70 17.9
DCH-34 89.3 57.6 77.8 40 13.0
DCH-35 198.8 153.0 171.6 50 14.2
DCH-36 282.0 216.0 244.6 30 12.8
(1) Hole abandoned for equipment problems, re-drilled as DCH-07A
Mandalay follows a strict Quality Assurance and Quality Control ("QA/QC") program in accordance with industry standards that includes incorporation of blanks and standards in every assay batch as well as duplicate assays of selected samples. Core is logged by Mandalay geologists before mineralized intervals are sawn in half. Mandalay geologists then bag half the core on-site for assay and store the remaining core for reference. Samples are shipped to the ALS laboratory in Antofagasta, Chile, where Mandalay blanks are inserted before the samples are crushed and pulverized. Mandalay certified standards, previously prepared from Challacollo material, are then inserted in each batch before the pulps are shipped to ALS in Lima, Peru, for analysis.
All samples are analyzed for 41 elements using ICP-AES with agua regia leach, as well as assayed using 30 g fire assay with gravimetric finish for Au and Ag in addition to cyanide leach for Ag, Au, and Cu.
Qualified Person:
Ronald Luethe, General Manager of Minera Mandalay Ltda. is an Idaho registered Professional Geologist and an AIPG Certified Professional Geologist. As a Qualified Person defined by NI 43-101, he has reviewed and approved the technical and scientific information contained in this release.
About Mandalay Resources Corporation:
Mandalay Resources is a Canadian-based natural resource company with production and exploration assets in Australia and Chile. The Company is focused on executing a roll-up strategy, creating critical mass by aggregating advanced or in-production gold, copper, silver and antimony projects in Australia and the Americas to generate near-term cash flow and shareholder value.
Forward-Looking Statements:
This news release contains "forward-looking statements" within the meaning of applicable securities laws, in particular the significance of reported drill intercepts from the Challacollo Project with respect to the Company's operational plans and expectations. Readers are cautioned not to place undue reliance on forward-looking statements, since actual results and developments may differ materially from those contemplated by these statements depending on, among other things, changes in commodity prices, general market and economic conditions, and success of future drilling. The factors identified above are not intended to represent a complete list of the factors that could affect Mandalay. A description of additional risks that could result in actual results and developments differing from those contemplated by forward-looking statements in this news release can be found under the heading "Risk Factors" in Mandalay's annual information form dated March 28, 2014, a copy of which is available under Mandalay's profile at http://www.sedar.com. In addition, there can be no assurance that any resources that are discovered as a result of drilling will ever be upgraded to proven or probable reserves. Although Mandalay has attempted to identify important factors that could cause actual actions, events or results to differ materially from those described in forward-looking statements, there may be other factors that cause actions, events or results not to be as anticipated, estimated or intended. There can be no assurance that forward-looking statements will prove to be accurate, as actual results and future events could differ materially from those anticipated in such statements. Accordingly, readers should not place undue reliance on forward-looking statements.
PDF available at: http://stream1.newswire.ca/media/2014/09/10/20140910_C8903_DOC_EN_42742.pdf
PDF available at: http://stream1.newswire.ca/media/2014/09/10/20140910_C8903_DOC_EN_42743.pdf
PDF available at: http://stream1.newswire.ca/media/2014/09/10/20140910_C8903_DOC_EN_42744.pdf
For further information:
Bradford Mills
Chief Executive Officer
Greg DiTomaso
Investor Relations
Contact: +1-647-260-1566
Email: g.ditomaso@mandalayresources.com
Company website: http://www.mandalayresources.com
NYBob
11 years ago
Mandalay Resources to Acquire Elgin Mining -
http://web.tmxmoney.com/article.php?newsid=68223029&qm_symbol=ELG:TSX
TORONTO, ONTARIO and VANCOUVER, BRITISH COLUMBIA--(Marketwired - June 4, 2014) -
Mandalay Resources Corporation ("Mandalay") (TSX:MND) and
Elgin Mining Inc.
("Elgin") (TSX:ELG) announced today that they have entered into an
arrangement agreement pursuant to which Mandalay will
acquire all of the outstanding common shares of
Elgin for consideration consisting of
C$0.37 cash or
0.4111 of a Mandalay common share per Elgin common share,
subject to pro ration.
The total transaction value is approximately C$70 million.
Based on the closing price of Mandalay's shares on June 3, 2014,
the implied transaction value of C$0.37 per Elgin share represents
an 85% premium to Elgin's closing share price of $0.20 on
June 3, 2014, the last trading day before announcement of the
transaction and a 53% premium to Elgin's 20 day volume-weighted
trading price of $0.24 on June 3, 2014.
The transaction will add Elgin's Björkdal gold mine in Sweden as
Mandalay's third producing and positive cash flow generating
asset.
Björkdal is a safe, highly productive, mechanized underground and
open pit mine with a highly automated processing plant producing
gravity gold concentrate and flotation gold concentrate.
Elgin's full-year production guidance for Björkdal in 2014 is
44,000 to 49,000 ounces of gold at
US$886 to US$982/oz cash cost and
US$1,088 to US$1,207/oz all-in cost.
With Björkdal's forecast production for the second half of 2014
added to Mandalay's existing production guidance,
Mandalay's total gold equivalent production guidance for 2014
increases to 152,000 to 167,000 gold equivalent ounces.
Brad Mills, CEO of Mandalay, commented, "Mandalay's core strategy is to acquire cash flowing or near cash flowing assets in geopolitically stable and mining-supportive jurisdictions that have excellent exploration potential and where Mandalay's operational expertise can make a material difference to the performance of the asset in the short to medium-term. The Björkdal mine is an ideal fit for Mandalay. Elgin has already identified and initiated optimization strategies for Björkdal mine. These, coupled with Mandalay's mine design and execution experience, will insure the operational strategies being deployed at Björkdal achieve maximum impact. We believe that the application of Mandalay's financial and technical resources can help the Björkdal mine significantly grow production and materially reduce costs per ounce in the coming 12 to 36 months. We expect that with this growth, this transaction will be highly accretive to Mandalay shareholders on an EBITDA, earnings per share, net asset value, free cash flow per share, and reserves and resources per share basis from 2015 onwards at current metal prices."
Patrick Downey, CEO of Elgin stated, "The combination of Mandalay and Elgin will provide our shareholders with the opportunity to gain exposure to a growing and profitable producer with operations in politically and fiscally stable jurisdictions, while still providing exposure to the upside at Björkdal. Mandalay has an excellent track record of growing and optimizing mine operations and producing value for their shareholders. With their balance sheet and technical expertise, I believe that the combined company will maximize the value of Björkdal for the benefit of both the Mandalay and Elgin shareholders, and I look forward to working with the Mandalay team."
Benefits for Mandalay Shareholders
The proposed transaction:
adds a third producing and cash flow generating mine in a mining friendly jurisdiction to Mandalay's existing operations;
increases and diversifies Mandalay's production profile by adding
Björkdal's annual production of nearly 50,000 oz of gold to
Mandalay's current 130,000 to 143,000 oz gold equivalent annual
production rate;
provides an opportunity for Mandalay to generate additional value
by applying Mandalay's demonstrated capabilities to grow
production, lower costs and increase reserves to
Björkdal's operations over the next 12 to 36 months;
provides Mandalay with positive EBITDA and cash flow at current gold prices and current cash and all-in cost levels at Björkdal;
includes large resources and excellent exploration potential for potentially long mine life and/or significant organic growth profile;
demonstrates Mandalay's continued business development success in being able to add high value assets to its portfolio at attractive prices; and
offers the potential for a substantial re-rating of Mandalay to a multiple in line with or superior to other mid-tier precious metals producers based on Mandalay's low-cost production, free cash flow, dividend policy, proven management team and a fully funded growth trajectory going forward through to the scheduled construction in 2016 of the Challacollo silver-gold project currently in feasibility.
Benefits for Elgin Shareholders
significant and immediate premium to the current common share price;
strong re-rate potential as Mandalay continues to grow to a mid-tier profitable producer;
diversifies our asset base while remaining in politically stable jurisdictions;
provides the cash and balance sheet to accelerate the continued ongoing growth at Björkdal;
proven combined management and technical teams with extensive exploration, development and operations experience; and
the combined company will have increased market presence and enhanced trading liquidity.
Transaction Details
The transaction will be completed by way of a statutory plan of
arrangement pursuant to the Business Corporations Act (Ontario).
Under the terms of the arrangement,
Elgin shareholders may elect
to receive, in exchange for each of their Elgin common shares,
C$0.37 in cash or
0.4111 of a Mandalay share.
Elections will be subject to pro ration based on a maximum
aggregate amount of Mandalay common shares of 50,000,000 and a
maximum aggregate amount of cash of $25,000,000.
The transaction is not conditional on any financing.
As part of the transaction, all of Elgin's C$0.20 common share
purchase warrants (to the extent not otherwise exercised prior
to closing) will be cancelled at closing in exchange for
a cash payment of C$0.17 per common share purchase warrant.
The transaction has been unanimously approved by
Mandalay's board of directors and no further corporate or
shareholder approvals are required by
Mandalay to complete the transaction.
The Elgin board of directors has unanimously approved the
transaction and has resolved to unanimously recommend that
Elgin shareholders vote in favor of the transaction at a special
meeting of the shareholders to approve the transaction.
Primary Capital Inc. has provided an opinion to
the Elgin board of directors that, as of June 2, 2014,
the consideration under the proposed transaction is fair,
from a financial point of view, to Elgin's shareholders.
Completion of the transaction is subject to customary closing conditions, including Ontario court approvals and a favorable vote of at least two-thirds of the votes cast by Elgin shareholders as well as the resolution, to Mandalay's satisfaction, of Elgin's outstanding reclamation obligations relating to its former coal operations in Kentucky.
In connection with the execution of the arrangement agreement,
shareholders who collectively own approximately 41.4% of
Elgin's issued and outstanding common shares have entered into
agreements with Mandalay pursuant to which they have agreed,
among other things, that they will vote all of their
Elgin common shares in favour of the transaction.
The arrangement agreement includes customary non-solicitation provisions applicable to Elgin and provides for the payment of a C$2,000,000 break-up fee to Mandalay if the transaction is terminated in certain circumstances.
Elgin will seek shareholder approval for the transaction at
its annual general meeting, which it expects will be held in
the third quarter of 2014.
In connection with the meeting, Elgin will mail an information
circular to its shareholders providing further details of the
transaction.
Assuming timely receipt of all necessary court and shareholder
approvals and the satisfaction of all other conditions, closing is
expected to occur shortly after the Elgin shareholder meeting.
Elgin has obtained the approval of the Toronto Stock Exchange to
defer holding its annual meeting until September 30, 2014.
Bridge Loan
In connection with the transaction, Mandalay has agreed to provide
a convertible bridge loan of approximately $5,000,000 to Elgin.
Elgin will use the proceeds of the loan to repay its existing
bridge loan from Sprott Resource Lending Partnership, which
contains restrictions on Elgin's ability to satisfy its Kentucky
coal reclamation obligations.
The Bridge Loan will (i) bear interest at a rate of 10% per annum,
(ii) have a term of six months, (iii) subject to TSX approval,
be convertible into Elgin common shares at Mandalay's option at a
price of C$0.1565 per share and (iv) be secured by, among other
things, a pledge of all of the shares of
Elgin's Swedish subsidiaries (Björkdalsgruvan Aktiebolag and
Björkdal Exploration AB).
Advisors
Raymond James Ltd. is acting as financial advisor to
Mandalay and Goodmans LLP is acting as legal counsel to Mandalay.
Primary Capital Inc. is acting as financial advisor to
Elgin and Cassels Brock & Blackwell LLP is acting as
legal counsel to Elgin.
Conference Call
Interested Analysts and investors are invited to participate in a conference call which will be held on June 4, 2014 at 11:00 am (ET), using the following dial-in numbers:
Participant Number (International/Local): (647) 427-7450
Participant Number (Toll free North America): (888) 231-8191
Conference ID: 56501272
A replay of the conference call will be available until 23:59 pm (ET),
June 11, 2014 and can be accessed using the following dial-in
numbers:
1.855.859.2056
416.849.0833
403.451.9481
778.371.8506
Password: 56501272
About Mandalay Resources Corporation
Mandalay Resources is a Canadian-based natural resource company with producing assets in Australia and producing and development projects in Chile. Mandalay is focused on executing a roll-up strategy, creating critical mass by aggregating advanced or in-production gold, copper, silver and antimony projects in Australia and the Americas to generate near-term cash flow and shareholder value.
About Elgin Mining Inc.
Elgin is a Canadian-based company focused on production at the Björkdal gold mine in Sweden. In addition, Elgin's portfolio includes the Lupin and Ulu gold projects located in Nunavut, Canada.
Forward-Looking Statements
This news release contains forward-looking statements within the meaning of securities legislation and which are based on the expectations, estimates and projections of management of the parties as of the date of this news release unless otherwise stated. Forward-looking statements are generally identifiable by use of the words "expect", "anticipate", "continue", "estimate", "objective", "ongoing", "may", "will", "project", "should", "believe", "plans", "intends" or the negative of these words or other variations on these words or comparable terminology. More particularly, and without limitation, this news release contains forward-looking statements and information concerning expectations regarding the consideration to be issued pursuant to the transaction, the ability of Mandalay and Elgin to consummate the transaction on the terms and in the manner contemplated thereby, the anticipated benefits of the transaction, the anticipated timing of the transaction and forecast production amounts for both Mandalay and Elgin. Such forward-looking statements involve known and unknown risks, uncertainties and other factors which may cause actual results, performance or achievements to be materially different from any future results, performance or achievements expressed or implied by the forward-looking statements. Such factors include, among others, the time required to prepare and mail meeting materials to Elgin shareholders, the ability of the parties to receive, in a timely manner and on satisfactory terms, the necessary court, shareholder, stock exchange and regulatory approvals and the ability of the parties to satisfy, in a timely manner, the conditions to the closing of the transaction, as well as other uncertainties and risk factors set out in filings made from time to time by Mandalay and Elgin with the Canadian securities regulators, including, without limitation, Mandalay's annual information form dated March 28, 2014 and Elgin annual information form dated March 21, 2014, both of which are available on SEDAR at www.sedar.com. Actual results, developments and timetables could vary significantly from the estimates presented. Readers are cautioned not to put undue reliance on forward-looking statements.
Mandalay Resources Corporation
Bradford Mills
Chief Executive Officer
647.260.1566
Mandalay Resources Corporation
Greg DiTomaso
Investor Relations
647.260.1566
g.ditomaso@mandalayresources.com
http://www.mandalayresources.com
Elgin Mining Inc.
Patrick Downey
President and Chief Executive Officer
(604) 682-3363
(604) 682-3366
info@elginmining.com
http://www.elginmining.com
http://web.tmxmoney.com/article.php?newsid=68223029&qm_symbol=ELG:TSX
God Bless
nagoya1
11 years ago
Elgin Mining Reports First Quarter 2014 Results
Date : 05/13/2014 @ 5:30PM
Source : Marketwired Canada
Stock : Elgin Mining (ELG)
Quote : 0.24 0.02 (9.09%) @ 3:59PM
Elgin Mining Reports First Quarter 2014 Results
Print
Alert
Elgin Mining Inc. ("Elgin Mining" or the "Company") (TSX:ELG) reports its
financial and operational results for the three months ended March 31, 2014.
Elgin Mining owns and operates the Bjorkdal gold mine ("Bjorkdal Mine") in
Sweden, and holds the past-producing Lupin gold mine ("Lupin") and the Ulu gold
property in Nunavut, Canada. All figures are in United States dollars(1) ($ or
USD) unless otherwise indicated.
A copy of the Company's financial statements and Management's Discussion and
Analysis can be viewed on the Company's website at www.elginmining.com or on
SEDAR at www.sedar.com.
First Quarter 2014 Financial Highlights
-- Gold production of 10,812 ounces which was ahead of plan for the
quarter;
-- Cash cost of $932 and all-in sustaining cost ("AISC") of $1,161 per gold
ounce sold;
-- Cash cost of $1,049 and AISC of $1,284 per gold ounce produced;
-- Cash flow from operating activities was $2.0 million, and increased to
$4.2 million when non-cash working capital movements are excluded; and
-- Cash improved by $0.1 million during the quarter after debt repayments
of $0.3 million.
First Quarter 2014 Operational Highlights
-- Underground ("UG") mine productivity continued to exceed early
expectations with the UG unit mining rate reaching close to 2,000 ore
tonnes per day. Lower UG head grades in the quarter were due to a three
week delay in mine sequencing to finalize a ventilation raise, with
higher planned grades expected for the remainder of the year;
-- Open Pit ("OP") head grades were above plan reflecting the benefits of
the mine's on-going grade control efforts;
-- Unit mining costs in both the UG and OP have trended significantly
downwards from elevated levels in 2013 due to the Company's continued
focus to reduce costs and optimize operational efficiencies. In the OP,
the mine has reverted to the previous lower-cost drill and blast
patterns for the full quarter, and in the UG, the transition from
contractor to owner-operated mining that commenced in Q4-2013 continues
to deliver a high-level of productivity, helping to drive down unit
costs;
-- Plant reached record daily throughput towards the end of the quarter
without any loss in the plant's metallurgical recovery rate, mainly due
to improvements in the flotation circuit;
-- Permit application to expand the plant's annual throughput limit from
1.3 million tonnes to 1.5 million tonnes remains on track with receipt
of the temporary expansion permit anticipated by the end of 2014; and
-- Completed a detailed structural and geological review of the deposit
which has led to the identification of several potential high-grade UG
targets at the Bjorkdal Mine which the Company will drill test in the
coming quarters.
(1) Effective January 1, 2014, the Company changed its presentation currency
from the Canadian dollar to the United States dollar to improve comparability of
its financial results with those of its gold mining peers and to allow easier
comparison of the Company's financial numbers to other measures that are quoted
in USD, including the price of gold and key performance indicators used within
the gold mining industry.
Re-affirmation of Bjorkdal Mine 2014 Guidance
The Bjorkdal Mine's first quarter gold production is traditionally the weakest
quarter of the year due to the cold weather impact on the plant's crushing and
milling circuits, and on labour and equipment productivity within the mines, in
addition to being the shortest quarter in the year. Despite these factors,
production is still ahead of target and was in fact the best Q1 since the
restart of mining operations in 2006.
The ongoing improvements have definitely taken hold and now that the UG mine
sequencing is back on track, second quarter gold production to May 12, 2014 (42
days out of the 91 days in the quarter) currently stands at 6,242 gold ounces
from the processing of an approximate equal mix of UG and OP ore feed. The
strong start to this quarter is attributable to higher UG grades as planned and
continued higher OP head grades which have put the Company on track year-to-date
to meet or exceed the higher end of production guidance for 2014.
The Company's full year 2014 guidance for gold production and unit cash cost is
as follows:
----------------------------------------------------------------------------
2014 Gold Production Guidance Production Low-end Production High-end
----------------------------------------------------------------------------
Gold production (ounces) 44,000 49,000
----------------------------------------------------------------------------
Cash cost per gold ounce produced
(USD/ounce) $982 $886
----------------------------------------------------------------------------
AISC per gold ounce produced
(USD/ounce) $1,227 $1,106
----------------------------------------------------------------------------
AISC per gold ounce produced
excluding non-cash accretion and
share-based payment expense
(USD/ounce) $1,207 $1,088
----------------------------------------------------------------------------
Sustaining capital (USD) $7.9 million $7.9 million
----------------------------------------------------------------------------
SEK per USD FX rate assumption 6.50 6.50
----------------------------------------------------------------------------
CAD per USD FX rate assumption 1.10 1.10
----------------------------------------------------------------------------
The above AISC guidance includes all capital expenditures (including capitalized
exploration) expected to be incurred at the Bjorkdal Mine for 2014, and all
general and administration costs incurred at the Company's corporate office in
Canada.
Management forecasts that full year gold production will be at the high end of
the range while AISC per gold ounce produced will be at the low-end of the range
provided.
Patrick Downey, President and CEO, commented, "We have had a good start to 2014
as our operational improvements have continued to provide increased productivity
and improved unit costs. The OP and UG operations are performing extremely well,
and we can expect to see greater UG productivity and lower unit costs as final
ramp-up is achieved later in 2014. These improvements have continued well into
Q2 where our grades to the mill have continued to ramp up and we expect to have
a very solid Q2 in terms of gold ounces produced, cash cost per ounce, and AISC
per ounce. There are now three expected quarters in a row where the mine and
overall operation have performed at or above plan. We are also now proceeding
with our 15% mill expansion to increase processing capacity from 1.3 million
tonnes to 1.5 million tonnes annually. This additional capacity should increase
overall gold production to 55,000 to 60,000 ounces per year with expected low
capital expenditures, mainly related to mill upgrades.
Following up on our successful exploration program during 2013, we have recently
completed a detailed structural and geological study of the ore body and have
now identified some very exciting targets which will be drilled tested in 2014
as part of our exploration budget."
First Quarter 2014 Financial and Operational Summaries
For the three For the three
months ended months ended
March 31, 2014 March 31, 2013
----------------------------------------------------------------------------
----------------------------------------------------------------------------
FINANCIAL DATA
Revenue $ 14,884,095 $ 16,601,659
Production costs, excluding depreciation and
depletion $ 10,535,150 $ 13,195,614
Income from mining operations $ 1,056,709 $ 951,485
Exploration expense $ 2,939 $ 122,882
Corporate administration $ 703,179 $ 1,293,904
Lupin care and maintenance $ 390,718 $ 2,485,195
Net loss $ (613,961) $ (3,569,845)
Net loss per share
- Basic $ (0.00) $ (0.02)
- Diluted $ (0.00) $ (0.02)
Cash flow provided by operating activities $ 2,006,167 $ (2,772,394)
Cash and cash equivalents $ 12,501,725 $ 10,861,475
Working capital $ 9,975,100 $ 16,212,713
Long-term debt, non-current $ 3,048,271 $ 612,470
Capital expenditures $ 1,808,910 $ 2,779,943
----------------------------------------------------------------------------
----------------------------------------------------------------------------
OPERATING DATA
Gold ounces produced 10,812 10,034
Gold ounces sold 11,136 10,644
Average realized gold price (USD per ounce) $ 1,384 $ 1,618
Cash cost per gold ounce sold (USD per
ounce) $ 932 $ 1,246
All-in sustaining cost per gold ounce sold
(USD per ounce) $ 1,161 $ 1,606
Cash cost per gold ounce produced (USD per
ounce) $ 1,049 $ 1,347
All-in sustaining cost per gold ounce
produced (USD per ounce) $ 1,284 $ 1,729
----------------------------------------------------------------------------
----------------------------------------------------------------------------
Conference Call Details
Elgin Mining will host a conference call on Wednesday, May 14th, 2014 at 2:00 pm
(Eastern Time).
Live Dial-In Information
Toronto and International: 416-695-7806 passcode: 7551641
North America (Toll Free): 866-696-5910 passcode: 7551641
Replay Call Information
Toronto and International: 905-694-9451 passcode: 9378295
North America (Toll Free): 800-408-3053 passcode: 9378295
The conference call replay will be available from 7 pm (Eastern Time) on May
14th, 2014, until 11:59 pm (Eastern Time) on May 28th, 2014.
Elgin Mining Inc.
Elgin Mining is a Canadian based company focused on production at the Bjorkdal
gold mine in Sweden. In addition, Elgin Mining's portfolio includes the Lupin
and Ulu gold projects located in Nunavut, Canada.
Cautionary Note Regarding Forward-Looking Information
This news release contains "forward-looking information" within the meaning of
Canadian securities legislation and "forward-looking statements" within the
meaning of the United States Private Securities Litigation Reform Act of 1995.
Except for statements of historical fact relating to the Company, information
contained herein constitutes forward-looking statements, including any
information as to the Company's strategy, plans or future financial or operating
performance. Forward-looking statements are characterized by words such as
"plan," "expect", "budget", "target", "project", "intend," "believe",
"anticipate", "estimate" and other similar words, or statements that certain
events or conditions "may" or "will" occur. Forward-looking statements are based
on the opinions, assumptions and estimates of management considered reasonable
at the date the statements are made, and are inherently subject to a variety of
risks and uncertainties and other known and unknown factors that could cause
actual events or results to differ materially from those projected in the
forward-looking statements.
These factors include risks relating to variations in the mineral content within
the material identified as mineral reserves and mineral resources from that
predicted, changes in development or mining plans due to changes in logistical,
technical or other factors, the impact of general business and economic
conditions, global liquidity and credit availability on the timing of cash flows
and the values of assets and liabilities based on projected future conditions,
fluctuating metal prices and currency exchange rates, possible variations in ore
grade or recovery rates, changes in accounting policies, changes in the
Company's corporate resources, changes in project parameters as plans continue
to be refined, changes in project development and production time frames, the
possibility of project cost overruns or unanticipated costs and expenses, higher
prices for fuel, steel, power, labour and other consumables contributing to
higher costs and general risks of the mining industry, failure of plant,
equipment or processes to operate as anticipated, unexpected changes in mine
life, unanticipated results of future studies, seasonality and unanticipated
weather changes, costs and timing of the development of new deposits, success of
exploration activities, successful completion of proposed acquisitions,
permitting time lines, government regulation of mining operations, environmental
risks, unanticipated reclamation expenses, title disputes or claims, limitations
on insurance coverage and timing and possible outcome of pending litigation and
labour disputes as well as those risk factors discussed or referred to in the
Company's Annual Information Form dated March 21, 2014, a copy of which is filed
on SEDAR at www.sedar.com. Although the Company has attempted to identify
important factors that could cause actual actions, events or results to differ
materially from those described in forward-looking statements, there may be
other factors that cause actions, events or results not to be anticipated,
estimated or intended.
There can be no assurance that forward-looking statements will prove to be
accurate, as actual results and future events could differ materially from those
anticipated in such statements. The Company undertakes no obligation to update
forward-looking statements if circumstances or management's estimates,
assumptions or opinions should change, except as required by applicable law. The
reader is cautioned not to place undue reliance on forward-looking statements.
The forward-looking information contained herein is presented for the purpose of
assisting investors in understanding the exploration and development plans and
objectives and may not be appropriate for other purposes.
FOR FURTHER INFORMATION PLEASE CONTACT:
Elgin Mining Inc.
Patrick Downey
President and Chief Executive Officer
(604) 682-3366
(604) 682-3363 (FAX)
info@elginmining.com
www.elginmining.com
nagoya1
11 years ago
Elgin Mining Provides Strong Fourth Quarter Cash Costs and Positive 2014 Outlook
Date : 03/03/2014 @ 10:14PM
Source : Marketwired
Stock : Elgin Mining (ELG)
Quote : 0.28 0.06 (27.27%) @ 3:59PM
Elgin Mining Provides Strong Fourth Quarter Cash Costs and Positive 2014 Outlook
Print
Alert
Elgin Mining (TSX:ELG)
Intraday Stock Chart
Today : Monday 3 March 2014
Click Here for more Elgin Mining Charts.
Elgin Mining Provides Strong Fourth Quarter Cash Costs and Positive 2014 Outlook
VANCOUVER, BRITISH COLUMBIA--(Marketwired - Mar 3, 2014) - Elgin Mining Inc. ("Elgin Mining" or the "Company") (TSX:ELG)(TSX:ELG.WT) released today its gold production and operating outlook for 2014. The Company expects to see a significant year-over-year improvement in the operating and cost performance of its Björkdal mine with gold production consistent with the previous year. At current gold prices above US$1,300 per ounce, the Company expects AISC* to be below $1100/oz boosting its cash and working capital, and reducing its current modest long-term debt, in 2014.
2014 Gold Production and Cost Guidance
2014 Forecast 2013 Actual(1) Q4-2013 Actual(1)
Gold production (ounces) 44,000 - 49,000 46,946 13,818
Cash cost per ounce produced (USD/ounce) $ 890 - $975 $ 1,095 $ 870
Plant throughput (tonnes) 1,300,000 1,261,368 314,975
Open pit 483,200 515,225 153,121
Underground 649,700 699,880 155,485
Stockpile 167,100 46,263 6,369
Plant head grade (Au grams per tonne) 1.21 - 1.33 1.32 1.55
Plant recovery rate (%) 87.7 % 87.7 % 88.0 %
Capital expenditures at Björkdal (USD) $ 7.9 million $ 14.1 million $ 2.1 million
Corporate general & admin costs(2) (USD) $ 1.9 million $ 4.0 million $ 1.0 million
Debt principal and interest payments (USD)(3) $ 1.6 million $ 1.0 million $ 0.4 million
SEK per USD exchange rate 6.50 6.51 6.51
CAD per USD exchange rate 1.10 1.03 1.05
Figures are unaudited and subject to final year-end adjustments.
Costs shown exclude non-cash stock-based compensation.
Cash amounts only as non-cash accretion of loan set-up charges are excluded.
* "All-in Sustaining Costs" as shown follow the published definition provided by the World Gold Council in June 2013 except for the exclusion of: (a) non-cash share-based remuneration and (b) accretion expense on the Björkdal mine's provision for closure and reclamation which is not significant.
Patrick Downey, the Company's President and Chief Executive Officer stated, "We had a very strong Q4-2014 at the Björkdal mine where the transition to owner-operated mining underground went much better than anticipated. Our costs per tonne mined decreased significantly and we also increased our mine head grade by better ore sequencing. Furthermore, we successfully completed the drill and blast changes in the open pit which led to better costs and more consistent grades from the pit. I am also pleased to state that we continue to see these improvements in the early part of 2014. For 2014, we remain steadfastly focused on executing the operational improvements that commenced in the last quarter of 2013. We expect the initiatives undertaken at the Björkdal mine in 2013 to gain further traction in 2014, allowing the Björkdal mine to continuously move down the industry cost curve. However, we are being reasonably conservative in our guidance for 2014 in terms of mill head grade and, should the mill feed grade continue at current levels, we should see better costs and production than current guidance. Furthermore, with the higher productivity we are seeing in the underground operations, we are planning to expand the Björkdal operations in both the underground and the plant. With this modest expansion, we expect production to ramp up to between 55,000 to 60,000 gold ounces per annum."
2014 Gold Production
Gold production is estimated to be in the range of 44,000 to 49,000 ounces for 2014. Plant throughput is expected to reach 1,300,000 tonnes with plant head grade between 1.21 to 1.33 grams per tonne ("gpt") from a mix of open pit (37%), underground (50%) and stockpile ore (13%).
In the open pit ("OP"), the Company expects to realize better grades in 2014 from the mining of higher grade benches and from the continuation of its stringent grade control practices. OP grades were negatively impacted in the first 8 months of 2013 by an unsuccessful drill and blast pattern change. This was rectified in Q3 which had a positive impact on grades and costs in Q4-2013. Based on the lower gold price environment in late Q4, the Company revised its open pit mine plan in order to mine less open pit tonnes. However, the Company has continued to see better grades from the open pit ore to date in 2014 and if gold price remains at or above US$1,300 per ounce, the Company may not reduce open pit tonnages below 2013 levels, and this adjustment would further boost 2014 guidance.
In the underground ("UG"), the Company transitioned from contractor to owner-operated mining starting in early Q4-2013. As stated, the transition has exceeded early expectations and has allowed the mine to improve its UG mine planning, pace of UG development, and grade control practices. To date this has resulted in lower costs per tonne and better mill feed grades. The ramp-up to owner-mining is still on-going with additional hiring of skilled UG miners and mechanics, and the cross-training of newly-hired and existing UG operators, all of which is expected to be completed in H1-2014. The Company anticipates that UG productivity and equipment utilization could exceed that forecasted in the latter half of 2014.
In the plant, the Company is planning for an expansion to increase its maximum annual plant throughput from 1.3 million tonnes to 1.5 million tonnes. Site management is currently working with local consultants in preparing the expansion application for submission before the end of Q2-2014. A response from the Swedish mining authorities on the expansion request is expected by the end of 2014. Based on its preliminary analysis, the Company does not expect the capital investment required to increase the plant's nameplate capacity to 1.5 million tonnes annually to be significant, allowing for a short pay-back and commissioning period.
The Company has not included the above-mentioned upside potential for its OP, UG and plant in its 2014 guidance.
Operating Costs
Cash cost per ounce for 2014 is expected to be between US$890 to US$975 per ounce, a significant improvement from the cash cost reported for 2013. Lower per ounce cash cost in 2014 will be achieved through a combination of lower per tonne mining costs in the OP and UG, and from potentially better OP and UG grades.
In the OP, mining cost per ore tonne will be lower in 2014 due to a decrease in the strip ratio in the 2014 OP mine plan and cost savings associated with returning to the previous drill and blast patterns. In addition, the higher predicted OP grades should lead to an improved per ounce cash cost.
In the UG, the transition to owner-operated mining commencing in Q4-2013 has led to savings in unit mining costs. As the ramp-up continues into 2014, the Company expects to realize a further reduction in unit mining costs from greater manpower productivity and equipment utilization. In addition, the Company is forecasting a smaller number of on-vein development metres in 2014 as the mine is no longer obliged to provide a minimum number of payable metres to the UG contractor. For 2014, the Company is budgeting for a greater proportion of stope tonnes, which are cheaper to mine, in its UG ore feed. Specifically, the planned 2014 UG ore feed is estimated to consist of 51% development tonnes (2013 - 59%) and 49% stope tonnes (2013 - 41%) due to fewer on-vein development metres and the mining of more stope tonnes. Beyond the operating costs included in the Company's per ounce cash cost calculation, the Company is not subject to any royalties or mining taxes on its gold sales, and enjoys a low corporate income tax rate of 22% on its net income earned in Sweden with no withholding taxes on any future repatriation of funds.
Capital Budget
Capital expenditures at the Björkdal mine are budgeted at US$7.9 million for 2014 and consist of:
Area of Operations 2014 Budgeted Expenditures Capital Spending
Underground US$5.4 million UG capital development (US$3.5 million); UG capitalized diamond drilling (5,000 metres) and in-fill drilling (3,000 metres) programs (US$1.0 million) and other UG sustaining capex (US$0.9 million)
Open Pit US$1.6 million Capitalized OP waste pushback and till removal (US$1.6 million)
Processing US$0.8 million Tailings (US$0.7 million) and concentrator (US$0.1 million)
Administration US$0.1 million Miscellaneous
Total US$7.9 million
No other capital expenditures are budgeted for in 2014.
Regional Exploration
The Company expects to incur a small amount of regional exploration costs in drill testing prospective brownfield targets near its Björkdal mine.
General and Administration
The Company is budgeting corporate general and administration costs (cash component) of US$1.9 million for 2014, a reduction of over 50% from costs incurred in the previous year, as the Company remains focussed on eliminating non-essential expenditures. The substantial cost decrease from the prior year is primarily the result of staff reductions and non-recurring severance charges undertaken in 2013 in response to the drop in the price of gold and the placement of the Lupin gold project back into care and maintenance.
Liquidity
Despite lower gold prices in Q4-2013, and certain non-recurring severance expenses, the Company was able to add to its cash position, ending the year with CAD 13.3 million (unaudited), an increase of CAD 0.3 million from its September 30, 2013 cash balance of CAD 13.0 million.
Elgin Mining Inc.
Elgin Mining is a Canadian based company focused on production at the Björkdal gold mine in Sweden. In addition, Elgin Mining's portfolio includes the Lupin and Ulu gold projects located in Nunavut, Canada.
For further information, please visit the Company's web site at www.elginmining.com.


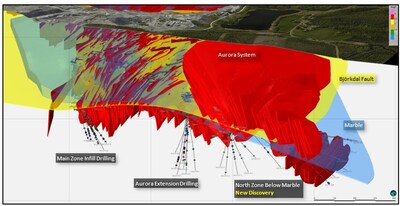


 Hot Features