BlackRock Grtr Eur Portfolio Update
January 16 2019 - 4:11AM
UK Regulatory
TIDMBRGE

BLACKROCK GREATER EUROPE INVESTMENT TRUST plc (LEI - 5493003R8FJ6I76ZUW55)
All information is at 31 December 2018 and unaudited.

Performance at month end with net income reinvested


                                        One     Three       One     Three        Launch
                                      Month    Months      Year     Years   (20 Sep 04)

Net asset value (undiluted)           -5.8%    -14.2%     -5.6%     29.5%        319.6%

Net asset value* (diluted)            -5.8%    -14.2%     -5.6%     30.7%        320.0%

Share price                           -5.7%    -13.3%     -7.6%     25.1%        303.6%

FTSE World Europe ex UK               -4.6%    -10.9%     -9.5%     27.4%        211.9%

* Diluted for treasury shares and subscription shares.
Sources: BlackRock and Datastream


At month end

Net asset value (capital only):                                                 321.78p

Net asset value (including income):                                             322.20p

Net asset value (capital only)1:                                                321.78p

Net asset value (including income)1:                                            322.20p

Share price:                                                                    307.00p

Discount to NAV (including income):                                                4.7%

Discount to NAV (including income)1:                                               4.7%

Net cash:                                                                          3.0%

Net yield2:                                                                        1.9%

Total assets (including income):                                                GBP275.1m

Ordinary shares in issue3:                                                   85,373,101

Ongoing charges4:                                                                 1.09%

1  Diluted for treasury shares.
2  Based on a final dividend of 4.00p per share and an interim dividend of
1.75p per share for the year ended 31 August 2018.
3  Excluding 24,955,837 shares held in treasury.
4  Calculated as a percentage of average net assets and using expenses,
excluding interest costs, after relief for taxation, for the year ended
31 August 2018.

Sector Analysis                 Total     Country Analysis             Total
                               Assets                                 Assets
                                   (%)                                    (%)

Industrials                       29.7    Switzerland                    18.2

Health Care                       23.6    France                         15.7

Technology                        11.8    Germany                        11.9

Financials                        11.6    Denmark                        11.7

Consumer Goods                     9.8    Netherlands                     8.7

Consumer Services                  5.2    Italy                           6.0

Basic Materials                    3.5    United Kingdom                  4.2

Telecommunications                 1.8    Sweden                          3.8

Net Current Assets                 3.0    Israel                          3.5

                                 -----    Russia                          3.1

                                 100.0    Finland                         2.5

                                          Ireland                         2.4

                                          Spain                           2.4

                                          Belgium                         1.9

                                          Greece                          1.0

                                          Net Current Assets              3.0

                                                                        -----

                                                                        100.0

                                                                        =====


Ten Largest Equity Investments

Company                                           Country                          % of
                                                                           Total Assets

Safran                                            France                            6.8

Lonza Group                                       Switzerland                       6.7

Novo Nordisk                                      Denmark                           6.2

SAP                                               Germany                           5.8

Sika                                              Switzerland                       4.9

RELX                                              United Kingdom                    4.2

Unilever                                          Netherlands                       3.8

Thales                                            France                            3.3

Sberbank                                          Russia                            3.1

ASML                                              Netherlands                       3.1

Commenting on the markets, Stefan Gries, representing the Investment Manager
noted:

During the month, the Company's NAV and share price fell by 5.8% and 5.7%
respectively. For reference, the FTSE World Europe ex UK Index returned -4.6%
during the period.

European ex UK markets fell sharply in December as concerns around global
growth and political agendas plagued the market. Across the market index, all
sectors produced a negative performance except utilities which was buoyed by
capital flow into perceived defensive assets, those with less exposure to the
economic cycle.

The Eurozone December flash Purchasing Manager Index was lower than expected,
partially dragged down by the collapse in industrial production in Germany as a
result of poor auto production in recent months due to emissions regulations.
Political tension in France, and indeed globally from the continued trade war
rhetoric, weighed on both business and consumer confidence.

Whilst inflation remains at bay, The European Central Bank confirmed to end its
net asset purchases in December, and clarified that it will continue with
reinvestments until at least after its first interest rate hike.

Stock selection was the main driver of the Company's underperformance over the
month versus the reference index. Sector allocation was broadly neutral. Whilst
the lower allocation to the utilities sector was a drag on returns, the
Company's lower weighting towards financials was beneficial.

The largest detractor over the month was a position in Lonza, which fell
sharply ahead of its 2019 guidance due at the end of January. Investors appear
nervous that there will be a repeat of last year's experience in which guidance
disappointed and the shares sold off aggressively. At the same time, new
accounting methodology and the disposal of its Water Care business are both
leading to further uncertainty. We were conscious of the potential for small
downgrades going into the event, but believe the long-term structural growth of
the company remains robust.

The Company also experienced a loss in health care position Fresenius Medical
Care. The company released an ad hoc guidance update for 2019 which was viewed
negatively by the market. While there are many moving parts, we believe the
long-term investment case is intact and see good value in the shares at this
price.

A number of other positions which are mid-cap and exhibit a richer valuation,
but do offer, we believe, strong potential growth in earnings, also suffered
underperformance. This included positions in Ferrari and LVMH.

Positively, a holding in Novo Nordisk aided returns as trials for
cardiovascular outcomes on their oral semaglutide drug were favourable. This
should allow the company to apply to the Food and Drug Administration for a
cardiovascular label for their existing injectable drug, which could prove a
boost to sales in the future.

At the end of the period, the Company had a higher allocation than the
reference index towards industrials, technology, consumer services and health
care. A lower allocation was held in financials, consumer goods, utilities,
telecommunications, basic materials and oil & gas.

Outlook

The range of potential economic outcomes is widening. Whilst stimulus has
helped to push US growth ahead, pockets of slower growth are appearing across
regions and industries. Overall, as with the onset of this year, we think
global growth will become more moderate, but do not yet believe we are moving
towards a recessionary environment, either in Europe or globally. In saying
this, we are increasingly sceptical of the situation in Italy and believe there
is greater downside risk emanating from this region. Increased risks of
contagion may dampen our view on European fundamentals. At present, however, we
continue to see a relatively robust environment for the consumer, who is
enjoying wage increases but a low level of inflation, as well as strength in
certain industries such as construction, where order books are improving.
Following the market re-set, valuation risk also appears less extended and
intra-market positioning less extreme. As the economic situation unfolds in the
global arena and fixed income markets potentially stabilise, there may be
opportunities to add to attractively valued companies which are exhibiting
strong earnings power. In the near-term, we have moved our portfolio to be more
defensive at the margin acknowledging potential risks on the horizon.

16 January 2019S

Latest information is available by typing www.brgeplc.co.uk on the internet,
"BLRKINDEX" on Reuters, "BLRK" on Bloomberg or "8800" on Topic 3 (ICV
terminal).  Neither the contents of the Manager's website nor the contents of
any website accessible from hyperlinks on the Manager's website (or any other
website) is incorporated into, or forms part of, this announcement.
END
(END) Dow Jones Newswires
January 16, 2019 05:11 ET (10:11 GMT)
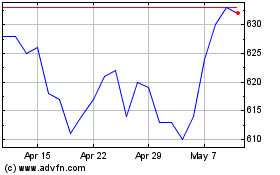
Blackrock Greater Europe... (LSE:BRGE)
Historical Stock Chart
From Mar 2024 to Apr 2024

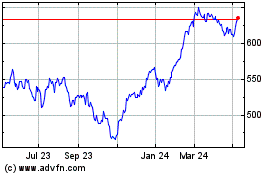
Blackrock Greater Europe... (LSE:BRGE)
Historical Stock Chart
From Apr 2023 to Apr 2024
