SUI Ready To Test $2 Resistance – Bullish Pattern Suggests New ATH Soon
September 29 2024 - 11:30AM
NEWSBTC
SUI is currently testing crucial supply levels after an impressive
75% surge from local demand around $1 since mid-September. This
aggressive price movement has placed the layer-1 blockchain at the
forefront of market discussions, making it one of the most trending
assets right now. Related Reading: Dogecoin Could Target
$0.20 Soon, Analyst Predicts – Is DOGE Primed For A Rally? Traders
and investors are showing increased interest in SUI, with many
speculating that this rally could be the beginning of even bigger
gains in the coming months. The buzz around SUI has been amplified
by its strong price action, and bullish sentiment is growing.
Analysts are closely watching the price action, with some
predicting that SUI could target significantly higher levels,
potentially challenging its all-time highs around $2.20 in the near
future. Such a move would solidify SUI’s position as a
top-performing asset in the crypto market and could attract even
more capital as the market looks for the next big
opportunity. As SUI continues to gain traction, all eyes are
on its ability to sustain this momentum and break through key
resistance levels, setting the stage for a potential rally to new
highs. With optimism building, SUI is one to watch as the market
anticipates its next move. SUI Bullish Pattern ‘Still Playing Out’
SUI has emerged as one of the top-performing assets over the past
two weeks, fueled by optimism following the Federal Reserve’s
interest rate cuts announcement. Analysts and investors are eagerly
watching the altcoin, hoping that the recent surge isn’t just a
bull trap but the beginning of a massive rally poised to explode.
Renowned crypto trader and analyst, Kong Trading, recently shared
his technical analysis on X, highlighting the potential for a
significant SUI surge in the coming months. He noted that the
inverted head and shoulders pattern formed in the past months is
still playing out nicely and could be a powerful signal for further
gains. According to his analysis, the key level to watch is
$2. If SUI manages to break past this resistance, it could trigger
a wave of FOMO (fear of missing out) among traders, propelling the
price to unprecedented heights. However, Kong Trading also
cautioned that SUI’s bullish momentum depends heavily on broader
market conditions and macroeconomic trends. While the current setup
is promising, the asset remains vulnerable to sudden shifts in
sentiment or adverse market developments. Related Reading:
XRP Struggles Below $0.60 – Metrics Reveal Growing Selling Pressure
As SUI approaches its all-time highs, the coming weeks will be
crucial in determining whether it can sustain its upward trajectory
or if it will face a potential pullback. For now, all eyes are on
SUI as it navigates these critical price levels, with traders
hoping to see a breakout that could redefine its market position.
Key Levels To Watch SUI is currently trading at $1.67 after an
impressive 140% rally from its early September lows of $0.75. This
significant price movement has brought SUI to a crucial supply
zone, where the price could face resistance and potentially enter a
consolidation phase. Analysts and traders are closely watching this
level, as breaking above it could set the stage for further gains.
If SUI manages to break past the $1.82 resistance, it would open
the door for a rally toward its all-time high of $2.18. This level
will be a major target for bulls, as reclaiming it could signal the
continuation of a broader uptrend and attract more buyers into the
market. However, a failure to break above $1.80 could see the price
retracing to lower demand levels around $1.45, which served as a
key resistance back in April. Related Reading: Solana (SOL)
Consolidates in Symmetrical Triangle – Analyst Reveals $160 Target
On Breakout This $1.45 zone is now expected to act as strong
support, offering a potential buy opportunity for traders looking
to enter the market at a lower price. For now, SUI remains in a
critical zone, and its next move will likely determine whether the
current rally can extend toward new highs or if a consolidation
phase is ahead. Featured image from Dall-E, chart from TradingView
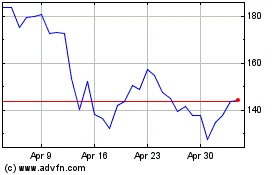
Solana (COIN:SOLUSD)
Historical Stock Chart
From Oct 2024 to Oct 2024

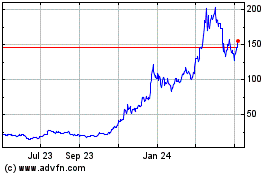
Solana (COIN:SOLUSD)
Historical Stock Chart
From Oct 2023 to Oct 2024
