UNITED STATES
SECURITIES AND EXCHANGE COMMISSION
Washington, D.C. 20549
FORM 8-K
CURRENT REPORT
Pursuant to Section 13 or 15(d) of the Securities
Exchange Act of 1934
Date of Report (Date of earliest event reported): October
29, 2015
|
Commission File
Number |
Registrant; State of Incorporation;
Address and Telephone Number |
IRS Employer
Identification No. |
| |
|
|
| 1-11459 |
PPL Corporation
(Exact name of Registrant as specified in its charter)
(Pennsylvania)
Two North Ninth Street
Allentown, PA 18101-1179
(610) 774-5151 |
23-2758192 |
| |
|
|
Check the appropriate box below if the Form 8-K filing is intended
to simultaneously satisfy the filing obligation of the registrant under any of the following provisions:
| [ ] |
|
Written communications pursuant to Rule 425 under the Securities Act (17 CFR 230.425) |
| [ ] |
|
Soliciting material pursuant to Rule 14a-12 under the Exchange Act (17 CFR 240.14a-12) |
| [ ] |
|
Pre-commencement communications pursuant to Rule 14d-2(b) under the Exchange Act (17 CFR 240.14d-2(b)) |
| [ ] |
|
Pre-commencement communications pursuant to Rule 13e-4(c) under the Exchange Act (17 CFR 240.13e-4(c)) |
Section 2 - Financial Information
Item 2.02 Results of Operations and Financial Condition
On October 29, 2015, PPL Corporation ("PPL") issued
a press release announcing its financial results for the quarter ended September 30, 2015 and other business matters. A
copy of the press release is furnished as Exhibit 99.1.
Section 7 - Regulation FD
Item 7.01 Regulation FD Disclosure
On October 29, 2015, at 8:30 a.m. (Eastern Time), members of
PPL's senior management will hold a teleconference and webcast with financial analysts to discuss PPL's financial results for the
quarter ended September 30, 2015 and other business matters. A copy of the slides to be used during the webcast is furnished
as Exhibit 99.2. The event will be available live, in audio format, along with the slides, on PPL's Internet Web site: www.pplweb.com. The
webcast will be available for replay on PPL's Web site for 30 days.
Section 9 - Financial Statements and Exhibits
Item 9.01 Financial Statements and Exhibits
| |
(d) |
|
Exhibits |
|
| |
|
|
|
|
| |
|
|
99.1 - |
Press Release, dated October 29, 2015, announcing PPL's financial results for the quarter ended September 30, 2015, and other business matters |
| |
|
|
|
|
| |
|
|
99.2 - |
Slides to be used on the October 29, 2015 webcast among members of PPL's senior management and financial analysts. |
SIGNATURE
Pursuant to the requirements of the Securities Exchange Act
of 1934, the Registrant has duly caused this report to be signed on its behalf by the undersigned hereunto duly authorized.
| |
PPL CORPORATION |
| |
|
|
|
| |
By: |
/s/ Stephen K. Breininger |
|
| |
|
Stephen K. Breininger
Vice President and Controller |
|
Dated: October 29, 2015
Exhibit 99.1
Contacts: For
news media – Ryan Hill, 610-774-5997
For financial
analysts – Joseph P. Bergstein, 610-774-5609
PPL
Corporation Reports Third-Quarter Earnings
| · | Per-share
earnings from ongoing operations increased by 16 percent in third quarter 2015 compared
to 2014. |
| · | Per-share
earnings from ongoing operations for first nine months of 2015 increased
15 percent, 17 percent for
U.S.-based operations and 14 percent for U.K. operations compared to 2014. |
| · | Company
now expects compound annual growth of 6 percent in per-share earnings through 2017 and reaffirms 2015 earnings guidance range of $2.15 to $2.25 per share.
|
ALLENTOWN,
Pa. (Oct. 29, 2015) – PPL Corporation on Thursday (10/29) announced third-quarter 2015 reported earnings
of $393 million, or $0.58 per share, a decrease from $497 million, or $0.74 per share, a year ago.
For the first
nine months of 2015, PPL’s reported earnings were $283 million, or $0.42 per share, compared with $1.04 billion, or $1.57
per share, in the first nine months of 2014. The company’s results for the first nine months of 2015 reflect a loss from
discontinued operations of $915 million, or $1.36 per share, resulting primarily from the June 1 spinoff of its competitive Supply
business.
Adjusting for
special items, third-quarter 2015 earnings from ongoing operations were $347 million, or $0.51 per share, compared with $297 million
in earnings from ongoing operations (adjusted), or $0.44 per share, in the third quarter of 2014. This represents a 16 percent
increase on a per-share basis.
Adjusting for
special items, including results from the discontinued operations of the Supply segment, earnings from ongoing operations for
the first nine months of 2015 were $1.20 billion, or $1.77 per share. This compares to earnings from ongoing operations (adjusted)
of $1.02 billion, or $1.54 per share, in the first nine months of 2014, representing a 15 percent increase on a per-share basis.
“Backed
by the strong performance of our fully regulated portfolio, we’re well-positioned once again this year to extend PPL’s
proven track record of meeting or exceeding earnings expectations and delivering on our growth commitment to shareowners,”
said William H. Spence, PPL chairman, president and Chief Executive Officer.
Spence reaffirmed
the company’s 2015 forecast range for earnings from ongoing operations of $2.15 to $2.25 per share. The 2015 forecast for
reported earnings is $0.80 to $0.90 per share, reflecting special items recorded through the third quarter.
“Based
on higher than expected earnings from the company’s regulated operations in the United Kingdom and our low-risk business
plans, we are now confident we can achieve 6 percent compound annual earnings growth through 2017,” Spence said. The projection
is based on 2014 adjusted earnings from ongoing operations of $2.03 per share. The company had previously projected 4 percent
to 6 percent growth.
PPL’s
projected earnings growth is driven by more than $3 billion a year in investments to expand, rebuild and modernize infrastructure
to improve service to 10 million utility customers in the U.S. and U.K.
Earnings
from PPL’s U.S.-based operations, including its corporate services organization, are expected to grow 12 to 14 percent through
2017, with 1 to 2 percent earnings growth expected in the U.K. Regulated segment.
Third-Quarter
and Year-to-Date 2015 Earnings Details
PPL’s
reported earnings for the third quarter of 2015 included net special item after-tax credits of $46 million, or $0.07 per share,
resulting primarily from foreign currency-related economic hedges.
Reported earnings
for the third quarter of 2014 included net special item after-tax credits of $181 million, or $0.27 per share, resulting primarily
from foreign currency-related economic hedges and discontinued operations associated with the spinoff of the Supply segment.
Reported earnings
are calculated in accordance with U.S. GAAP. “Earnings from ongoing operations” is a non-GAAP financial measure that
is adjusted for special items, including the Supply segment’s earnings and the loss from discontinued operations associated
with the spinoff of the Supply segment. In addition, 2014 has been adjusted to reflect the impact of dissynergies related to the
spinoff of the Supply segment. Special items and the dissynergies are fully detailed at the end of the news release.
| (Dollars in millions,
except for per share amounts) |
|
3rd
Quarter |
|
|
|
|
Year
to Date |
|
|
| |
|
2015 |
|
2014 |
|
%
Change |
|
|
2015 |
|
2014 |
|
%
Change |
| |
|
|
|
|
|
|
|
|
|
|
|
|
|
|
|
|
|
|
|
|
| Reported earnings |
|
$ |
393 |
|
|
$ |
497 |
|
|
(21% |
) |
|
$ |
283 |
|
|
$ |
1,042 |
|
|
(73%) |
| Reported earnings per share |
|
$ |
0.58 |
|
|
$ |
0.74 |
|
|
(22% |
) |
|
$ |
0.42 |
|
|
$ |
1.57 |
|
|
(73%) |
| |
|
|
|
|
|
|
|
|
|
|
|
|
|
|
|
|
|
|
|
|
|
| |
|
3rd
Quarter |
|
|
|
|
Year
to Date |
|
|
| |
|
2015 |
|
2014
(adjusted) |
|
%
Change |
|
|
2015 |
|
2014
(adjusted) |
|
%
Change |
| Earnings from ongoing operations |
|
$ |
347 |
|
|
$ |
297 |
|
|
17% |
|
|
$ |
1,195 |
|
|
$ |
1,019 |
|
|
17% |
Earnings from ongoing operations
per share |
|
$ |
0.51 |
|
|
$ |
0.44 |
|
|
16% |
|
|
$ |
1.77 |
|
|
$ |
1.54 |
|
|
15% |
| |
|
|
|
|
|
|
|
|
|
|
|
|
|
|
|
|
|
|
|
|
|
|
|
|
|
(See the tables at the end of
this news release for a reconciliation of reported earnings (loss) to earnings from ongoing operations.)
Third-Quarter
and Year-to-Date Earnings by Segment
| |
|
3rd
Quarter |
|
Year
to Date |
| Per share |
|
2015 |
|
2014
(adjusted) |
|
2015 |
|
2014
(adjusted) |
| Earnings from ongoing operations |
|
|
|
|
|
|
|
|
|
|
|
|
|
|
|
|
| U.K. Regulated |
|
$ |
0.29 |
|
|
$ |
0.28 |
|
|
$ |
1.15 |
|
|
$ |
1.01 |
|
| Kentucky Regulated |
|
|
0.16 |
|
|
|
0.12 |
|
|
|
0.42 |
|
|
|
0.37 |
|
| Pennsylvania Regulated |
|
|
0.08 |
|
|
|
0.08 |
|
|
|
0.28 |
|
|
|
0.29 |
|
| Corporate and Other1 |
|
|
(0.02 |
) |
|
|
(0.04 |
) |
|
|
(0.08 |
) |
|
|
(0.13 |
) |
| Total |
|
$ |
0.51 |
|
|
$ |
0.44 |
|
|
$ |
1.77 |
|
|
$ |
1.54 |
|
| |
|
|
|
|
|
|
|
|
|
|
|
|
|
|
|
|
| |
|
3rd
Quarter |
|
Year
to Date |
| Special items and dissynergy adjustments |
|
|
2015 |
|
|
|
2014
(adjusted) |
|
|
|
2015 |
|
|
|
2014
(adjusted) |
|
| Special items (expense) benefit |
|
|
|
|
|
|
|
|
|
|
|
|
|
|
|
|
| U.K. Regulated |
|
$ |
0.08 |
|
|
$ |
0.16
|
|
|
$ |
0.06 |
|
|
$ |
0.03
|
|
| Kentucky Regulated
|
|
|
–
|
|
|
|
– |
|
|
|
(0.02 |
) |
|
|
– |
|
| Pennsylvania
Regulated |
|
|
– |
|
|
|
0.01 |
|
|
|
– |
|
|
|
– |
|
| Corporate and Other1 |
|
|
– |
|
|
|
(0.03 |
) |
|
|
(0.03 |
) |
|
|
(0.11 |
) |
| Supply/Discontinued Operations |
|
|
(0.01 |
) |
|
|
0.13 |
|
|
|
(1.36 |
) |
|
|
0.02 |
|
| Total special items |
|
|
0.07 |
|
|
|
0.27
|
|
|
|
(1.35 |
) |
|
|
(0.06 |
) |
| Dissynergy adjustments expense (benefit) |
|
|
|
|
|
|
|
|
|
|
|
|
|
|
|
|
| Corporate and Other1 |
|
|
– |
|
|
|
0.03 |
|
|
|
– |
|
|
|
0.09 |
|
Total special items
and dissynergy
adjustments |
|
$ |
0.07 |
|
|
$ |
0.30 |
|
|
$ |
(1.35 |
) |
|
$ |
0.03 |
|
| |
|
|
|
|
|
|
|
|
|
|
|
|
|
|
|
|
| |
|
3rd
Quarter |
|
Year
to Date |
| Reported earnings (loss) |
|
|
2015 |
|
|
|
2014 |
|
|
|
2015 |
|
|
|
2014 |
|
| U.K. Regulated |
|
$ |
0.37 |
|
|
$ |
0.44 |
|
|
$ |
1.21 |
|
|
$ |
1.04 |
|
| Kentucky Regulated |
|
|
0.16 |
|
|
|
0.12 |
|
|
|
0.40 |
|
|
|
0.37 |
|
| Pennsylvania Regulated |
|
|
0.08 |
|
|
|
0.09 |
|
|
|
0.28 |
|
|
|
0.29 |
|
| Corporate and Other1 |
|
|
(0.02 |
) |
|
|
(0.04 |
) |
|
|
(0.11 |
) |
|
|
(0.15 |
) |
| Supply/Discontinued Operations2 |
|
|
(0.01 |
) |
|
|
0.13 |
|
|
|
(1.36 |
) |
|
|
0.02 |
|
| Total |
|
$ |
0.58 |
|
|
$ |
0.74 |
|
|
$ |
0.42 |
|
|
$ |
1.57 |
|
1This category primarily
includes unallocated corporate-level financing and other costs. For 2014, earnings from ongoing operations (adjusted) and special
items and dissynergy adjustments reflect the impact of dissynergies related to the spinoff of the Supply segment: Indirect O&M
($0.02 in the 3rd quarter and $0.05 YTD), Interest ($0.01 in the 3rd quarter and $0.03 YTD), and Depreciation
($0.01 YTD).
22015 reported earnings
includes five months of Supply segment earnings and an $879 million loss reflecting the difference between PPL’s recorded
value for the Supply segment and the estimated fair value, a difference determined by PPL in conjunction with its accounting for
the spinoff.
(See the reconciliation
tables at the end of this news release for an itemization of special items and dissynergy adjustments.)
Key Factors
Impacting Earnings from Ongoing Operations
U.K. Regulated Segment
PPL’s
U.K. Regulated segment primarily consists of the regulated electricity delivery operations of Western Power Distribution (WPD),
serving Southwest and Central England and South Wales.
Earnings from
ongoing operations in the third quarter of 2015 increased by $0.01 per share compared with a year ago. This increase was primarily
due to lower income taxes and lower depreciation expense, partially offset by lower utility revenues primarily driven by an April
1, 2015 price decrease due to the beginning of a new eight-year price control period (RIIO-ED1).
Earnings from
ongoing operations during the first nine months of 2015 increased by $0.14 per share compared with a year ago. This increase was
primarily due to lower income taxes, lower depreciation expense and higher utility revenue driven by an April 1, 2014 price increase,
which was partially offset by lower prices driven by an April 1, 2015 price decrease due to the commencement of RIIO-ED1.
Kentucky Regulated Segment
PPL’s
Kentucky Regulated segment primarily consists of the regulated electricity and natural gas operations of Louisville Gas and Electric
Company and the regulated electricity operations of Kentucky Utilities Company.
Earnings from
ongoing operations in the third quarter of 2015 increased by $0.04 per share compared with a year ago. This increase was primarily
due to higher returns on additional environmental capital investments and higher base electricity rates effective July 1, 2015,
partially offset by higher operation and maintenance expense.
Earnings from
ongoing operations during the first nine months of 2015 increased by $0.05 per share compared with a year ago. This was primarily
due to higher returns on additional environmental capital investments and higher base electricity rates effective July 1, 2015,
partially offset by higher operation and maintenance expense, including costs associated with the retirement of coal-fired generation
at the Cane Run facility.
Pennsylvania Regulated Segment
PPL’s
Pennsylvania Regulated segment consists of the regulated electricity delivery operations of PPL Electric Utilities. Earnings from
ongoing operations in the third quarter of 2015 were the same as a year ago.
Earnings from
ongoing operations during the first nine months of 2015 decreased by $0.01 per share compared with a year ago, driven primarily
by higher depreciation expense, higher operation and maintenance expense and higher income tax expense, partially offset by higher
transmission and distribution margins.
Corporate and Other
PPL’s
Corporate and Other category primarily includes unallocated corporate-level financing and other costs.
Corporate and
Other improved by $0.02 per share in the third quarter of 2015 compared to the third quarter of 2014 (adjusted), and by $0.05
per share for the first nine months of 2015 compared to a year ago. This was primarily due to the benefits of the corporate restructuring.
Forecast
of Earnings from Ongoing Operations
| |
2015
forecast
midpoint |
|
2014
earnings
from ongoing operations (adjusted) |
| Per share |
|
|
|
|
|
| U.K. Regulated |
$ 1.43 |
|
|
$ 1.37 |
|
| Kentucky Regulated |
0.51 |
|
|
0.47 |
|
| Pennsylvania Regulated |
0.37 |
|
|
0.40 |
|
| Corporate and Other1 |
(0.11 |
) |
|
(0.21 |
) |
| Total |
$
2.20 |
|
|
$
2.03 |
|
1 This category primarily
includes unallocated corporate-level financing and other costs. For 2014, earnings from ongoing operations (adjusted) reflect
the full impact of dissynergies related to the spinoff of the Supply segment: Indirect O&M ($0.07), Interest ($0.05) and Depreciation
($0.01).
See the tables at the end of
this news release for a reconciliation of reported earnings to 2014 earnings from ongoing operations (adjusted).
The midpoint
of PPL’s 2015 forecast earnings from ongoing operations of $2.20 per share represents an increase of 8.4 percent compared
to 2014 earnings from ongoing operations (adjusted). This increase is primarily attributable to increases in the U.K. Regulated
and Kentucky Regulated segments and lower Corporate and Other charges as detailed below.
U.K. Regulated Segment
PPL projects
higher segment earnings in 2015 compared with 2014, primarily driven by lower income taxes and lower depreciation expense, partially
offset by lower utility revenue from a price decrease due to the commencement of RIIO-ED1 effective April 1, 2015. The remaining
2015 foreign currency earnings exposure for this segment is fully hedged at an average rate of $1.54 per pound.
Kentucky Regulated Segment
PPL projects
higher segment earnings in 2015 compared with 2014, primarily driven by electric and gas base rate increases effective July 1,
2015, and returns on additional environmental capital investments, partially offset by higher operation and maintenance expense,
higher depreciation and higher financing costs.
Pennsylvania Regulated Segment
PPL projects
lower segment earnings in 2015 compared with 2014, primarily driven by higher operation and maintenance expense and higher depreciation
expense, partially offset by higher transmission and distribution margins.
Corporate and Other
PPL projects
lower costs in this category in 2015 compared with 2014, primarily driven by cost reductions resulting from corporate restructuring
efforts and lower income taxes.
Headquartered
in Allentown, Pa., PPL Corporation (NYSE: PPL) is one of the largest companies in the U.S. utility sector. PPL’s seven high-performing,
award-winning utilities serve 10 million customers in the U.S. and United Kingdom. The company and its 13,000 employees are dedicated
to providing exceptional customer service and reliability and delivering superior value for shareowners. To learn more, visit
www.pplweb.com.
# # #
(Note: All references to earnings
per share in the text and tables of this news release are stated in terms of diluted earnings per share unless otherwise noted.)
Conference Call and Webcast
PPL invites interested parties
to listen to a live Internet webcast of management’s teleconference with financial analysts about third-quarter 2015 financial
results at 8:30 a.m. Eastern Standard time on Thursday, Oct. 29. The call will be webcast live, in audio format, along with slides
of the presentation. For those who are unable to listen to the live webcast, a replay with slides will be accessible at www.pplweb.com/investors
for 30 days after the call. Interested individuals can access the live conference call via telephone at 1-888-317-6003. International
participants should call 1-412-317-6061. Participants in Canada should call 1-866-284-3684. Participants will need to enter the
following “Elite Entry” number in order to join the conference: 8202071.
# # #
“Earnings
from ongoing operations,” should not be considered as an alternative to reported earnings, or net income, which is an indicator
of operating performance determined in accordance with U.S. generally accepted accounting principles (GAAP). PPL believes that
“earnings from ongoing operations,” although a non-GAAP financial measure, is also useful and meaningful to investors
because it provides management’s view of PPL’s earnings excluding the Supply segment, as the spinoff was completed
June 1, 2015. Other companies may use different measures to present financial performance. “Earnings from ongoing operations”
is adjusted for the impact of special items as described below, which includes the Supply segment’s earnings now reflected
in discontinued operations. Also included in special items is the loss on spinoff resulting from the fair value of the Supply
segment being less than PPL’s recorded value as of June 1, 2015, the date of the spinoff. “Earnings from ongoing operations
(adjusted)” for 2014 also reflects, within the Corporate and Other category, the impact of spinoff dissynergies that would
remain with PPL after the completion of the transaction, if left unmitigated.
“Earnings from ongoing
operations” is adjusted for the impact of special items. Special items include:
| • | Unrealized
gains or losses on foreign currency-related economic hedges. |
| • | Supply
segment discontinued operations. |
| • | Loss
on the spinoff of the Supply segment. |
| • | Gains
and losses on sales of assets not in the ordinary course of business. |
| • | Workforce
reduction and other restructuring effects. |
| • | Acquisition
and divestiture-related adjustments. |
| • | Other
charges or credits that are, in management’s view, not reflective of the company’s
ongoing operations. |
Statements contained in this
news release, including statements with respect to future earnings, cash flows, financing, regulation and corporate strategy,
are “forward-looking statements” within the meaning of the federal securities laws. Although PPL Corporation believes
that the expectations and assumptions reflected in these forward-looking statements are reasonable, these statements are subject
to a number of risks and uncertainties, and actual results may differ materially from the results discussed in the statements.
The following are among the important factors that could cause actual results to differ materially from the forward-looking statements:
market demand for energy in our service territories; weather conditions affecting customer energy usage and operating costs; the
effect of any business or industry restructuring, including the ability of PPL Corporation to realize all or a
significant portion of the anticipated
cost savings from the corporate restructuring efforts following the Supply business spinoff; the profitability and liquidity of
PPL Corporation and its subsidiaries; new accounting requirements or new interpretations or applications of existing requirements;
operating performance of our facilities; the length of scheduled and unscheduled outages at our generating plants; environmental
conditions and requirements and the related costs of compliance; system conditions and operating costs; development of new projects,
markets and technologies; performance of new ventures; asset or business acquisitions and dispositions; any impact of hurricanes
or other severe weather on our business; receipt of necessary government permits, approvals, rate relief and regulatory cost recovery;
capital market conditions and decisions regarding capital structure; the impact of state, federal or foreign investigations applicable
to PPL Corporation and its subsidiaries; the outcome of litigation against PPL Corporation and its subsidiaries; stock price performance;
the market prices of equity securities and the impact on pension income and resultant cash funding requirements for defined benefit
pension plans; the securities and credit ratings of PPL Corporation and its subsidiaries; political, regulatory or economic conditions
in states, regions or countries where PPL Corporation or its subsidiaries conduct business, including any potential effects of
threatened or actual terrorism or war or other hostilities; British pound sterling to U.S. dollar exchange rates; new state, federal
or foreign legislation, including new tax legislation; and the commitments and liabilities of PPL Corporation and its subsidiaries.
Any such forward-looking statements should be considered in light of such important factors and in conjunction with PPL Corporation’s
Form 10-K and other reports on file with the Securities and Exchange Commission.
Note to Editors: Visit
our media website at www.pplnewsroom.com for additional news and background about PPL Corporation.
| PPL
CORPORATION AND SUBSIDIARIES |
| CONDENSED
CONSOLIDATED FINANCIAL INFORMATION (a) |
| Condensed
Consolidated Balance Sheets (Unaudited) |
| (Millions
of Dollars) |
| |
|
|
|
September 30, |
|
December 31, |
| |
|
|
|
2015
|
|
2014
(b) |
| Assets |
|
|
|
|
|
|
| Cash
and cash equivalents |
|
$ |
981 |
|
$ |
1,399 |
| Short-term
investments |
|
|
|
|
|
120 |
| Accounts
receivable |
|
|
777 |
|
|
808 |
| Unbilled
revenues |
|
|
421 |
|
|
517 |
| Fuel,
materials and supplies |
|
|
321 |
|
|
381 |
| Current
assets of discontinued operations |
|
|
|
|
|
2,600 |
| Other
current assets |
|
|
490 |
|
|
334 |
| Property,
Plant and Equipment |
|
|
|
|
|
|
| |
Regulated
utility plant |
|
|
33,752 |
|
|
30,568 |
| |
Less:
Accumulated depreciation - regulated utility plant |
|
|
5,632 |
|
|
5,361 |
| |
|
Regulated
utility plant, net |
|
|
28,120 |
|
|
25,207 |
| |
Non-regulated
property, plant and equipment |
|
|
534 |
|
|
592 |
| |
Less:
Accumulated depreciation - non-regulated property, plant and equipment |
|
|
170 |
|
|
162 |
| |
|
Non-regulated
property, plant and equipment, net |
|
|
364 |
|
|
430 |
| |
Construction
work in progress |
|
|
1,478 |
|
|
2,532 |
| |
Property,
Plant and Equipment, net |
|
|
29,962 |
|
|
28,169 |
| Noncurrent
regulatory assets |
|
|
1,627 |
|
|
1,562 |
| Goodwill
and other intangibles |
|
|
4,285 |
|
|
4,335 |
| Noncurrent
assets of discontinued operations |
|
|
|
|
|
8,317 |
| Other
noncurrent assets |
|
|
382 |
|
|
322 |
| Total
Assets |
|
$ |
39,246 |
|
$ |
48,864 |
| |
|
|
|
|
|
|
|
|
| Liabilities
and Equity |
|
|
|
|
|
|
| Short-term
debt |
|
$ |
557 |
|
$ |
836 |
| Long-term
debt due within one year |
|
|
1,460 |
|
|
1,000 |
| Accounts
payable |
|
|
808 |
|
|
995 |
| Current
liabilities of discontinued operations |
|
|
|
|
|
2,775 |
| Other
current liabilities |
|
|
1,643 |
|
|
1,837 |
| Long-term
debt |
|
|
17,745 |
|
|
17,173 |
| Deferred
income taxes and investment tax credits |
|
|
3,865 |
|
|
3,359 |
| Accrued
pension obligations |
|
|
963 |
|
|
1,457 |
| Asset
retirement obligations |
|
|
539 |
|
|
324 |
| Noncurrent
regulatory liabilities |
|
|
962 |
|
|
992 |
| Noncurrent
liabilities of discontinued operations |
|
|
|
|
|
3,963 |
| Other
noncurrent liabilities |
|
|
482 |
|
|
525 |
| Common
stock and additional paid-in capital |
|
|
9,637 |
|
|
9,440 |
| Earnings
reinvested (c) |
|
|
2,791 |
|
|
6,462 |
| Accumulated
other comprehensive loss |
|
|
(2,206) |
|
|
(2,274) |
| Total
Liabilities and Equity |
|
$ |
39,246 |
|
$ |
48,864 |
| (a) | The
Financial Statements in this news release have been condensed and summarized for purposes
of this presentation. Please refer to PPL Corporation’s periodic filings with the
Securities and Exchange Commission for full financial statements, including note disclosure. |
| (b) | Amounts
have been reclassified to reflect the Supply segment as a discontinued operation. |
| (c) | 2015
reflects the impact of the spinoff of the Supply segment and a $3.2 billion related dividend. |
| PPL
CORPORATION AND SUBSIDIARIES |
| |
|
|
|
|
|
|
|
|
|
|
|
|
|
|
|
| Condensed
Consolidated Statements of Income (Unaudited) |
| (Millions
of Dollars, except share data) |
| |
|
|
|
|
|
|
|
|
|
|
|
|
|
|
|
| |
|
|
|
|
Three
Months Ended September 30, |
|
Nine
Months Ended September 30, |
| |
|
|
|
|
2015 |
|
2014
(a) |
|
2015
(a) |
|
2014
(a) |
| |
|
|
|
|
|
|
|
|
|
|
|
|
|
|
|
| Operating
Revenues |
|
$ |
1,878 |
|
$ |
1,879 |
|
$ |
5,889 |
|
$ |
5,906 |
| |
|
|
|
|
|
|
|
|
|
|
|
|
|
|
|
| Operating
Expenses |
|
|
|
|
|
|
|
|
|
|
|
|
| |
Operation |
|
|
|
|
|
|
|
|
|
|
|
|
| |
|
Fuel
|
|
|
228 |
|
|
240 |
|
|
695 |
|
|
748 |
| |
|
Energy
purchases |
|
|
177 |
|
|
173 |
|
|
676 |
|
|
683 |
| |
|
Other
operation and maintenance |
|
|
482 |
|
|
467 |
|
|
1,405 |
|
|
1,382 |
| |
Depreciation
|
|
|
226 |
|
|
233 |
|
|
658 |
|
|
688 |
| |
Taxes,
other than income |
|
|
79 |
|
|
78 |
|
|
241 |
|
|
238 |
| |
Total
Operating Expenses |
|
|
1,192 |
|
|
1,191 |
|
|
3,675 |
|
|
3,739 |
| |
|
|
|
|
|
|
|
|
|
|
|
|
|
|
|
| Operating
Income |
|
|
686 |
|
|
688 |
|
|
2,214 |
|
|
2,167 |
| |
|
|
|
|
|
|
|
|
|
|
|
|
|
|
|
| Other
Income (Expense) - net |
|
|
75 |
|
|
136 |
|
|
61 |
|
|
33 |
| |
|
|
|
|
|
|
|
|
|
|
|
|
|
|
|
| Interest
Expense |
|
|
221 |
|
|
213 |
|
|
645 |
|
|
637 |
| |
|
|
|
|
|
|
|
|
|
|
|
|
|
|
|
| Income
from Continuing Operations Before Income Taxes |
|
|
540 |
|
|
611 |
|
|
1,630 |
|
|
1,563 |
| |
|
|
|
|
|
|
|
|
|
|
|
|
|
|
|
| Income
Taxes |
|
|
144 |
|
|
201 |
|
|
432 |
|
|
534 |
| |
|
|
|
|
|
|
|
|
|
|
|
|
|
|
|
| Income
from Continuing Operations After Income Taxes |
|
|
396 |
|
|
410 |
|
|
1,198 |
|
|
1,029 |
| |
|
|
|
|
|
|
|
|
|
|
|
|
|
|
|
| Income
(Loss) from Discontinued Operations (net of income taxes) (Note 8) |
|
|
(3) |
|
|
87 |
|
|
(915) |
|
|
13 |
| |
|
|
|
|
|
|
|
|
|
|
|
|
|
|
|
| Net
Income |
|
$ |
393 |
|
$ |
497 |
|
$ |
283 |
|
$ |
1,042 |
| |
|
|
|
|
|
|
|
|
|
|
|
|
|
|
|
| |
|
|
|
|
|
|
|
|
|
|
|
|
|
|
|
| Earnings
Per Share of Common Stock: |
|
|
|
|
|
|
|
|
|
|
|
|
| |
Income
from Continuing Operations After Income Taxes Available |
|
|
|
|
|
|
|
|
|
| |
to
PPL Common Shareowners: |
|
|
|
|
|
|
|
|
|
|
|
|
| |
Basic |
|
$ |
0.59 |
|
$ |
0.61 |
|
$ |
1.78 |
|
$ |
1.58 |
| |
Diluted |
|
$ |
0.59 |
|
$ |
0.61 |
|
$ |
1.78 |
|
$ |
1.55 |
| |
Net
Income Available to PPL Common Shareowners: |
|
|
|
|
|
|
|
|
|
|
|
|
| |
Basic |
|
$ |
0.58 |
|
$ |
0.74 |
|
$ |
0.42 |
|
$ |
1.60 |
| |
Diluted |
|
$ |
0.58 |
|
$ |
0.74 |
|
$ |
0.42 |
|
$ |
1.57 |
| |
|
|
|
|
|
|
|
|
|
|
|
|
|
|
|
| Weighted-Average
Shares of Common Stock Outstanding |
|
|
|
|
|
|
|
|
|
|
|
|
| (in
thousands) |
|
|
|
|
|
|
|
|
|
|
|
|
| |
Basic |
|
|
670,763 |
|
|
664,432 |
|
|
668,731 |
|
|
649,561 |
| |
Diluted |
|
|
673,702 |
|
|
666,402 |
|
|
671,254 |
|
|
665,501 |
(a) Amounts have been
reclassified to reflect the Supply segment as a discontinued operation.
| PPL
CORPORATION AND SUBSIDIARIES |
| |
|
|
|
|
|
|
|
|
|
| Condensed
Consolidated Statements of Cash Flows (Unaudited) |
| (Millions
of Dollars) |
| |
|
|
|
|
|
|
|
|
|
| |
|
|
|
|
Nine
Months Ended September 30, |
| |
|
|
|
|
2015
(a) |
|
2014
(a) |
| Cash
Flows from Operating Activities |
|
|
|
|
|
|
| |
Net
income |
|
$ |
283 |
|
$ |
1,042 |
| |
(Income)
loss from discontinued operations (net of income taxes) |
|
|
915 |
|
|
(13) |
| |
Income
from continuing operations (net of income taxes) |
|
|
1,198 |
|
|
1,029 |
| |
Adjustments
to reconcile Income from continuing operations (net of taxes) to net cash provided by operating activities - continuing operations |
|
|
|
|
|
|
| |
|
Depreciation |
|
|
658 |
|
|
688 |
| |
|
Amortization |
|
|
46 |
|
|
51 |
| |
|
Defined
benefit plans - expense |
|
|
44 |
|
|
37 |
| |
|
Deferred
income taxes and investment tax credits |
|
|
359 |
|
|
416 |
| |
|
Unrealized
gains on derivatives, and other hedging activities |
|
|
(17) |
|
|
(99) |
| |
|
Adjustment
to WPD line loss accrual |
|
|
|
|
|
65 |
| |
|
Stock-based
compensation expense |
|
|
26 |
|
|
24 |
| |
|
Other
|
|
|
9 |
|
|
(1) |
| |
Change
in current assets and current liabilities |
|
|
|
|
|
|
| |
|
Accounts
payable |
|
|
(180) |
|
|
(53) |
| |
|
Unbilled
revenues |
|
|
91 |
|
|
122 |
| |
|
Taxes
payable |
|
|
(142) |
|
|
138 |
| |
|
Other
|
|
|
53 |
|
|
(17) |
| |
Other
operating activities |
|
|
|
|
|
|
| |
|
Defined
benefit plans - funding |
|
|
(396) |
|
|
(290) |
| |
|
Other
|
|
|
(61) |
|
|
53 |
| |
|
|
Net
cash provided by operating activities - continuing operations |
|
|
1,688 |
|
|
2,163 |
| |
Net
cash provided by operating activities - discontinued operations |
|
|
343 |
|
|
465 |
| |
|
|
Net
cash provided by operating activities |
|
|
2,031 |
|
|
2,628 |
| Cash
Flows from Investing Activities |
|
|
|
|
|
|
| |
Investing
activities from continuing operations: |
|
|
|
|
|
|
| |
Expenditures
for property, plant and equipment |
|
|
(2,560) |
|
|
(2,602) |
| |
Expenditures
for intangible assets |
|
|
(32) |
|
|
(36) |
| |
Purchase
of other investments |
|
|
(15) |
|
|
|
| |
Proceeds
from the sale of other investments |
|
|
136 |
|
|
|
| |
Net
decrease in restricted cash and cash equivalents |
|
|
5 |
|
|
12 |
| |
Other
investing activities |
|
|
3 |
|
|
(4) |
| |
|
|
Net
cash used in investing activities - continuing operations |
|
|
(2,463) |
|
|
(2,630) |
| |
Net
cash used in investing activities - discontinued operations |
|
|
(149) |
|
|
(344) |
| |
|
|
Net
cash used in investing activities |
|
|
(2,612) |
|
|
(2,974) |
| Cash
Flows from Financing Activities |
|
|
|
|
|
|
| |
Financing
activities from continuing operations: |
|
|
|
|
|
|
| |
Issuance
of long-term debt |
|
|
1,137 |
|
|
296 |
| |
Retirement
of long-term debt |
|
|
|
|
|
(237) |
| |
Issuance
of common stock |
|
|
145 |
|
|
1,037 |
| |
Payment
of common stock dividends |
|
|
(750) |
|
|
(718) |
| |
Net
decrease in short-term debt |
|
|
(271) |
|
|
(192) |
| |
Other
financing activities |
|
|
(30) |
|
|
(49) |
| |
|
|
Net
cash provided by financing activities - continuing operations |
|
|
231 |
|
|
137 |
| |
Net
cash used in financing activities - discontinued operations |
|
|
(546) |
|
|
(166) |
| |
Net
cash distributions to parent from discontinued operations |
|
|
132 |
|
|
448 |
| |
|
|
Net
cash provided by (used in) financing activities |
|
|
(183) |
|
|
419 |
| Effect
of Exchange Rates on Cash and Cash Equivalents |
|
|
(6) |
|
|
13 |
| Net
Decrease in Cash and Cash Equivalents included in Discontinued Operations |
|
|
352 |
|
|
45 |
| Net
Increase (Decrease) in Cash and Cash Equivalents |
|
|
(418) |
|
|
131 |
| Cash
and Cash Equivalents at Beginning of Period |
|
|
1,399 |
|
|
863 |
| Cash
and Cash Equivalents at End of Period |
|
$ |
981 |
|
$ |
994 |
| (a) | Amounts
have been reclassified to reflect the Supply segment as a discontinued operation. |
| Key
Indicators (Unaudited) |
| |
|
|
|
|
|
|
|
|
|
|
|
|
|
|
| |
|
|
|
|
|
|
|
|
|
|
|
12
Months Ended |
| |
|
|
|
|
|
|
|
|
|
|
|
September 30, |
| Financial |
|
|
|
|
|
2015 |
|
2014 |
| |
|
|
|
|
|
|
|
|
|
|
|
|
|
|
| Dividends
declared per share of common stock |
|
|
|
|
|
$1.495 |
|
$1.485 |
| Book
value per share (a)(b)(c) |
|
|
|
|
|
$15.22 |
|
$21.02 |
| Market
price per share (a) |
|
|
|
|
|
$32.89 |
|
$32.84 |
| Dividend
yield |
|
|
|
|
|
4.5% |
|
4.5% |
| Dividend
payout ratio (d)(e) |
|
|
|
|
|
102.4% |
|
103.8% |
| Dividend
payout ratio - earnings from ongoing operations (d)(f) |
|
|
|
|
|
65.9% |
|
60.1% |
| Price/earnings
ratio (d)(e) |
|
|
|
|
|
22.5 |
|
23.0 |
| Price/earnings
ratio - earnings from ongoing operations (d)(f) |
|
|
|
|
|
14.5 |
|
13.3 |
| Return
on average common equity (e) |
|
|
|
|
|
7.7% |
|
7.2% |
| Return
on average common equity - earnings from ongoing operations (f) |
|
|
|
|
|
12.0% |
|
12.5% |
| (b) | Based
on 671,792 and 664,653 shares of common stock outstanding (in thousands) at September 30,
2015, and September 30, 2014. |
| (c) | 2015
reflects the impact of the spinoff of the Supply segment and a $3.2 billion related dividend. |
| (d) | Based
on diluted earnings per share. |
| (e) | 2015
includes the impact of the $879 million loss on the spinoff of the Supply segment, reflecting
the difference between PPL’s recorded value for the Supply segment and the estimated
fair value determined in accordance with applicable accounting rules under GAAP. 2015
also includes eight months of Supply segment earnings, compared to 12 months in 2014. |
| (f) | The
calculation for 2015 includes three months of earnings from 2014 that were adjusted for
Supply segment earnings and the impact of dissynergies related to the spinoff of the
Supply segment. 2014 was not adjusted for such items. Earnings from ongoing operations
is a non-GAAP financial measure that includes adjustments described in the text and tables
of this news release. |
| Operating
- Domestic & International Electricity Sales (Unaudited) |
| |
|
|
|
|
|
|
|
|
|
|
|
|
|
|
| |
|
|
|
3
Months Ended September 30, |
|
9
Months Ended September 30, |
| |
|
|
|
|
|
|
|
Percent |
|
|
|
|
|
Percent |
| (GWh) |
|
2015 |
|
2014 |
|
Change |
|
2015 |
|
2014 |
|
Change |
| |
|
|
|
|
|
|
|
|
|
|
|
|
|
|
| Domestic
Retail Delivered |
|
|
|
|
|
|
|
|
|
|
|
|
| |
PPL
Electric Utilities |
|
9,423 |
|
8,945 |
|
5.3% |
|
28,551 |
|
27,953 |
|
2.1% |
| |
LKE |
|
8,282 |
|
8,120 |
|
2.0% |
|
23,984 |
|
24,033 |
|
(0.2%) |
| |
|
Total |
|
17,705 |
|
17,065 |
|
3.8% |
|
52,535 |
|
51,986 |
|
1.1% |
| |
|
|
|
|
|
|
|
|
|
|
|
|
|
|
| Domestic
Retail Supplied |
|
|
|
|
|
|
|
|
|
|
|
|
| |
LKE
(a) |
|
8,282 |
|
8,120 |
|
2.0% |
|
23,984 |
|
24,033 |
|
(0.2%) |
| |
|
|
|
|
|
|
|
|
|
|
|
|
|
|
| International
Delivered |
|
|
|
|
|
|
|
|
|
|
|
|
| |
United
Kingdom |
|
17,293 |
|
17,255 |
|
0.2% |
|
57,122 |
|
56,954 |
|
0.3% |
| |
|
|
|
|
|
|
|
|
|
|
|
|
|
|
| Domestic
Wholesale |
|
|
|
|
|
|
|
|
|
|
|
|
| |
LKE
(b) |
|
606 |
|
589 |
|
2.9% |
|
1,789 |
|
1,851 |
|
(3.3%) |
(a) Represents GWh
supplied by LKE to retail customers in Kentucky, Virginia and Tennessee.
(b) Represents FERC-regulated
municipal and unregulated off-system sales.
| Reconciliation
of Segment Reported Earnings (Loss) to Earnings from Ongoing Operations |
| (After-Tax) |
|
|
|
|
|
|
|
|
|
|
|
|
|
|
|
|
|
|
| (Unaudited) |
|
|
|
|
|
|
|
|
|
|
|
|
|
|
|
|
|
|
| |
|
|
|
|
|
|
|
|
|
|
|
|
|
|
|
|
|
|
|
|
|
|
|
|
|
|
|
|
|
|
|
|
|
|
|
|
| (millions
of dollars) |
3rd
Quarter 2015 |
|
Year-to-Date
September 30, 2015 |
| |
|
|
U.K. |
|
|
KY |
|
|
PA |
|
Corp.
& |
|
|
Disc. |
|
|
Total |
|
|
U.K. |
|
|
KY |
|
|
PA |
|
Corp.
& |
|
|
Disc. |
|
|
Total |
| |
|
|
Reg. |
|
|
Reg. |
|
|
Reg. |
|
Other |
|
|
Ops. |
|
|
Corp. |
|
|
Reg. |
|
|
Reg. |
|
|
Reg. |
|
Other |
|
Ops.(a) |
|
|
Corp. |
| Reported
Earnings (Loss) |
$ |
249 |
|
$ |
111 |
|
$ |
55 |
|
$ |
(18) |
|
$ |
(4) |
|
$ |
393 |
|
$ |
814 |
|
$ |
267 |
|
$ |
191 |
|
$ |
(73) |
|
$ |
(916) |
|
$ |
283 |
| Less:
Special Items (expense) benefit: |
|
|
|
|
|
|
|
|
|
|
|
|
|
|
|
|
|
|
|
|
|
|
|
|
|
|
|
|
|
|
|
|
|
|
|
| Foreign
currency-related economic hedges |
|
54 |
|
|
|
|
|
|
|
|
|
|
|
|
|
|
54 |
|
|
20 |
|
|
|
|
|
|
|
|
|
|
|
|
|
|
20 |
| Spinoff
of the Supply segment: |
|
|
|
|
|
|
|
|
|
|
|
|
|
|
|
|
|
|
|
|
|
|
|
|
|
|
|
|
|
|
|
|
|
|
|
| |
Discontinued
operations |
|
|
|
|
|
|
|
|
|
|
|
|
|
(4) |
|
|
(4) |
|
|
|
|
|
|
|
|
|
|
|
|
|
|
(916) |
|
|
(916) |
| |
Transition
and transaction costs |
|
|
|
|
|
|
|
|
|
|
(1) |
|
|
|
|
|
(1) |
|
|
|
|
|
|
|
|
|
|
|
(16) |
|
|
|
|
|
(16) |
| |
Employee
transitional services |
|
|
|
|
|
|
|
|
|
|
(1) |
|
|
|
|
|
(1) |
|
|
|
|
|
|
|
|
|
|
|
(4) |
|
|
|
|
|
(4) |
| |
Separation
benefits |
|
|
|
|
|
|
|
|
|
|
(1) |
|
|
|
|
|
(1) |
|
|
|
|
|
|
|
|
|
|
|
(3) |
|
|
|
|
|
(3) |
| Other: |
|
|
|
|
|
|
|
|
|
|
|
|
|
|
|
|
|
|
|
|
|
|
|
|
|
|
|
|
|
|
|
|
|
|
|
| |
WPD
Midlands acquisition-related adj. |
|
|
|
|
|
|
|
|
|
|
|
|
|
|
|
|
|
|
|
2 |
|
|
|
|
|
|
|
|
|
|
|
|
|
|
2 |
| |
Settlement-certain
income tax positions |
|
|
|
|
|
|
|
|
|
|
|
|
|
|
|
|
|
|
|
18 |
|
|
|
|
|
|
|
|
|
|
|
|
|
|
18 |
| |
Certain
valuation allowances |
|
|
|
|
|
|
|
|
|
|
|
|
|
|
|
|
|
|
|
|
|
|
(8) |
|
|
|
|
|
|
|
|
|
|
|
(8) |
| |
LKE
acquisition-related adjustment |
|
|
|
|
(1) |
|
|
|
|
|
|
|
|
|
|
|
(1) |
|
|
|
|
|
(5) |
|
|
|
|
|
|
|
|
|
|
|
(5) |
| Total
Special Items |
|
54 |
|
|
(1) |
|
|
|
|
|
(3) |
|
|
(4) |
|
|
46 |
|
|
40 |
|
|
(13) |
|
|
|
|
|
(23) |
|
|
(916) |
|
|
(912) |
| Earnings
from Ongoing Operations |
$ |
195 |
|
$ |
112 |
|
$ |
55 |
|
$ |
(15) |
|
$ |
|
|
$ |
347 |
|
$ |
774 |
|
$ |
280 |
|
$ |
191 |
|
$ |
(50) |
|
$ |
|
|
$ |
1,195 |
| |
|
|
|
|
|
|
|
|
|
|
|
|
|
|
|
|
|
|
|
|
|
|
|
|
|
|
|
|
|
|
|
|
|
|
|
|
| |
|
|
|
|
|
|
|
|
|
|
|
|
|
|
|
|
|
|
|
|
|
|
|
|
|
|
|
|
|
|
|
|
|
|
|
|
| |
|
|
|
|
|
|
|
|
|
|
|
|
|
|
|
|
|
|
|
|
|
|
|
|
|
|
|
|
|
|
|
|
|
|
|
|
| |
|
|
|
|
|
|
|
|
|
|
|
|
|
|
|
|
|
|
|
|
|
|
|
|
|
|
|
|
|
|
|
|
|
|
|
|
| (per
share - diluted) |
3rd
Quarter 2015 |
|
Year-to-Date
September 30, 2015 |
| |
|
|
U.K. |
|
|
KY |
|
|
PA |
|
Corp.
& |
|
|
Disc. |
|
|
Total |
|
|
U.K. |
|
|
KY |
|
|
PA |
|
Corp.
& |
|
|
Disc. |
|
|
Total |
| |
|
|
Reg. |
|
|
Reg. |
|
|
Reg. |
|
Other |
|
|
Ops. |
|
|
Corp. |
|
|
Reg. |
|
|
Reg. |
|
|
Reg. |
|
Other |
|
Ops.(a) |
|
|
Corp. |
| Reported
Earnings (Loss) |
$ |
0.37 |
|
$ |
0.16 |
|
$ |
0.08 |
|
$ |
(0.02) |
|
$ |
(0.01) |
|
$ |
0.58 |
|
$ |
1.21 |
|
$ |
0.40 |
|
$ |
0.28 |
|
$ |
(0.11) |
|
$ |
(1.36) |
|
$ |
0.42 |
| Less:
Special Items (expense) benefit: |
|
|
|
|
|
|
|
|
|
|
|
|
|
|
|
|
|
|
|
|
|
|
|
|
|
|
|
|
|
|
|
|
|
|
|
| Foreign
currency-related economic hedges |
|
0.08 |
|
|
|
|
|
|
|
|
|
|
|
|
|
|
0.08 |
|
|
0.03 |
|
|
|
|
|
|
|
|
|
|
|
|
|
|
0.03 |
| Spinoff
of the Supply segment: |
|
|
|
|
|
|
|
|
|
|
|
|
|
|
|
|
|
|
|
|
|
|
|
|
|
|
|
|
|
|
|
|
|
|
|
| |
Discontinued
operations |
|
|
|
|
|
|
|
|
|
|
|
|
|
(0.01) |
|
|
(0.01) |
|
|
|
|
|
|
|
|
|
|
|
|
|
|
(1.36) |
|
|
(1.36) |
| |
Transition
and transaction costs |
|
|
|
|
|
|
|
|
|
|
|
|
|
|
|
|
|
|
|
|
|
|
|
|
|
|
|
|
(0.02) |
|
|
|
|
|
(0.02) |
| |
Employee
transitional services |
|
|
|
|
|
|
|
|
|
|
|
|
|
|
|
|
|
|
|
|
|
|
|
|
|
|
|
|
(0.01) |
|
|
|
|
|
(0.01) |
| Other: |
|
|
|
|
|
|
|
|
|
|
|
|
|
|
|
|
|
|
|
|
|
|
|
|
|
|
|
|
|
|
|
|
|
|
|
| |
Settlement-certain
income tax positions |
|
|
|
|
|
|
|
|
|
|
|
|
|
|
|
|
|
|
|
0.03 |
|
|
|
|
|
|
|
|
|
|
|
|
|
|
0.03 |
| |
Certain
valuation allowances |
|
|
|
|
|
|
|
|
|
|
|
|
|
|
|
|
|
|
|
|
|
|
(0.01) |
|
|
|
|
|
|
|
|
|
|
|
(0.01) |
| |
LKE
acquisition-related adjustment |
|
|
|
|
|
|
|
|
|
|
|
|
|
|
|
|
|
|
|
|
|
|
(0.01) |
|
|
|
|
|
|
|
|
|
|
|
(0.01) |
| Total
Special Items |
|
0.08 |
|
|
|
|
|
|
|
|
|
|
|
(0.01) |
|
|
0.07 |
|
|
0.06 |
|
|
(0.02) |
|
|
|
|
|
(0.03) |
|
|
(1.36) |
|
|
(1.35) |
| Earnings
from Ongoing Operations |
$ |
0.29 |
|
$ |
0.16 |
|
$ |
0.08 |
|
$ |
(0.02) |
|
$ |
|
|
$ |
0.51 |
|
$ |
1.15 |
|
$ |
0.42 |
|
$ |
0.28 |
|
$ |
(0.08) |
|
$ |
|
|
$ |
1.77 |
| (a) | Represents
the Supply segment, which includes an $879 million charge reflecting the difference between
PPL’s recorded value for the Supply segment and the estimated fair value determined
in accordance with applicable accounting rules under GAAP. |
| Reconciliation
of Segment Reported Earnings (Loss) to Earnings from Ongoing Operations (Adjusted) |
| (After-Tax) |
|
|
|
|
|
|
|
|
|
|
|
|
|
|
|
|
|
|
| (Unaudited) |
|
|
|
|
|
|
|
|
|
|
|
|
|
|
|
|
|
|
| (millions
of dollars) |
3rd
Quarter 2014 |
|
|
Year-to-Date
September 30, 2014 |
| |
|
|
U.K. |
|
|
KY |
|
|
PA |
|
Corp.
& |
|
Disc. |
|
|
Total |
|
|
U.K. |
|
|
KY |
|
|
PA |
|
Corp.
& |
|
Disc. |
|
|
Total |
| |
|
|
Reg. |
|
|
Reg. |
|
|
Reg. |
|
Other(a) |
|
Ops.(a) |
|
|
Corp. |
|
|
Reg. |
|
|
Reg. |
|
|
Reg. |
|
Other(a) |
|
Ops.(a) |
|
|
Corp. |
| Reported
Earnings (Loss) |
$ |
295 |
|
$ |
82 |
|
$ |
57 |
|
$ |
(24) |
|
$ |
87 |
|
$ |
497
|
|
$ |
688 |
|
$ |
247 |
|
$ |
194 |
|
$ |
(100) |
|
$ |
13 |
|
$ |
1,042 |
| Less:
Special Items (expense) benefit: |
|
|
|
|
|
|
|
|
|
|
|
|
|
|
|
|
|
|
|
|
|
|
|
|
|
|
|
|
|
|
|
|
|
|
|
| Foreign
currency-related economic hedges |
|
111 |
|
|
|
|
|
|
|
|
|
|
|
|
|
|
111 |
|
|
72 |
|
|
|
|
|
|
|
|
|
|
|
|
|
|
72 |
| Spinoff
of the Supply segment: |
|
|
|
|
|
|
|
|
|
|
|
|
|
|
|
|
|
|
|
|
|
|
|
|
|
|
|
|
|
|
|
|
|
|
|
| |
Supply
segment earnings |
|
|
|
|
|
|
|
|
|
|
|
|
|
86 |
|
|
86 |
|
|
|
|
|
|
|
|
|
|
|
|
|
|
16 |
|
|
16 |
| |
Discontinued
operations adjustments |
|
|
|
|
|
|
|
|
|
|
(1) |
|
|
1 |
|
|
|
|
|
|
|
|
|
|
|
|
|
|
(7) |
|
|
7 |
|
|
|
| |
Change
in tax valuation allowances |
|
|
|
|
|
|
|
|
|
|
(3) |
|
|
|
|
|
(3) |
|
|
|
|
|
|
|
|
|
|
|
(49) |
|
|
|
|
|
(49) |
| |
Transition
and transaction costs |
|
|
|
|
|
|
|
|
|
|
(3) |
|
|
|
|
|
(3) |
|
|
|
|
|
|
|
|
|
|
|
(3) |
|
|
(10) |
|
|
(13) |
| |
Separation
benefits |
|
|
|
|
|
|
|
|
|
|
(11) |
|
|
|
|
|
(11) |
|
|
|
|
|
|
|
|
|
|
|
(11) |
|
|
|
|
|
(11) |
| Other: |
|
|
|
|
|
|
|
|
|
|
|
|
|
|
|
|
|
|
|
|
|
|
|
|
|
|
|
|
|
|
|
|
|
|
|
| |
Change
in WPD line loss accrual |
|
|
|
|
|
|
|
|
|
|
|
|
|
|
|
|
|
|
|
(52) |
|
|
|
|
|
|
|
|
|
|
|
|
|
|
(52) |
| |
EEI
adjustments |
|
|
|
|
(1) |
|
|
|
|
|
|
|
|
|
|
|
(1) |
|
|
|
|
|
|
|
|
|
|
|
|
|
|
|
|
|
|
| |
Separation
benefits |
|
|
|
|
|
|
|
2 |
|
|
|
|
|
|
|
|
2 |
|
|
|
|
|
|
|
|
(2) |
|
|
|
|
|
|
|
|
(2) |
| Total
Special Items |
|
111 |
|
|
(1) |
|
|
2 |
|
|
(18) |
|
|
87 |
|
|
181 |
|
|
20 |
|
|
|
|
|
(2) |
|
|
(70) |
|
|
13 |
|
|
(39) |
| |
|
|
|
|
|
|
|
|
|
|
|
|
|
|
|
|
|
|
|
|
|
|
|
|
|
|
|
|
|
|
|
|
|
|
|
|
| Dissynergies-spinoff
of Supply segment |
|
|
|
|
|
|
|
|
|
|
|
|
|
|
|
|
|
|
|
|
|
|
|
|
|
|
|
|
|
|
|
|
|
|
|
| Expense(benefit):
(b) |
|
|
|
|
|
|
|
|
|
|
|
|
|
|
|
|
|
|
|
|
|
|
|
|
|
|
|
|
|
|
|
|
|
|
|
| |
Indirect
operation and maintenance |
|
|
|
|
|
|
|
|
|
|
10 |
|
|
|
|
|
10 |
|
|
|
|
|
|
|
|
|
|
|
35 |
|
|
|
|
|
35 |
| |
Interest
expense |
|
|
|
|
|
|
|
|
|
|
7 |
|
|
|
|
|
7 |
|
|
|
|
|
|
|
|
|
|
|
22 |
|
|
|
|
|
22 |
| |
Depreciation |
|
|
|
|
|
|
|
|
|
|
2 |
|
|
|
|
|
2 |
|
|
|
|
|
|
|
|
|
|
|
5 |
|
|
|
|
|
5 |
| Total
dissynergies-spinoff of Supply segment |
|
|
|
|
|
|
|
|
|
|
19 |
|
|
|
|
|
19 |
|
|
|
|
|
|
|
|
|
|
|
62 |
|
|
|
|
|
62 |
| Earnings
from Ongoing Operations(Adjusted) |
$ |
184 |
|
$ |
83 |
|
$ |
55 |
|
$ |
(25) |
|
$ |
|
|
$ |
297 |
|
$ |
668 |
|
$ |
247 |
|
$ |
196 |
|
$ |
(92) |
|
$ |
|
|
$ |
1,019 |
| |
|
|
|
|
|
|
|
|
|
|
|
|
|
|
|
|
|
|
|
|
|
|
|
|
|
|
|
|
|
|
|
|
|
|
|
|
| |
|
|
|
|
|
|
|
|
|
|
|
|
|
|
|
|
|
|
|
|
|
|
|
|
|
|
|
|
|
|
|
|
|
|
|
|
| |
|
|
|
|
|
|
|
|
|
|
|
|
|
|
|
|
|
|
|
|
|
|
|
|
|
|
|
|
|
|
|
|
|
|
|
|
| |
|
|
|
|
|
|
|
|
|
|
|
|
|
|
|
|
|
|
|
|
|
|
|
|
|
|
|
|
|
|
|
|
|
|
|
|
| |
|
|
|
|
|
|
|
|
|
|
|
|
|
|
|
|
|
|
|
|
|
|
|
|
|
|
|
|
|
|
|
|
|
|
|
|
| |
|
|
|
|
|
|
|
|
|
|
|
|
|
|
|
|
|
|
|
|
|
|
|
|
|
|
|
|
|
|
|
|
|
|
|
|
| (per
share - diluted) |
3rd
Quarter 2014 |
|
Year-to-Date
September 30, 2014 (c) |
| |
|
|
U.K. |
|
|
KY |
|
|
PA |
|
Corp.
& |
|
Disc. |
|
|
Total |
|
|
U.K. |
|
|
KY |
|
|
PA |
|
Corp.
& |
|
Disc. |
|
|
Total |
| |
|
|
Reg. |
|
|
Reg. |
|
|
Reg. |
|
Other(a) |
|
Ops.(a) |
|
|
Corp. |
|
|
Reg. |
|
|
Reg. |
|
|
Reg. |
|
Other(a) |
|
Ops.(a) |
|
|
Corp. |
| Reported
Earnings (Loss) |
$ |
0.44 |
|
$ |
0.12 |
|
$ |
0.09 |
|
$ |
(0.04) |
|
$ |
0.13 |
|
$ |
0.74 |
|
$ |
1.04 |
|
$ |
0.37 |
|
$ |
0.29 |
|
$ |
(0.15) |
|
$ |
0.02 |
|
$ |
1.57 |
| Less:
Special Items (expense) benefit: |
|
|
|
|
|
|
|
|
|
|
|
|
|
|
|
|
|
|
|
|
|
|
|
|
|
|
|
|
|
|
|
|
|
|
|
| Foreign
currency-related economic hedges |
|
0.16 |
|
|
|
|
|
|
|
|
|
|
|
|
|
|
0.16 |
|
|
0.11 |
|
|
|
|
|
|
|
|
|
|
|
|
|
|
0.11 |
| Spinoff
of the Supply segment: |
|
|
|
|
|
|
|
|
|
|
|
|
|
|
|
|
|
|
|
|
|
|
|
|
|
|
|
|
|
|
|
|
|
|
|
| |
Supply
segment earnings |
|
|
|
|
|
|
|
|
|
|
|
|
|
0.13 |
|
|
0.13 |
|
|
|
|
|
|
|
|
|
|
|
|
|
|
0.02 |
|
|
0.02 |
| |
Discontinued
operations adjustments |
|
|
|
|
|
|
|
|
|
|
|
|
|
|
|
|
|
|
|
|
|
|
|
|
|
|
|
|
(0.01) |
|
|
0.01 |
|
|
|
| |
Change
in tax valuation allowances |
|
|
|
|
|
|
|
|
|
|
(0.01) |
|
|
|
|
|
(0.01) |
|
|
|
|
|
|
|
|
|
|
|
(0.07) |
|
|
|
|
|
(0.07) |
| |
Transition
and transaction costs |
|
|
|
|
|
|
|
|
|
|
|
|
|
|
|
|
|
|
|
|
|
|
|
|
|
|
|
|
(0.01) |
|
|
(0.01) |
|
|
(0.02) |
| |
Separation
benefits |
|
|
|
|
|
|
|
|
|
|
(0.02) |
|
|
|
|
|
(0.02) |
|
|
|
|
|
|
|
|
|
|
|
(0.02) |
|
|
|
|
|
(0.02) |
| Other: |
|
|
|
|
|
|
|
|
|
|
|
|
|
|
|
|
|
|
|
|
|
|
|
|
|
|
|
|
|
|
|
|
|
|
|
| |
Change
in WPD line loss accrual |
|
|
|
|
|
|
|
|
|
|
|
|
|
|
|
|
|
|
|
(0.08) |
|
|
|
|
|
|
|
|
|
|
|
|
|
|
(0.08) |
| |
Separation
benefits |
|
|
|
|
|
|
|
0.01 |
|
|
|
|
|
|
|
|
0.01 |
|
|
|
|
|
|
|
|
|
|
|
|
|
|
|
|
|
|
| Total
Special Items |
|
0.16 |
|
|
|
|
|
0.01 |
|
|
(0.03) |
|
|
0.13 |
|
|
0.27 |
|
|
0.03 |
|
|
|
|
|
|
|
|
(0.11) |
|
|
0.02 |
|
|
(0.06) |
| |
|
|
|
|
|
|
|
|
|
|
|
|
|
|
|
|
|
|
|
|
|
|
|
|
|
|
|
|
|
|
|
|
|
|
|
|
| Dissynergies-spinoff
of Supply segment |
|
|
|
|
|
|
|
|
|
|
|
|
|
|
|
|
|
|
|
|
|
|
|
|
|
|
|
|
|
|
|
|
|
|
|
| Expense(benefit):
(b) |
|
|
|
|
|
|
|
|
|
|
|
|
|
|
|
|
|
|
|
|
|
|
|
|
|
|
|
|
|
|
|
|
|
|
|
| |
Indirect
operation and maintenance |
|
|
|
|
|
|
|
|
|
|
0.02 |
|
|
|
|
|
0.02 |
|
|
|
|
|
|
|
|
|
|
|
0.05 |
|
|
|
|
|
0.05 |
| |
Interest
expense |
|
|
|
|
|
|
|
|
|
|
0.01 |
|
|
|
|
|
0.01 |
|
|
|
|
|
|
|
|
|
|
|
0.03 |
|
|
|
|
|
0.03 |
| |
Depreciation |
|
|
|
|
|
|
|
|
|
|
|
|
|
|
|
|
|
|
|
|
|
|
|
|
|
|
|
|
0.01 |
|
|
|
|
|
0.01 |
| Total
dissynergies-spinoff of Supply segment |
|
|
|
|
|
|
|
|
|
|
0.03 |
|
|
|
|
|
0.03 |
|
|
|
|
|
|
|
|
|
|
|
0.09 |
|
|
|
|
|
0.09 |
| Earnings
from Ongoing Operations(Adjusted) |
$ |
0.28 |
|
$ |
0.12 |
|
$ |
0.08 |
|
$ |
(0.04) |
|
$ |
|
|
$ |
0.44 |
|
$ |
1.01 |
|
$ |
0.37 |
|
$ |
0.29 |
|
$ |
(0.13) |
|
$ |
|
|
$ |
1.54 |
(a) Certain
amounts have been reclassified to reflect the Supply segment as a discontinued operation.
(b) Represents
2014 costs allocated to the Supply segment that remained with PPL after the spinoff of the Supply segment.
| (c) | The
"If-Converted Method" has been applied to PPL's 2011 Equity Units, resulting
in $9 million of interest charges (after-tax) being added back to earnings and approximately
14 million shares of PPL Common Stock being treated as outstanding. Both adjustments
are only for purposes of calculating diluted earnings per share. |
| Reconciliation
of Segment Reported Earnings (Loss) to Earnings from Ongoing Operations (Adjusted) |
| (After-Tax) |
| (Unaudited) |
| |
|
|
|
|
|
|
|
|
|
|
|
|
|
|
|
|
|
|
|
| Year-to-Date
December 31, 2014 |
|
(per
share - diluted) (a) |
| |
U.K. |
KY |
PA |
Corp.
& |
Disc. |
|
| |
|
|
Reg. |
|
Reg. |
|
Reg. |
|
Other
(b) |
|
Ops.
(b) |
|
Total |
| Reported
Earnings (Loss) |
|
$ |
1.48 |
|
$ |
0.47 |
|
$ |
0.39 |
|
$ |
(0.18) |
|
$ |
0.45 |
|
$ |
2.61 |
| Less:
Special Items (expense) benefit: |
|
|
|
|
|
|
|
|
|
|
|
|
|
|
|
|
|
|
| Foreign
currency-related economic hedges |
|
|
0.19 |
|
|
|
|
|
|
|
|
|
|
|
|
|
|
0.19 |
| Spinoff
of the Supply segment: |
|
|
|
|
|
|
|
|
|
|
|
|
|
|
|
|
|
|
| |
Discontinued
operations |
|
|
|
|
|
|
|
|
|
|
|
(0.01) |
|
|
0.45 |
|
|
0.44 |
| |
Change
in tax valuation allowances |
|
|
|
|
|
|
|
|
|
|
|
(0.07) |
|
|
|
|
|
(0.07) |
| |
Separation
benefits |
|
|
|
|
|
|
|
|
|
|
|
(0.02) |
|
|
|
|
|
(0.02) |
| Other: |
|
|
|
|
|
|
|
|
|
|
|
|
|
|
|
|
|
|
| |
Change
in WPD line loss accrual |
|
|
(0.08) |
|
|
|
|
|
|
|
|
|
|
|
|
|
|
(0.08) |
| |
Separation
benefits |
|
|
|
|
|
|
|
|
(0.01) |
|
|
|
|
|
|
|
|
(0.01) |
| Total
Special Items |
|
|
0.11 |
|
|
|
|
|
(0.01) |
|
|
(0.10) |
|
|
0.45 |
|
|
0.45 |
| |
|
|
|
|
|
|
|
|
|
|
|
|
|
|
|
|
|
|
|
| Dissynergies-spinoff
of Supply segment |
|
|
|
|
|
|
|
|
|
|
|
|
|
|
|
|
|
|
| expense
(benefit): (c) |
|
|
|
|
|
|
|
|
|
|
|
|
|
|
|
|
|
|
| |
Indirect
operation and maintenance |
|
|
|
|
|
|
|
|
|
|
|
0.07 |
|
|
|
|
|
0.07 |
| |
Interest
expense |
|
|
|
|
|
|
|
|
|
|
|
0.05 |
|
|
|
|
|
0.05 |
| |
Depreciation
|
|
|
|
|
|
|
|
|
|
|
|
0.01 |
|
|
|
|
|
0.01 |
| Total
dissynergies-spinoff of Supply segment |
|
|
|
|
|
|
|
|
|
|
|
0.13 |
|
|
|
|
|
0.13 |
| Earnings
from Ongoing Operations (Adjusted) |
|
$ |
1.37 |
|
$ |
0.47 |
|
$ |
0.40 |
|
$ |
(0.21) |
|
$ |
|
|
$ |
2.03 |
| |
|
|
|
|
|
|
|
|
|
|
|
|
|
|
|
|
|
|
|
| (a) | The
"If-Converted Method" has been applied to PPL's 2011 Equity Units, resulting
in $9 million of interest charges (after-tax) being added back to earnings and approximately
11 million shares of PPL Common Stock being treated as outstanding. Both adjustments
are only for purposes of calculating diluted earnings per share. |
| (b) | Certain amounts have been reclassified
to reflect the Supply segment as a discontinued operation. |
| (c) | Represents 2014 costs allocated to
the Supply segment that remained with PPL after the spinoff of the Supply segment. |
| Reconciliation
of PPL's Forecast of Reported Earnings (Loss) to Earnings from Ongoing Operations |
| (After-Tax) |
|
|
|
|
|
|
| (Unaudited) |
|
|
|
|
|
|
| |
|
|
|
|
|
|
|
|
|
|
|
|
|
|
|
|
|
|
|
|
|
|
|
|
| |
Forecast
(per share - diluted) |
| |
|
2015
Midpoint |
|
|
| |
|
U.K. |
|
KY |
|
PA |
|
Corp. |
|
Disc. |
|
|
|
High |
|
Low |
| |
|
Reg. |
|
Reg. |
|
Reg. |
|
&
Other |
|
Ops.(a) |
|
Total |
|
2015 |
|
2015 |
| Reported
Earnings (Loss) |
$ |
1.49 |
|
$ |
0.49 |
|
$ |
0.37 |
|
$ |
(0.14) |
|
$ |
(1.36) |
|
$ |
0.85 |
|
$ |
0.90 |
|
$ |
0.80 |
| Less:
Special Items (expense) benefit: |
|
|
|
|
|
|
|
|
|
|
|
|
|
|
|
|
|
|
|
|
|
|
|
| Foreign
currency-related economic hedges |
|
0.03 |
|
|
|
|
|
|
|
|
|
|
|
|
|
|
0.03 |
|
|
0.03 |
|
|
0.03 |
| Spinoff
of the Supply segment: |
|
|
|
|
|
|
|
|
|
|
|
|
|
|
|
|
|
|
|
|
|
|
|
| |
Discontinued
operations |
|
|
|
|
|
|
|
|
|
|
|
|
|
(1.36) |
|
|
(1.36) |
|
|
(1.36) |
|
|
(1.36) |
| |
Transition
and transaction costs |
|
|
|
|
|
|
|
|
|
|
(0.02) |
|
|
|
|
|
(0.02) |
|
|
(0.02) |
|
|
(0.02) |
| |
Employee
transitional services |
|
|
|
|
|
|
|
|
|
|
(0.01) |
|
|
|
|
|
(0.01) |
|
|
(0.01) |
|
|
(0.01) |
| Other: |
|
|
|
|
|
|
|
|
|
|
|
|
|
|
|
|
|
|
|
|
|
|
|
| |
Settlement
of certain income tax positions |
|
0.03 |
|
|
|
|
|
|
|
|
|
|
|
|
|
|
0.03 |
|
|
0.03 |
|
|
0.03 |
| |
Certain
valuation allowances |
|
|
|
|
(0.01) |
|
|
|
|
|
|
|
|
|
|
|
(0.01) |
|
|
(0.01) |
|
|
(0.01) |
| |
LKE
acquisition-related adjustment |
|
|
|
|
(0.01) |
|
|
|
|
|
|
|
|
|
|
|
(0.01) |
|
|
(0.01) |
|
|
(0.01) |
| Total
Special Items |
|
0.06 |
|
|
(0.02) |
|
|
|
|
|
(0.03) |
|
|
(1.36) |
|
|
(1.35) |
|
|
(1.35) |
|
|
(1.35) |
| Earnings
from Ongoing Operations |
$ |
1.43 |
|
$ |
0.51 |
|
$ |
0.37 |
|
$ |
(0.11) |
|
$ |
|
|
$ |
2.20 |
|
$ |
2.25 |
|
$ |
2.15 |
| |
|
|
|
|
|
|
|
|
|
|
|
|
|
|
|
|
|
|
|
|
|
|
|
|
| (a) | Includes
an $879 million charge reflecting the difference between PPL's recorded value for the
Supply segment and the estimated fair value determined in accordance with applicable
rules under GAAP. |

© PPL Corporation 2015 3rd Quarter Earnings Call PPL Corporation October 29, 2015 Exhibit 99.2

© PPL Corporation 2015 2 Cautionary Statements and Factors That May Affect Future Results Anystatementsmadeinthispresentationaboutfutureoperating resultsorotherfutureeventsareforward-lookingstatements under the Safe Harbor Provisions of the Private Securities LitigationReformActof1995.Actualresultsmaydiffermaterially fromsuchforward-lookingstatements.Adiscussionoffactors thatcouldcauseactualresultsoreventstovaryiscontainedin theAppendixtothispresentationandintheCompany’sSEC filings.

© PPL Corporation 2015 Third Quarter Earnings Results, 2015 Earnings Forecast and Operational Overview U.K. Disclosures: Performance Against Incentives Segment Results and Financial Overview Q&A W. H. Spence V. Sorgi Agenda R. Symons 3
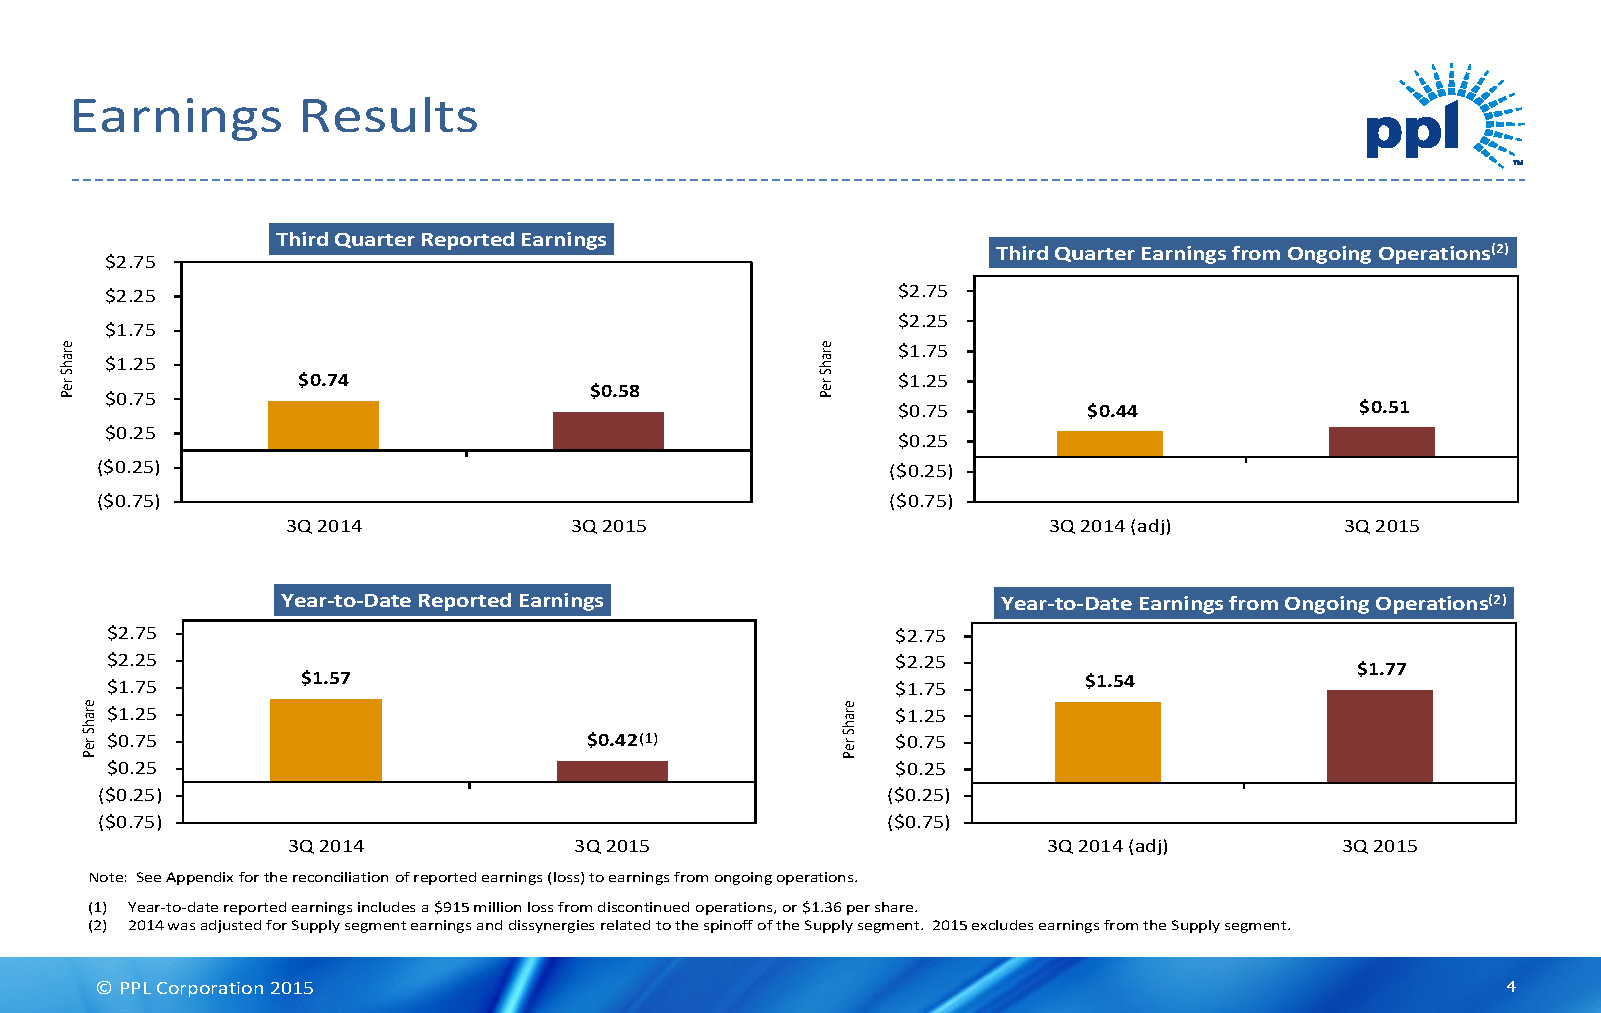
© PPL Corporation 2015 P e r S h a r e Note: See Appendix for the reconciliation of reported earnings (loss) to earnings from ongoing operations. (1) Year-to-date reported earnings includes a $915 million loss from discontinued operations, or $1.36 per share. (2) 2014 was adjusted for Supply segment earnings and dissynergies related to the spinoff of the Supply segment. 2015 excludes earnings from the Supply segment. Earnings Results $0.74 $0.58 ($0.75) ($0.25) $0.25 $0.75 $1.25 $1.75 $2.25 $2.75 3Q 2014 3Q 2015 Third Quarter Reported Earnings $0.44 $0.51 ($0.75) ($0.25) $0.25 $0.75 $1.25 $1.75 $2.25 $2.75 3Q 2014 (adj) 3Q 2015 Third Quarter Earnings from Ongoing Operations (2) P e r S h a r e $1.57 $0.42 ($0.75) ($0.25) $0.25 $0.75 $1.25 $1.75 $2.25 $2.75 3Q 2014 3Q 2015 Year-to-Date Reported Earnings (1) P e r S h a r e $1.54 $1.77 ($0.75) ($0.25) $0.25 $0.75 $1.25 $1.75 $2.25 $2.75 3Q 2014 (adj) 3Q 2015 Year-to-Date Earnings from Ongoing Operations (2) P e r S h a r e 4
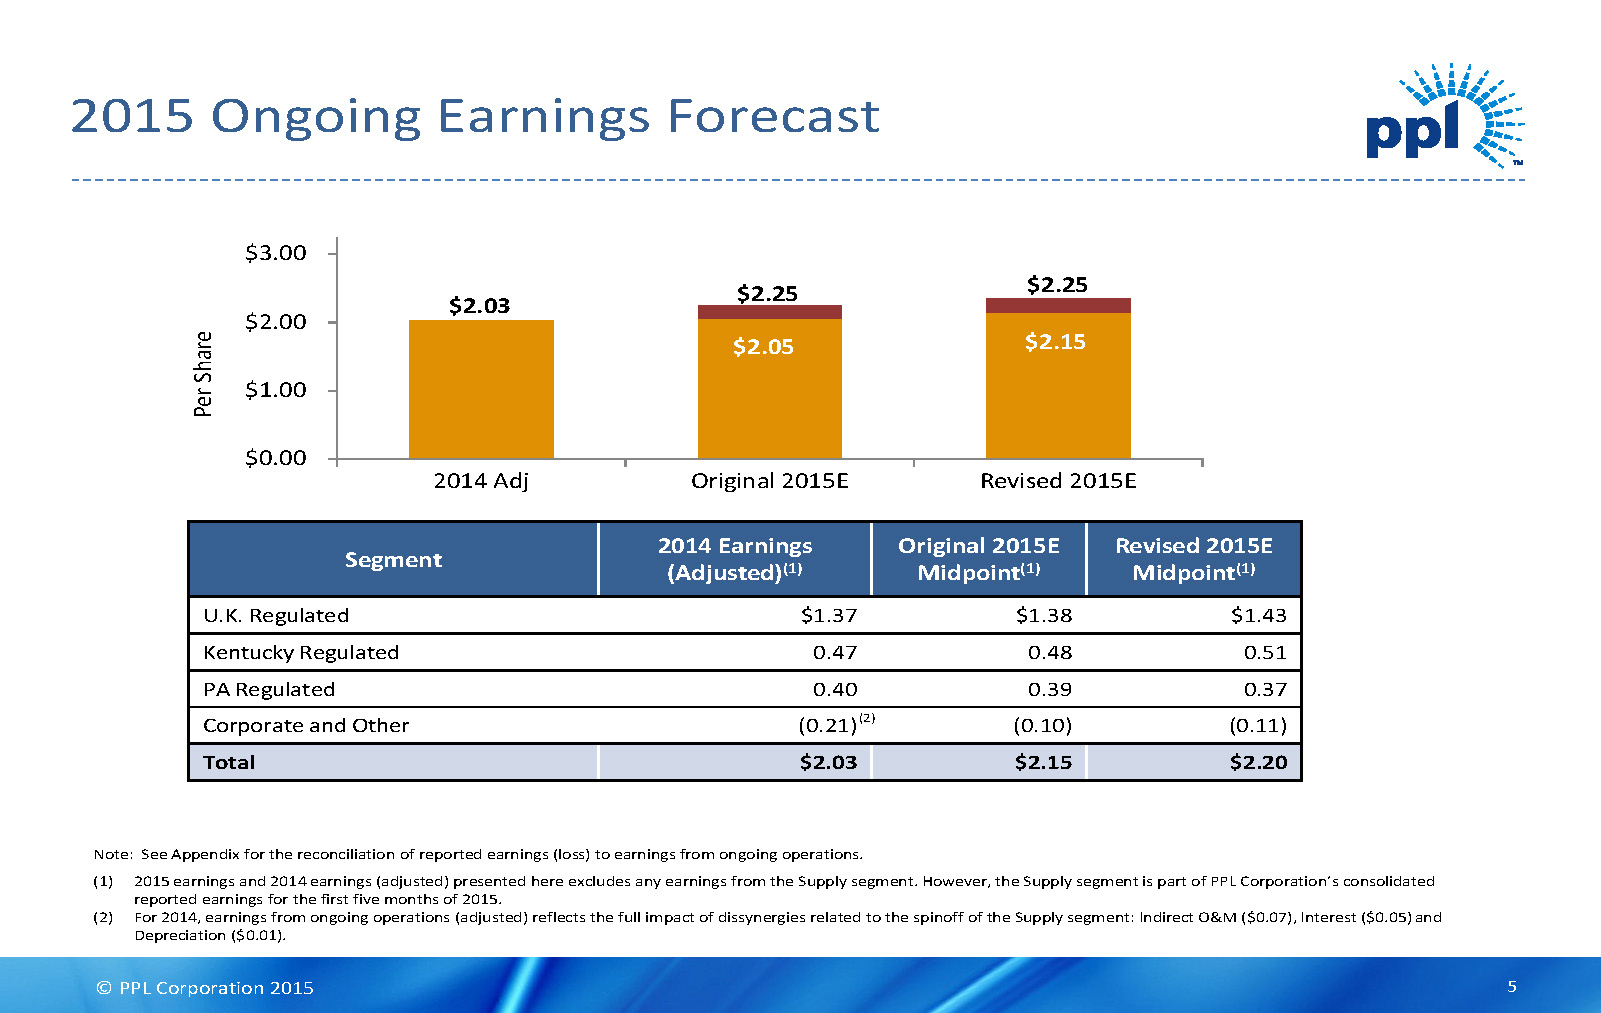
© PPL Corporation 2015 $0.00 $1.00 $2.00 $3.00 2014 Adj Original 2015E Revised 2015E $2.15 P e r S h a r e 2015 Ongoing Earnings Forecast $2.25 $2.03 Note: See Appendix for the reconciliation of reported earnings (loss) to earnings from ongoing operations. (1) 2015 earnings and 2014 earnings (adjusted) presented here excludes any earnings from the Supply segment. However, the Supply segment is part of PPL Corporation’s consolidated reported earnings for the first five months of 2015. (2) For 2014, earnings from ongoing operations (adjusted) reflects the full impact of dissynergies related to the spinoff of the Supply segment: Indirect O&M ($0.07), Interest ($0.05) and Depreciation ($0.01). Segment 2014 Earnings (Adjusted) (1) Original 2015E Midpoint (1) Revised 2015E Midpoint (1) U.K. Regulated $1.37 $1.38 $1.43 Kentucky Regulated 0.47 0.48 0.51 PA Regulated 0.40 0.39 0.37 Corporate and Other (0.21) (0.10) (0.11) Total $2.03 $2.15 $2.20 $2.25 (2) $2.05 5

© PPL Corporation 2015 Pennsylvania • Rate Case Update • Black box settlement reached • Includes an annual revenue increase of $124 million • Subject to approval by the Public Utility Commission • Rate increase expected to take effect January 1, 2016 • Smart Meter Program • 23rd JD Power Award Received • Project Compass Update Kentucky • Environmental Update U.K. • Performance against incentives Operational Overview 6

© PPL Corporation 2015 7 Proposed First Segment: • 95-mile initial segment from Blakely, PA to Ramapo, NY • PPL Electric filed interconnection request with NYISO on October 27th • Estimated cost of $500 -$600 million • Estimated in-service date in 2023 • Benefits as proposed include: • Substantial annual savings for NY customers • Economic development benefits • Grid reliability Full Project Current Plan:475-mile transmission line from Western PA to Southeastern NY at an estimated cost of $3 –$4 billion. Project Compass Summary

© PPL Corporation 2015 Project Compass 8

© PPL Corporation 2015 Pennsylvania • Rate Case Update • Black box settlement reached • Includes an annual revenue increase of $124 million • Subject to approval by the Public Utility Commission • Rate increase expected to take effect January 1, 2016 • Smart Meter Program • 23rd JD Power Award Received • Project Compass Update Kentucky • Environmental Update U.K. • Performance against incentives Operational Overview 9

© PPL Corporation 2015 U.K. Incentive Revenues -Summary • Annual performance above or below the Ofgem targets for Customer Minutes Lost (CML), Customer Interruptions (CI) and the Broad Measure of Customer Satisfaction Survey is rewarded or penalized on a 2-year lag (i.e. 2015/2016 earned performance is received in 2017/2018 revenue). • Rewards/penalties shown on the following slides from the Fast-track Determination are stated in 2012/2013 prices, therefore, we adjust for RPI, as necessary. • WPD is on track to outperform its Ofgem targets in the 2015/2016 regulatory year. • If WPD maintains this level of performance going forward, PPL would expect to earn total incentive revenues that exceed prior estimates for 2017 and 2018. 2017 2018 Revised estimate: $90M -$110M $75M -$105M Previous estimate: $80M -$100M $60M -$ 90M 10

© PPL Corporation 2015 U.K. Incentive Revenue –Quality of Service • WPD is on pace to be near the max reward for Customer Minutes Lost and Customer Interruptions for the 2015/2016 regulatory year. Note: Based on an average for all four DNOs. Actual results calculated at an individual DNO level. (+£14.8) 40.1 28.7 24.4 55.8 0 10 20 30 40 50 60 70 80 Customer Minutes Lost (2012/13 prices) Ofgem Target Projected Max Reward/Penalty Target 63.4 51.1 49.2 77.6 0 10 20 30 40 50 60 70 80 Customer Interruptions (per 100 customers) (2012/13 prices) Ofgem Target Projected Max Reward/Penalty Target (-£40.3) (+£40.3) (-£14.8) 11 A measurement of the cumulative amount of minutes customers are without electricity. A measurement of the cumulative amount of interruptions in a customer’s supply, per 100 customers.

© PPL Corporation 2015 6.5 7.5 8.5 9.5 Interruptions Connections General Inquiries Broad Measure Customer Satisfaction Survey Through September 2015 (2012/13 prices) South West South Wales East Midlands West Midlands Average other DNOs U.K. Incentive Revenue –Customer Satisfaction • The Broad Measure of Customer Satisfaction Survey rewards or penalizes DNOs for the levels of customer satisfaction. • Through September 2015 WPD performance is near or at the max reward levels. Note: Based on an average for all four DNOs. Actual results calculated at an individual DNO level. South West South Wales East Midlands West Midlands Total Max reward/penalty +/-£2.8 +/-£1.9 +/-£4.0 +/-£4.0 +/-£12.7 Max Reward Breakeven Max Penalty 12

© PPL Corporation 2015 DRAFT Summary Financial Highlights 13

© PPL Corporation 2015 Q3 2015 Q3 2014 (adj) Change Pennsylvania Regulated $0.08 $0.08 $0.00 Kentucky Regulated 0.16 0.12 0.04 U.K. Regulated 0.29 0.28 0.01 Corporate and Other (0.02) (0.04) 0.02 Total $0.51 $0.44 $0.07 Ongoing Earnings Overview Note: See Appendix for the reconciliation of reported earnings (loss) to earnings from ongoing operations. 14

© PPL Corporation 2015 3rd Quarter 2014 EPS –Ongoing Earnings $0.08 Gross delivery margins 0.03 Operation and maintenance (0.02) Depreciation (0.01) Total (0.00) 2015 EPS –Ongoing Earnings $0.08 Pennsylvania Regulated Segment Earnings Drivers Note: See Appendix for the reconciliation of reported earnings (loss) to earnings from ongoing operations. 15

© PPL Corporation 2015 3rd Quarter 2014 EPS –Ongoing Earnings $0.12 Gross margins 0.05 Other (0.01) Total 0.04 2015 EPS –Ongoing Earnings $0.16 Kentucky Regulated Segment Earnings Drivers Note: See Appendix for the reconciliation of reported earnings (loss) to earnings from ongoing operations. 16

© PPL Corporation 2015 3rd Quarter 2014 EPS –Ongoing Earnings $0.28 Utility revenues (0.05) Operation and maintenance (0.01) Depreciation 0.02 Income taxes and other 0.05 Total 0.01 2015 EPS –Ongoing Earnings $0.29 U.K. Regulated Segment Earnings Drivers Note: See Appendix for the reconciliation of reported earnings (loss) to earnings from ongoing operations. 17

© PPL Corporation 2015 Foreign Currency Hedging Status and RPI Sensitivity 18 GBP Foreign Currency 2015 2016 2017 Percentage Hedged 100% 83% 66% Hedged Rate (GBP/USD) $1.54 $1.60 $1.60 Budgeted Rate on Open Position (GBP/USD) $1.60 $1.60 $1.60 EPS Sensitivities: Decrease in Rate (USD/GBP) (1) 0.05 $0.00 ($0.01) ($0.02) 0.10 $0.00 ($0.02) ($0.03) Decrease in 2015/2016 RPI (budget assumption 1.6%) (2) 0.5% $0.00 $0.00 ($0.02) 2015/16 2016/17 2017/18 Budget RPI assumption 1.6% 2.8% 3.0% Current U.K. HM Treasury RPI forecast 1.6% 2.8% 3.1% Note: FX hedging status as of 9/30/2015. (1) FX sensitivities do not factor in the potential positive effect from restriking existing hedges. (2) Sensitivities includes the net effect on revenue, O&M and interest expense on index-linked debt. Change in EPS

© PPL Corporation 2015 U.K. Regulated Segment EPS from Ongoing Operations Projection ($ Per Share) Note: See Appendix for the reconciliation of reported earnings (loss) to earnings from ongoing operations. Assumes foreign currency exchange rate of $1.60/£ for 2015E and 2016E on open positions. 19

© PPL Corporation 2015 DRAFT Appendix 20

© PPL Corporation 2015 Note: Corporate and Other capital expenditures average approximately $5million per year. (1) WPD figures based on assumed exchange rate of $1.60/£. (2) Expect between 80% and 90% to receive timely returns via ECR mechanism based on historical experience and future projections. Significant Ongoing Capital Expenditure Program… ($ in billions) $3.61 $3.33 $3.33 $3.53 $3.78 (1) (2) ~$18 billion of Capital Expenditures from 2015 –2019 to strengthen safety and reliability of T&D systems and address environmental regulations in Kentucky. • Over 80% of Regulated capital expenditures earn returns subject to minimal or no lag • PA –Implementation of ~$450 million Smart Meter Program to be recovered through a rider mechanism (~$328 million of Capital; ~$122 million O&M) • PA and KY –Continued focus on improving reliability in both Transmission and Distribution systems • KY –Environmental spending in response to regulations for Mercury, SO2, NOX, Ozone, Particulates, Water Discharge and CCRs (does not include Clean Power Plan) • U.K. –Continued focus on asset replacement, faults and overheads and general system reinforcement 21

© PPL Corporation 2015 ( $ i n b i l l i o n s ) (1) WPD figures based on assumed exchange rate of $1.60/£ for 2015 -2019. (2) Represents utility capitalization for LKE. Represents Regulatory Asset Value (RAV) for WPD. Strong regulated rate base growth will drive EPS growth. …Critical to Driving Strong Rate Base Growth $32.1 $30.1 $28.0 $26.2 $24.6 $22.9 (2) (1) 22

© PPL Corporation 2015 U.K. Regulated Segment Cash Repatriation Note: Assumes foreign currency exchange rate of $1.60/£ for 2015E, 2016E and 2017E. ($ in millions) Flexible strategy for meaningful U.K. cash repatriation. 23

© PPL Corporation 2015 Note: Total includes Residential, Commercial and Industrial customer classes as well as “Other”, which is not depicted on the charts above. U.S. Regulated Volume Variances Residential Commercial Industrial Total Residential Commercial Industrial Total Weather-Normalized (charted) -0.5% 0.7% -2.2% -0.6% -1.1% -1.0% 0.4% -0.5% Actual 4.6% 2.6% -1.4% 2.0% -0.7% -1.0% 0.7% -3.3% Residential Commercial Industrial Total Residential Commercial Industrial Total Weather-Normalized (charted) 3.4% 2.0% 1.9% 2.5% -0.4% 1.0% 0.7% 0.3% Actual 8.6% 4.6% 1.9% 5.3% 1.1% 1.8% 0.7% 1.2% 24

© PPL Corporation 2015 Kentucky Environmental Controls Low Nox Burners SCR/SNCR Scrubbers Closed Cycle Cooling Tower Dry Handling/ Disposal/ Beneficial Use Baghouses NO x NO x SO 2 Water Intake Coal Combustion Residuals (CCRs) (2) Hg (Particulates) Unit 1 x x x x (1) (3b) Unit 2 x x x x (1) x Unit 1 x x x x x x Unit 2 x (4) x x x (3c) Unit 3 x x x x x x Unit 4 x x x x x x Unit 1 x (4) x x (1) (4) Unit 2 x (4) x x (1) (4) Unit 3 x x x x (1) (3a) Unit 1 x (4) x (4) x x Unit 2 x (4) x x x x Unit 3 x x x x x (3d) Unit 4 x x x x x x x = Installed (1) Dry handling disposal construction approved by KPSC and permitting or construction underway at Trimble and Brown. Portions of Ghent systems are operational at this time as other construction activity continues. (2) Wet ash impoundments exist at all plants. (3) Baghouses construction approved by KPSC and construction activity underway at Trimble, Ghent, Brown, and Mill Creek. (3a) Brown 3's commissioning scheduled to start in November 2015. (3b) Trimble County 1's commissioning scheduled to start in November 2015. (3c) Ghent 2's commissioning scheduled to start in December 2015. (3d) Mill Creek 3's commissioning scheduled to start in June 2016. (4) Standards are station and company based. KU and LG&E Systems are already in compliance. Control Device Addresses Trimble County Ghent Brown Mill Creek 25

© PPL Corporation 2015 Funding the Growth Strong domestic operating cash flows plus the U.K. dividend sufficient to fund the PPL dividend. Domestic debt and equity issuances fund domestic utility growth. (3) 2013A (4) 2014A (4) 2015E (5) Domestic Cash from Operations $1,707 $2,219 $1,610 Domestic Maintenance Capex (1) (861) (900) (650) Dividend From UK Regulated 261 277 290 Cash Available for Distribution $1,107 $1,596 $1,250 Common Dividend (878) (967) (1,000) Cash Available for Reinvestment $229 $629 $250 Domestic Growth Capex ($2,142) ($1,816) ($1,615) Debt Maturities ($747) ($546) ($1,000) Debt Issuances and Change in Cash (2) 1,343 (159) 2,243 Equity Issuances 1,330 1,063 200 Other Investing & Financing Activities (13) 829 (78) Additional Funding Sources for Domestic Growth Capex $1,913 $1,187 $1,365 Note: Information provided on this slide to be updated on an annual basis. See appendix for the reconciliation of Domestic Ca sh from Operations. (1) Represents book depreciation. (2) Includes domestic issuances (short and long term), net of issue costs. (3) Includes approximately $900 million of proceeds from sale of the Montana hydros. (4) Includes results of PPL Energy Supply, LLC. (5) Full year projections do not include activity related to PPL Energy Supply, LLC for any portion of 2015. 26

© PPL Corporation 2015 ($ in millions) 2015 2016 2017 2018 2019 PPL Capital Funding $0 $0 $0 $250 $0 PPL Electric Utilities 100 0 0 0 0 LG&E and KU Energy 400 0 0 0 0 Louisville Gas & Electric (1) 250 25 194 98 40 Kentucky Utilities 250 0 0 0 0 WPD 0 460 100 0 0 Total 1,000 485 294 348 40 Debt Maturities Note: As of September 30, 2015. (1) Louisville Gas & Electric has several municipal bonds that may be put by the holders before the bonds’ final maturities. These amounts reflect the timing of any put option in 2016 through 2019. 27

© PPL Corporation 2015 Liquidity Profile Note: As of September 30, 2015. Entity Facility Expiration Date Capacity (Millions) Letters of Credit & Commercial Paper Issued (Millions) Borrowed (Millions) Unused Capacity (Millions) PPL Capital Funding Syndicated Credit Facility Nov-2018 $300 $0 $0 $300 Syndicated Credit Facility Jul-2019 300 0 0 300 Bilateral Credit Facility Mar-2016 150 20 0 130 $750 $20 $0 $730 PPL Electric Utilities Syndicated Credit Facility Jul-2019 $300 $69 $0 $231 LG&E and KU Energy (LKE) Syndicated Credit Facility Oct-2018 $75 $0 $75 $0 Louisville Gas & Electric Syndicated Credit Facility Jul-2019 $500 $0 $0 $500 Kentucky Utilities Syndicated Credit Facility Jul-2019 $400 $0 $0 $400 Letter of Credit Facility Oct-2017 198 198 0 0 $598 $198 $0 $400 WPD WPD Plc. Syndicated Credit Facility Dec-2016 £210 £0 £127 £83 WPD (South West) Syndicated Credit Facility Jul-2020 245 0 0 245 WPD (East Midlands) Syndicated Credit Facility Jul-2020 300 0 139 161 WPD (West Midlands) Syndicated Credit Facility Jul-2020 300 0 0 300 Uncommitted Credit Facilities 65 4 0 61 £1,120 £4 £266 £850 Strong liquidity position to fund current operations and growth. 28

© PPL Corporation 2015 WPD Holding Company LKE Holding Company PPL Electric UtilitiesLKE Operating Companies PPL Capital Funding Credit Rating Secured Unsecured Long-term Issuer Outlook S&P NR BBB+ NR Stable Moody’s NR Baa2 NR Stable Credit Rating Secured Unsecured Long-term Issuer Outlook S&P NR BBB+ A- Stable Moody’s NR Baa3 Baa3 Stable WPD Operating Companies Credit Rating Secured Unsecured Long-term Issuer Outlook S&P NR A- A- Stable Moody’s NR Baa1 Baa1 Stable Credit Rating Secured Unsecured Long-term Issuer Outlook S&P A NR A- Stable Moody’s A1 NR A3 Stable Credit Rating Secured Unsecured Long-term Issuer Outlook S&P NR BBB+ A- Stable Moody’s NR Baa1 Baa1 Stable Credit Rating Secured Unsecured Long-term Issuer Outlook S&P A NR A- Stable PPL Corporation Credit Rating Secured Unsecured Long-term Issuer Outlook S&P NR NR A- Stable Moody’s NR NR Baa2 Stable Strong Credit Ratings Post-Spin Strong credit profile at our utilities, holding companies and PPL Corporation. Moody’s A1 NR A3 Stable 29

© PPL Corporation 2015 Reconciliation of Segment Reported Earnings (Loss) to Earnings from Ongoing Operations (1) Includes an $879 million charge reflecting the difference between PPL's recorded value for the Supply segment and the estimated fair value determined in accordance with applicable accounting rules under GAAP. Reported Earnings (Loss) $ 249 $ 111 $ 55 $ (18) $ (4) $ 393 $ 814 $ 267 $ 191 $ (73) $ (916) $ 283 Less: Special Items (expense) benefit: Foreign currency-related economic hedges 54 54 20 20 Spinoff of the Supply segment: Discontinued operations (4) (4) (916) (916) Transition and transaction costs (1) (1) (16) (16) Employee transitional services (1) (1) (4) (4) Separation benefits (1) (1) (3) (3) Other: WPD Midlands acquisition-related adjustment 2 2 Settlement of certain income tax positions 18 18 Certain valuation allowances (8) (8) LKE acquisition-related adjustment (1) (1) (5) (5) Total Special Items 54 (1) (3) (4) 46 40 (13) (23) (916) (912) Earnings from Ongoing Operations $ 195 $ 112 $ 55 $ (15) $ $ 347 $ 774 $ 280 $ 191 $ (50) $ $ 1,195 U.K. KY PA Corp. & Other Disc. Total Corp. Reg. Reg. Reg. Ops. (1) U.K. KY PA Corp. & Other Disc. Total Corp. Reg. Reg. After-Tax (Unaudited) 3rd Quarter Year-to-Date September 30, 2015 September 30, 2015 (millions of dollars) Reg. Ops. 30

© PPL Corporation 2015 Reconciliation of Segment Reported Earnings (Loss) to Earnings from Ongoing Operations (1) Includes an $879 million charge reflecting the difference between PPL's recorded value for the Supply segment and the estimated fair value determined in accordance with applicable accounting rules under GAAP. Reported Earnings (Loss) $ 0.37 $ 0.16 $ 0.08 $ (0.02) $ (0.01) $ 0.58 $ 1.21 $ 0.40 $ 0.28 $ (0.11) $ (1.36) $ 0.42 Less: Special Items (expense) benefit: Foreign currency-related economic hedges 0.08 0.08 0.03 0.03 Spinoff of the Supply segment: Discontinued operations (0.01) (0.01) (1.36) (1.36) Transition and transaction costs (0.02) (0.02) Employee transitional services (0.01) (0.01) Other: Settlement of certain income tax positions 0.03 0.03 Certain valuation allowances (0.01) (0.01) LKE acquisition-related adjustment (0.01) (0.01) Total Special Items 0.08 (0.01) 0.07 0.06 (0.02) (0.03) (1.36) (1.35) Earnings from Ongoing Operations $ 0.29 $ 0.16 $ 0.08 $ (0.02) $ $ 0.51 $ 1.15 $ 0.42 $ 0.28 $ (0.08) $ $ 1.77 After-Tax (Unaudited) 3rd Quarter Year-to-Date (per share - diluted) September 30, 2015 September 30, 2015 Reg. Ops. U.K. KY PA Corp. & Other Disc. Total Corp. Reg. Reg. Reg. Ops. (1) U.K. KY PA Corp. & Other Disc. Total Corp. Reg. Reg. 31

© PPL Corporation 2015 Reconciliation of Segment Reported Earnings (Loss) to Earnings from Ongoing Operations (Adjusted) (1) Certain amounts have been reclassified to reflect the Supply segment as a discontinued operation. (2) Represents 2014 costs allocated to the Supply segment that remained with PPL after the spinoff of the Supply segment. Reported Earnings (Loss) $ 295 $ 82 $ 57 $ (24) $ 87 $ 497 $ 688 $ 247 $ 194 $ (100) $ 13 $ 1,042 Less: Special Items (expense) benefit: Foreign currency-related economic hedges 111 111 72 72 Spinoff of the Supply segment: Supply segment earnings 86 86 16 16 Discontinued operations adjustments (1) 1 (7) 7 Change in tax valuation allowances (3) (3) (49) (49) Transition and transaction costs (3) (3) (3) (10) (13) Separation benefits (11) (11) (11) (11) Other: Change in WPD line loss accrual (52) (52) EEI adjustments (1) (1) Separation benefits 2 2 (2) (2) Total Special Items 111 (1) 2 (18) 87 181 20 (2) (70) 13 (39) Indirect operation and maintenance 10 10 35 35 Interest expense 7 7 22 22 Depreciation 2 2 5 5 Total dissynergies-spinoff of Supply segment 19 19 62 62 Earnings from Ongoing Operations (Adjusted) $ 184 $ 83 $ 55 $ (25) $ $ 297 $ 668 $ 247 $ 196 $ (92) $ $ 1,019 3rd Quarter Year-to-Date (millions of dollars) September 30, 2014 September 30, 2014 After-Tax (Unaudited) expense (benefit): (2) Dissynergies-spinoff of Supply segment U.K. KY PA Corp. & Other (1) Disc. Total Corp. Reg. Reg. Reg. Ops. (1) U.K. KY PA Corp. & Other (1) Disc. Total Corp. Reg. Reg. Reg. Ops. (1) 32

© PPL Corporation 2015 Reconciliation of Segment Reported Earnings (Loss) to Earnings from Ongoing Operations (Adjusted) (1) The "If-Converted Method" has been applied to PPL's 2011 Equity Units, resulting in $9 million of interest charges (after-tax) being added back to earnings and approximately 14 million shares of PPL Common Stock being treated as outstanding. Both adjustments are only for purposes of calculating diluted earnings pershare. (2) Certain amounts have been reclassified to reflect the Supply segment as a discontinued operation. (3) Represents 2014 costs allocated to the Supply segment that remained with PPL after the spinoff of the Supply segment. Reported Earnings (Loss) $ 0.44 $ 0.12 $ 0.09 $ (0.04) $ 0.13 $ 0.74 $ 1.04 $ 0.37 $ 0.29 $ (0.15) $ 0.02 $ 1.57 Less: Special Items (expense) benefit: Foreign currency-related economic hedges 0.16 0.16 0.11 0.11 Spinoff of the Supply segment: Supply segment earnings 0.13 0.13 0.02 0.02 Discontinued operations adjustments (0.01) 0.01 Change in tax valuation allowances (0.01) (0.01) (0.07) (0.07) Transition and transaction costs (0.01) (0.01) (0.02) Separation benefits (0.02) (0.02) (0.02) (0.02) Other: Change in WPD line loss accrual (0.08) (0.08) Separation benefits 0.01 0.01 Total Special Items 0.16 0.01 (0.03) 0.13 0.27 0.03 (0.11) 0.02 (0.06) Dissynergies-spinoff of Supply segment Indirect operation and maintenance 0.02 0.02 0.05 0.05 Interest expense 0.01 0.01 0.03 0.03 Depreciation 0.01 0.01 Total dissynergies-spinoff of Supply segment 0.03 0.03 0.09 0.09 Earnings from Ongoing Operations (Adjusted) $ 0.28 $ 0.12 $ 0.08 $ (0.04) $ $ 0.44 $ 1.01 $ 0.37 $ 0.29 $ (0.13) $ $ 1.54 After-Tax (Unaudited) 3rd Quarter Year-to-Date (per share - diluted) September 30, 2014 September 30, 2014 (1) Ops. (2) U.K. KY PA Corp. & Other (2) Disc. Total Corp. Reg. Reg. Reg. Ops. (2) U.K. KY PA Corp. & Other (2) Disc. Total Corp. Reg. Reg. Reg. expense (benefit): (3) 33

© PPL Corporation 2015 Reconciliation of Segment Reported Earnings (Loss) to Earnings from Ongoing Operations (Adjusted) (1) The "If-Converted Method" has been applied to PPL's 2011 Equity Units, resulting in $9 million of interest charges (after-tax) being added back to earnings and approximately 11 millionshares of PPL Common Stock being treated as outstanding. Both adjustments are only for purposes of calculating diluted earningsper share. (2) Certain amounts have been reclassified to reflect the Supply segment as a discontinued operation. (3) Represents 2014 costs allocated to the Supply segment that remained with PPL after the spinoff of the Supply segment. $ 1.48 $ 0.47 $ 0.39 $ (0.18) $ 0.45 $ 2.61 0.19 0.19 Discontinued operations (0.01) 0.45 0.44 Change in tax valuation allowances (0.07) (0.07) Separation benefits (0.02) (0.02) Change in WPD line loss accrual (0.08) (0.08) Separation benefits (0.01) (0.01) 0.11 (0.01) (0.10) 0.45 0.45 Indirect operation and maintenance 0.07 0.07 Interest expense 0.05 0.05 Depreciation 0.01 0.01 0.13 0.13 $ 1.37 $ 0.47 $ 0.40 $ (0.21) $ $ 2.03 Total dissynergies-spinoff of Supply segment Earnings from Ongoing Operations (Adjusted) Spinoff of the Supply segment: Other: Total Special Items Dissynergies-spinoff of Supply segment expense (benefit): (3) Reg.Reg. Reported Earnings (Loss) Less: Special Items (expense) benefit: Foreign currency-related economic hedges Other (2) Ops. (2) TotalReg. U.K. KY PA Corp. & Disc. Year-to-Date December 31, 2014 (per share - diluted) (1) After-Tax (Unaudited) 34

© PPL Corporation 2015 Reconciliation of PPL's Forecast of Reported Earnings (Loss) to Earnings from Ongoing Operations (1) Includes an $879 million charge reflecting the difference between PPL's recorded value for the Supply segment and the estimated fair value determined in accordance with applicable accounting rules under GAAP. $ 1.49 $ 0.49 $ 0.37 $ (0.14) $ (1.36) $ 0.85 $ 0.90 $ 0.80 0.03 0.03 0.03 0.03 Discontinued operations (1.36) (1.36) (1.36) (1.36) Transition and transaction costs (0.02) (0.02) (0.02) (0.02) Employee transitional services (0.01) (0.01) (0.01) (0.01) Settlement of certain income tax positions 0.03 0.03 0.03 0.03 Certain valuation allowances (0.01) (0.01) (0.01) (0.01) LKE acquisition-related adjustment (0.01) (0.01) (0.01) (0.01) 0.06 (0.02) (0.03) (1.36) (1.35) (1.35) (1.35) $ 1.43 $ 0.51 $ 0.37 $ (0.11) $ $ 2.20 $ 2.25 $ 2.15 Forecast (per share - diluted) 2015 Midpoint After-Tax (Unaudited) U.K. KY PA Corp. Disc. High Low Total 2015 2015& Other Ops. (1) Foreign currency-related economic hedges Spinoff of the Supply segment: Other: Total Special Items Earnings from Ongoing Operations Reported Earnings (Loss) Less: Special Items (expense) benefit: Reg. Reg. Reg. 35
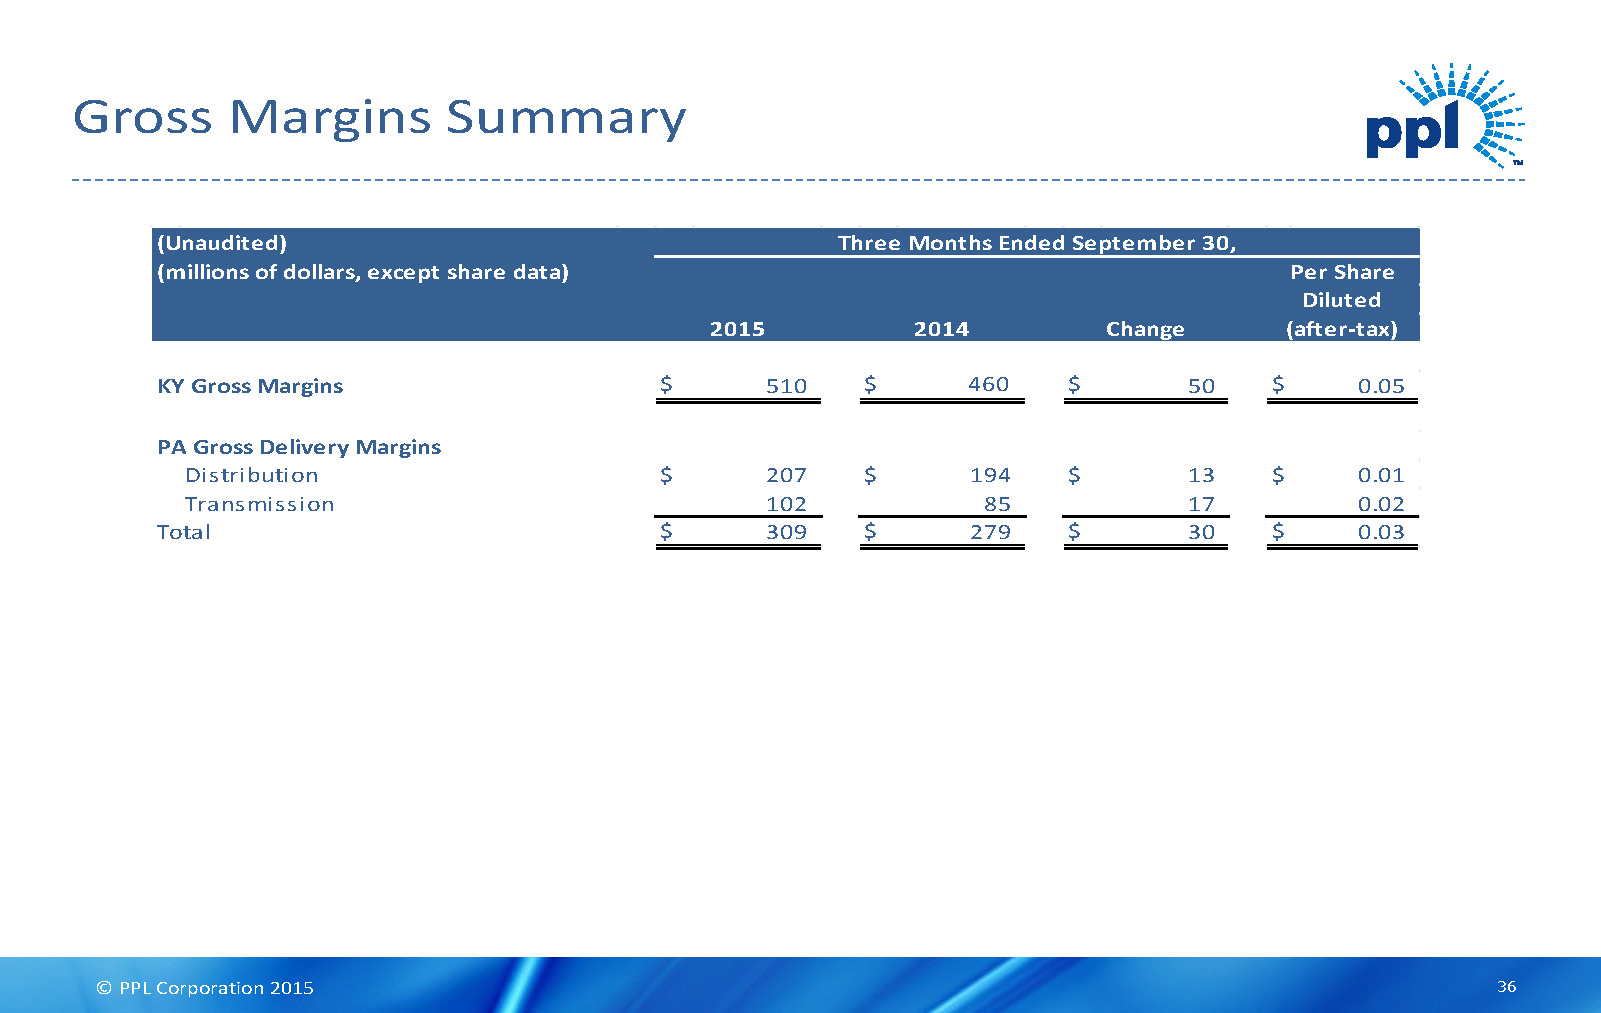
© PPL Corporation 2015 Gross Margins Summary $ 510 $ 460 $ 50 $ 0.05 Distribution $ 207 $ 194 $ 13 $ 0.01 Transmission 102 85 17 0.02 $ 309 $ 279 $ 30 $ 0.03 Total Three Months Ended September 30, Per Share Diluted 2015 2014 Change (after-tax) KY Gross Margins PA Gross Delivery Margins (Unaudited) (millions of dollars, except share data) 36

© PPL Corporation 2015 Reconciliation of Third Quarter Margins to Operating Income $ 801 $ 519 $ 558 $ 1,878 $ 753 $ 477 $ 649 $ 1,879 228 228 240 240 23 154 177 24 128 21 173 20 (20) 28 31 423 482 27 25 415 467 11 215 226 2 231 233 1 25 53 79 25 53 78 Total Operating Expenses 291 210 691 1,192 293 198 700 1,191 $ 510 $ 309 $ (133) $ 686 $ 460 $ 279 $ (51) $ 688 Other Income Margins Other Income Margins Margins Three Months Ended September 30, 2014(Unaudited) PA Gross Gross Delivery Operating Gross Delivery Kentucky PA Gross Kentucky Operating Total Three Months Ended September 30, 2015 Operating Expenses Fuel Energy purchases Other operation and maintenance Depreciation Taxes, other than income Energy purchases from affiliate (millions of dollars) Margins Operating Revenues 37

© PPL Corporation 2015 Reconciliation of Domestic Cash Flows Note: For 2015, due to the generalized and forward-looking nature of this information, the Company has not reconciled the presented non-GAAP financial measures to the most directly comparable GAAP financial measures. (1) Primarily represents PPL Global, LLC items that eliminate in PPL's consolidation. (2) Adjustment to exclude domestic change in cash and cash equivalents. Year Ended December 2014 Additional (Millions of Dollars) Domestic Domestic Funding Sources PPL Consolidated Cash from Cash Available Cash Available Growth for Domestic Statement of Operations for Distribution for Reinvestment Capex Growth Capex PPL Global, LLC Other Cash Flows Cash provided by (used in) operating activities 2,219$ 1,184$ 3,403$ Cash provided by (used in) investing activities (900)$ (1,816)$ 829$ (1,442) (3,329) Cash provided by (used in) financing activities (967)$ 1,451 (86) 185$ (1) 583 Effect of exchange rates on cash and cash equivalents (8) (8) Domestic (increase) decrease in cash and cash equivalents 277 (1,093) 816 (2) 2,219$ 2,219 1,596$ 1,596 Total 629$ (1,816)$ 1,187$ (352)$ 1,001$ 649$ Year Ended December 2013 Additional (Millions of Dollars) Domestic Domestic Funding Sources PPL Consolidated Cash from Cash Available Cash Available Growth for Domestic Statement of Operations for Distribution for Reinvestment Capex Growth Capex PPL Global, LLC Other Cash Flows Cash provided by (used in) operating activities 1,707$ 1,150$ 2,857$ Cash provided by (used in) investing activities (861)$ (2,142)$ (13)$ (1,279) (4,295) Cash provided by (used in) financing activities (878)$ 1,779 534 196$ (1) 1,631 Effect of exchange rates on cash and cash equivalents 8 8 Domestic (increase) decrease in cash and cash equivalents 261 147 (408) (2) 1,707$ 1,707 1,107$ 1,107 Total 229$ (2,142)$ 1,913$ 413$ (212)$ 201$ Reconciling Items Reconciling Items 38

© PPL Corporation 2015 Statementscontainedinthispresentation,includingstatementswithrespecttofutureearnings,cashflows,financing,regulationandcorporate strategyare"forward-lookingstatements"withinthemeaningofthefederalsecuritieslaws.AlthoughPPLCorporationbelievesthatthe expectationsandassumptionsreflectedintheseforward-lookingstatementsarereasonable,thesestatementsaresubjecttoanumberofrisksand uncertainties,andactualresultsmaydiffermateriallyfromtheresultsdiscussedinthestatements.Thefollowingareamongtheimportantfactors thatcouldcauseactualresultstodiffermateriallyfromtheforward-lookingstatements:marketdemandforenergyinourserviceterritories, weatherconditionsaffectingcustomerenergyusageandoperatingcosts;theeffectofanybusinessorindustryrestructuring,includingtheability ofPPLCorporationtorealizeallorasignificantportionoftheanticipatedcostsavingsfromthecorporaterestructuringfollowingtheSupply businessspinoff;theprofitabilityandliquidityofPPLCorporationanditssubsidiaries;newaccountingrequirementsornewinterpretationsor applicationsofexistingrequirements;operatingperformanceofourfacilities;thelengthofscheduledandunscheduledoutagesatourgenerating plants;environmentalconditionsandrequirementsandtherelatedcostsofcompliance;systemconditionsandoperatingcosts;developmentof newprojects,marketsandtechnologies;performanceofnewventures;assetorbusinessacquisitionsanddispositions;anyimpactofhurricanesor othersevereweatheronourbusiness;receiptofnecessarygovernmentpermits,approvals,ratereliefandregulatorycostrecovery;capitalmarket conditionsanddecisionsregardingcapitalstructure;theimpactofstate,federalorforeigninvestigationsapplicabletoPPLCorporationandits subsidiaries;theoutcomeoflitigationagainstPPLCorporationanditssubsidiaries;stockpriceperformance;themarketpricesofequitysecurities andtheimpactonpensionincomeandresultantcashfundingrequirementsfordefinedbenefitpensionplans;thesecuritiesandcreditratingsof PPLCorporationanditssubsidiaries;political,regulatoryoreconomicconditionsinstates,regionsorcountrieswherePPLCorporationorits subsidiariesconductbusiness,includinganypotentialeffectsofthreatenedoractualterrorismorwarorotherhostilities;Britishpoundsterlingto U.S.dollarexchangerates;newstate,federalorforeignlegislation,includingnewtaxlegislation;andthecommitmentsandliabilitiesofPPL Corporationanditssubsidiaries.Anysuchforward-lookingstatementsshouldbeconsideredinlightofsuchimportantfactorsandinconjunction withPPLCorporation'sForm10-KandotherreportsonfilewiththeSecuritiesandExchangeCommission. Forward-Looking Information Statement 39

© PPL Corporation 2015 Definitions of Non-GAAP Financial Measures "Earnings from ongoing operations," should not be considered as an alternative to reported earnings, or net income, which is an indicator of operating performance determined in accordance with U.S. generally accepted accounting principles (GAAP). PPL believes that "earnings from ongoing operations," although a non-GAAP financial measure, is also useful and meaningful to investors because it provides management's view of PPL's earnings excluding the Supply segment, as the spinoff was completed June 1, 2015. Other companies may use different measures to present financial performance. "Earnings from ongoing operations" is adjusted for the impact of special items as described below, which includes the Supply segment's earnings now reflected in discontinued operations. Also included in special items is the loss on spinoff resulting from the fair value of the Supply segment being less than PPL's recorded value as of June 1, 2015, the date of the spinoff. "Earnings from ongoing operations (adjusted)" for 2014 also reflects, within the Corporate and Other category, the impact of spinoff dissynergies that would remain with PPL after the completion of the transaction, if left unmitigated. "Earnings from ongoing operations" is adjusted for the impact of special items. Special items include: • Unrealized gains or losses on foreign currency-related economic hedges. • Supply segment discontinued operations. • Loss on the spinoff of the Supply segment. • Gains and losses on sales of assets not in the ordinary course of business. • Impairment charges. • Workforce reduction and other restructuring effects. • Acquisition and divestiture-related adjustments. • Other charges or credits that are, in management's view, not reflective of the company's ongoing operations. 40

© PPL Corporation 2015 Definitions of Non-GAAP Financial Measures PPLutilizesthefollowingnon-GAAPfinancialmeasuresasindicatorsofperformanceforitsbusinesses.Thesemeasuresarenotintendedtoreplace "OperatingIncome,"whichisdeterminedinaccordancewithGAAP,asanindicatorofoveralloperatingperformance. Othercompaniesmayuse differentmeasurestoanalyzeandreporttheirresultsofoperations. Managementbelievesthesemeasuresprovideadditionalusefulcriteriato makeinvestmentdecisions.Theseperformancemeasuresareused,inconjunctionwithotherinformation,byseniormanagementandPPL'sBoard ofDirectorstomanagetheoperationsandanalyzeactualresultscomparedwithbudget. "KentuckyGrossMargins"isasinglefinancialperformancemeasureoftheelectricitygeneration,transmissionanddistributionoperationsofthe KentuckyRegulatedsegment,LKE,LG&EandKU,aswellastheKentuckyRegulatedsegment's,LKE'sandLG&E'sdistributionandsaleofnatural gas. Incalculatingthismeasure,fuel,energypurchasesandcertainvariablecostsofproduction(recordedas"Otheroperationandmaintenance" ontheStatementsofIncome)aredeductedfromrevenues. Inaddition,certainotherexpenses,recordedas"Otheroperationandmaintenance", "Depreciation"and"Taxes,otherthanincome"ontheStatementsofIncome,associatedwithapprovedcostrecoverymechanismsareoffset againsttherecoveryofthoseexpenses,whichareincludedinrevenues.Thesemechanismsallowfordirectrecoveryoftheseexpensesand,insome cases,returnsoncapitalinvestmentsandperformanceincentives. Asaresult,thismeasurerepresentsthenetrevenuesfromelectricityandgas operations. "PennsylvaniaGrossDeliveryMargins"isasinglefinancialperformancemeasureoftheelectricitydeliveryoperationsofthePennsylvania RegulatedsegmentandPPLElectric,whichincludestransmissionanddistributionactivities. Incalculatingthismeasure,utilityrevenuesand expensesassociatedwithapprovedrecoverymechanisms,includingenergyprovidedasaPLR,areoffsetwithminimalimpactonearnings. Costs associatedwiththesemechanismsarerecordedin"Energypurchases,""Otheroperationandmaintenance,"whichisprimarilyAct129costs,and "Taxes,otherthanincome,"whichisprimarilygrossreceiptstax. ThisperformancemeasureincludesPLRenergypurchasesbyPPLElectricfrom PPLEnergyPlus,whicharereflectedin"Energypurchasesfromaffiliate"inthereconciliationtables.AsaresultofthespinoffoftheSupplysegment andcreationofTalenEnergyonJune1,2015,PPLEnergyPlus(renamedTalenEnergyMarketing)isnolongeranaffiliateofPPLElectric. PPL Electric'spurchasesfromTalenEnergyMarketingsubsequenttoMay31,2015arereflectedin"EnergyPurchases"inthereconciliationtables.This measurerepresentsthenetrevenuesfromthePennsylvaniaRegulatedsegment'sandPPLElectric'selectricitydeliveryoperations. 41
PPL (NYSE:PPL)
Historical Stock Chart
From Apr 2024 to May 2024

PPL (NYSE:PPL)
Historical Stock Chart
From May 2023 to May 2024
