BlackRock Income Portfolio Update
April 23 2021 - 7:00AM
UK Regulatory
TIDMBRIG

The information contained in this release was correct as at 31 March 2021.
Information on the Company's up to date net asset values can be found on the
London Stock Exchange Website at:

https://www.londonstockexchange.com/exchange/news/market-news/
market-news-home.html.

BLACKROCK INCOME & GROWTH INVESTMENT TRUST PLC (LEI:5493003YBY59H9EJLJ16)

All information is at 31 March 2021 and unaudited.

Performance at month end with net income reinvested

                                   One    Three        One    Three       Five     Since
                                 Month   Months       Year    Years      Years   1 April
                                                                                    2012

Sterling

Share price                       1.8%     2.3%      21.7%     1.2%      15.0%     78.8%

Net asset value                   3.9%     3.0%      25.2%     9.0%      26.5%     82.0%

FTSE All-Share Total Return       4.0%     5.2%      26.7%     9.9%      35.7%     76.5%

Source: BlackRock

BlackRock took over the investment management of the Company with effect from 1
April 2012.

At month end

Sterling:

Net asset value - capital only:                                              189.45p

Net asset value - cum income*:                                               191.51p

Share price:                                                                 171.00p

Total assets (including income):                                              £46.2m

Discount to cum-income NAV:                                                    10.7%

Gearing:                                                                        8.3%

Net yield**:                                                                    4.2%

Ordinary shares in issue***:                                              22,017,990

Gearing range (as a % of net assets):                                          0-20%

Ongoing charges****:                                                            1.2%


* Includes net revenue of 2.06 pence per share

** The Company's yield based on dividends announced in the last 12 months as at
the date of the release of this announcement is 4.2% and includes the 2020
final dividend of 4.60p per share declared on 01 February 2021 and paid to
shareholders on 12 March 2021 and the 2020 interim dividend of 2.60p per share
declared on 24 June 2020 and paid to shareholders on 1 September 2020.

*** excludes 10,081,532 shares held in treasury

**** Calculated as a percentage of average net assets and using expenses,
excluding performance fees and interest costs for the year ended 31 October
2020.


Sector Analysis                                                     Total assets (%)

Financial Services                                                              10.7

Support Services                                                                 9.9

Household Goods & Home Construction                                              8.5

Pharmaceuticals & Biotechnology                                                  7.3

Mining                                                                           7.1

Oil & Gas Producers                                                              6.3

Personal Goods                                                                   5.8

General Retailers                                                                5.0

Banks                                                                            5.0

Life Insurance                                                                   4.9

Travel & Leisure                                                                 4.1

Media                                                                            4.0

Tobacco                                                                          4.0

Nonlife Insurance                                                                3.0

Health Care Equipment & Services                                                 2.8

General Industrials                                                              2.3

Food & Drug Retailers                                                            2.0

Industrial Metals & Mining                                                       1.6

Electronic & Electrical Equipment                                                1.4

Electricity                                                                      1.1

Technology Hardware & Equipment                                                  0.9

Real Estate Investment Trusts                                                    0.6

Industrial Engineering                                                           0.6

Net Current Assets                                                               1.1

                                                                               -----

Total                                                                          100.0

                                                                               =====


Country Analysis                                                          Percentage

United Kingdom                                                                  93.2

United States                                                                    3.2

France                                                                           1.4

Italy                                                                            1.1

Net Current Assets                                                               1.1

                                                                               -----

                                                                               100.0

                                                                               =====


Top 10 holdings                                                               Fund %

AstraZeneca                                                                      6.0

Rio Tinto                                                                        5.0

Reckitt Benckiser                                                                4.8

Unilever                                                                         4.1

RELX                                                                             4.0

British American Tobacco                                                         4.0

Royal Dutch Shell 'B'                                                            3.8

Standard Chartered                                                               2.9

Smith & Nephew                                                                   2.8

Phoenix Group                                                                    2.8

Commenting on the markets, representing the Investment Manager noted:

Performance Overview:

The Company returned 3.9% during the month, underperforming the FTSE All-Share
which returned 4.0%.

Market Summary:

Global equity markets rose in March on the approval of further fiscal support
and the restart to come. The UK and US continued the rollout of successful
vaccine programmes while many European countries tightened lockdown
restrictions again due to struggles with rising infection rates and a sluggish
vaccination campaign.

Fiscal stimulus continued in the US with the approval of a COVID relief bill of
$1.9 trillion. US Treasury yields climbed close to one-year highs with the
10-year yield near 1.5% early in the month. The FOMC meeting indicated the
Fed's higher tolerance for inflation and that tapering bond purchases remains a
distant prospect.

On Budget Day in the UK, the Chancellor revealed several initiatives; one key
positive included the 130% 'super deduction' tax incentive to promote near-term
investment, and one key negative included a proposed increase in corporation
tax to 25% pre-announced for April 2023, lifting the overall UK tax burden to
its highest in 50 years. Progression of the roadmap out of lockdown continued
late in the month with the permittance of 6 people or two households meeting
outside. The FTSE All Share rose 4.0% during the month with Telecommunications,
Consumer Goods and Utilities outperforming while Basic Materials and Oil & Gas
underperformed.

Stocks:

Hiscox was a top detractor during the period; the company issued a poor trading
statement that highlighted further investments needed within its retail
business.  Following recent floats and strong performance from Moonpig and The
Hut Group earlier in the quarter, the share prices fell back during March; both
companies were top detractors during the month.

Taylor Wimpey was a top positive contributor; the company had significant
upgrades at the FY results owing to higher expected margins. Reckitt Benckiser
benefitted as market optimism increased around the improved sales execution and
Standard Chartered benefitted from the value rotation and rising interest
rates; both companies were top positive contributors.

Portfolio Activity:

We remain constructive on economic growth and the tailwind to cyclical areas of
the stock market while remaining cognisant of more defensive companies'
increasingly attractive free cash flow generation.

During the month we added to Ferguson where the strength in the macro and their
ability to take share gave us confidence to further increase the position. We
reduced Hiscox after the release of a disappointing trade statement where our
investment thesis has been challenged in the short term. We sold our position
in Rightmove as we see better opportunities in other parts of the Company.

Outlook:

Despite the continuation of COVID-19 lockdowns globally, economic activity has
been less impacted as consumers and corporates have adapted their behaviours
since the development of effective vaccines. Looking ahead, the focus is firmly
on the cyclical recovery buoyed by ongoing monetary and fiscal support
overwhelming concerns around virus variants.

As economic activity rebounds this has caused some strains on supply chains
with specific industry shortages as well as building inflationary pressures
including significant increases in commodity prices versus 12 months ago. The
prospect of higher inflation has driven bond yields higher with central bankers
indicating their willingness, for now, to stay on the side-lines. We are also
cognisant of the evolution of relationships between China and the West and the
potential impact on industries and shares.

Turning to the UK specifically, we have, finally, got a Brexit deal that
provides increased clarity on the UK's trading relationship with the EU. This
is against a backdrop of UK valuations that have been extreme, trading at
multi-decade lows versus other international markets with a recent flurry of M&
A deals highlighting the dispersion and value on offer in the FTSE. We continue
to believe that this dispersion should narrow given the increased certainty and
reduced risk regarding Brexit in addition to the UK's strong vaccination
effort.

We view the dividend outlook for the UK market with renewed optimism as we
expect dividends, in aggregate, to be more resilient and to grow faster in the
future as those companies that had been overdistributing for a number of years
reset their dividends during the pandemic. Resilience was a crucial feature of
the Company and its underlying holdings in 2020 and while this will still be
important in 2021, we are excited by the approaching economic recovery and the
opportunity to deliver strong capital and dividend growth for our clients over
the long-term.

23 April 2021


END
(END) Dow Jones Newswires
April 23, 2021 08:00 ET (12:00 GMT)
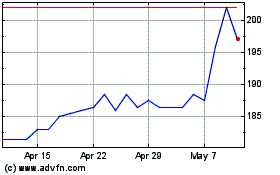
Blackrock Income And Gro... (LSE:BRIG)
Historical Stock Chart
From Mar 2024 to Apr 2024

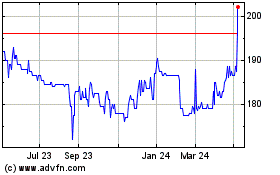
Blackrock Income And Gro... (LSE:BRIG)
Historical Stock Chart
From Apr 2023 to Apr 2024
