Applied Materials on Track for Longest Winning Streak Since November 2021 -- Data Talk
November 09 2023 - 9:55AM
Dow Jones News
Applied Materials, Inc. (AMAT) is currently at $146.43, up $2.20
or 1.52%
--Would be highest close since Sept. 11, 2023, when it closed at
$146.71
--Currently up 10 of the past 11 days
--Currently up eight consecutive days; up 11.75% over this
period
--Longest winning streak since Nov. 5, 2021, when it rose for
eight straight trading days
--Best eight day stretch since the eight days ending Aug. 1,
2023, when it rose 13.87%
--Up 10.63% month-to-date
--Up 50.36% year-to-date; on pace for best year since 2021, when
it rose 82.34%
--Down 12.32% from its all-time closing high of $167.00 on Jan.
14, 2022
--Up 39.73% from 52 weeks ago (Nov. 10, 2022), when it closed at
$104.79
--Down 4.91% from its 52-week closing high of $153.99 on Sept.
1, 2023
--Up 55.4% from its 52-week closing low of $94.23 on Dec. 28,
2022
--Traded as high as $147.03; highest intraday level since Oct.
13, 2023, when it hit $147.10
--Up 1.94% at today's intraday high
--Eighth best performer in the Nasdaq 100 today
All data as of 10:22:27 AM ET
Source: Dow Jones Market Data, FactSet
(END) Dow Jones Newswires
November 09, 2023 10:40 ET (15:40 GMT)
Copyright (c) 2023 Dow Jones & Company, Inc.
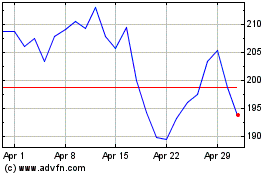
Applied Materials (NASDAQ:AMAT)
Historical Stock Chart
From Jun 2024 to Jul 2024

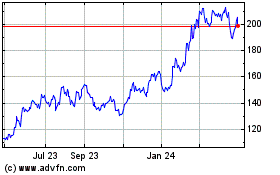
Applied Materials (NASDAQ:AMAT)
Historical Stock Chart
From Jul 2023 to Jul 2024
