Bitcoin Bullish Signal: Exchange Outflows Spike Up
October 02 2022 - 2:00PM
NEWSBTC
On-chain data shows the Bitcoin exchange outflows have spiked up
recently, a sign that could prove to be bullish for the crypto’s
price. Bitcoin Exchange Netflow Has Observed Deep Red Values In
Recent Days As pointed out by an analyst in a CryptoQuant post,
investors have withdrawn more than 60k BTC from exchanges recently.
The relevant indicator here is the “all exchanges netflow,” which
measures the net amount of Bitcoin entering or exiting wallets of
all centralized exchanges. The metric’s value is simply calculated
by taking the difference between the inflows and the outflows. When
the value of this indicator is greater than zero, it means there
are more inflows taking place in the market than outflows. Such a
trend, when prolonged, can be bearish for the price of the crypto
as it may be a sign of dumping from investors. Related Reading: Why
Most Public Bitcoin Miners Have Performed Terribly In Their
Lifetimes On the other hand, negative values of the netflow suggest
investors are taking out a net number of coins right now. This kind
of trend can indicate buying pressure in the market, and hence
could be bullish for BTC’s value. Now, here is a chart that shows
the trend in the Bitcoin all exchanges netflow over the last month:
The value of the metric seems to have been below zero in recent
days | Source: CryptoQuant As you can see in the above graph, the
Bitcoin all exchanges netflow has observed some negative spikes
during the last three days. These downward surges in the
indicator’s value have amounted to more than 61k BTC leaving
exchange wallets, the largest stack of withdrawals in months.
Related Reading: Secure Your Crypto Portfolio Today: Oryen (ORY),
Bitcoin (BTC), and Ethereum Classic (ETC) The crypto’s price has
been struggling hard for many months now, so this kind of fresh
demand could be constructive for the coin, and help it turn things
around, at least temporarily. BTC Price At the time of writing,
Bitcoin’s price floats around $19.1k, up 1% in the last seven days.
Over the past month, the crypto has lost 5% in value. Below is a
chart that shows the trend in the price of the coin over the last
five days. Looks like the value of the crypto has been mostly
trending sideways during the last few days | Source: BTCUSD on
TradingView Bitcoin hasn’t seen much price activity at all recently
as the value of the crypto has been painting a flat curve. One
exception was the surge to $20k a couple of days back, but it
wasn’t long before the spike died down and BTC returned to its
trend of consolidation. Featured image from Dylan Leagh on
unsplash.com, charts from TradingView.com, CryptoQuant.com
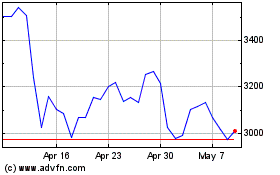
Ethereum (COIN:ETHUSD)
Historical Stock Chart
From Mar 2024 to Apr 2024

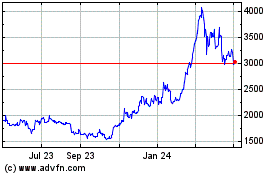
Ethereum (COIN:ETHUSD)
Historical Stock Chart
From Apr 2023 to Apr 2024
