Farmers & Merchants Bank of Long Beach (OTCBB: FMBL) today
announced financial results for the fourth quarter and full year
ended December 31, 2012.
“We achieved solid financial results for 2012, including another
year of record earnings, despite an increasingly challenging
regulatory and interest rate environment,” said Henry Walker,
president of Farmers & Merchants Bank of Long Beach. “We also
made several key hires during the year, including a new chief
credit officer, chief auditor, chief information officer and
supporting staff, which will further enhance our position of
strength as we enter 2013.”
Income Statement
For the 2012 fourth quarter, total interest income was $40.4
million, compared with $43.3 million in the fourth quarter of 2011.
Total interest income for the year ended December 31, 2012 was
$171.1 million, compared with $178.6 million reported for 2011.
Interest expense for the 2012 fourth quarter fell to $1.6
million from $2.0 million in the same quarter of 2011. Interest
expense for the full 2012 year declined to $7.0 million from $9.5
million in 2011. The Bank’s overall cost of funds continued to
reflect the low interest rate environment and the impact of
non-interest bearing deposits.
The Bank’s net interest income for the 2012 fourth quarter was
$38.8 million, compared with net interest income of $41.3 million
for the same quarter of 2011. Net interest income for 2012 was
$164.1 million, versus $169.2 million in 2011. Farmers &
Merchant’s net interest margin was 3.65% for the year ended
December 31, 2012, compared with 4.08% in the previous year.
The Bank did not have a provision for loan losses in the fourth
quarter of 2012 or for the year ended December 31, 2012, reflecting
stabilization of the asset quality of the Bank’s loan portfolio.
Provision for loan losses in the fourth quarter of 2011 totaled
$5.5 million and was $14.2 for the full 2011 year. The Bank’s
allowance for loan losses as a percentage of loans outstanding was
2.85% at December 31, 2012, compared with 2.80% at December 31,
2011.
Non-interest income was $3.9 million for the 2012 fourth
quarter, compared with $4.0 million in the 2011 fourth quarter.
Non-interest income for the full 2012 year totaled $15.9 million,
versus $13.9 million for 2011.
Non-interest expense for the 2012 fourth quarter was $24.1
million, compared with $19.9 million for the same period last year.
Non-interest expense for the year ended December 31, 2012 was $87.8
million, compared with $78.4 million last year.
The Bank’s net income for the 2012 fourth quarter was $13.2
million, or $101.12 per diluted share, compared with $13.8 million,
or $105.30 per diluted share, in the 2011 fourth quarter. The
Bank’s net income for 2012 rose to $63.4 million, or $484.14 per
diluted share, from $59.1 million, or $451.53 per diluted share,
for 2011.
Balance Sheet
At December 31, 2012, net loans totaled $1.93 billion, compared
with $2.03 billion at December 31, 2011. The Bank’s deposits grew
to $3.69 billion at the end of 2012, from $3.39 billion at December
31, 2011. Non-interest bearing deposits represented 40.0% of total
deposits at December 31, 2012, versus 37.2% of total deposits at
December 31, 2011. Total assets increased to $4.99 billion at the
close of 2012 from $4.66 billion at December 31, 2011.
At December 31, 2012, Farmers & Merchants Bank remained
“well-capitalized” under all regulatory categories, with a total
risk-based capital ratio of 29.61%, a Tier 1 risk-based capital
ratio of 28.35%, and a Tier 1 leverage ratio of 14.24%. The minimum
ratios for capital adequacy for a well-capitalized bank are 10.00%,
6.00% and 5.00%, respectively.
“We continued to build on the asset quality of our loan
portfolio and experienced solid deposit growth in 2012 – two
characteristics that reflect Farmers & Merchants’ commitment to
the long-term success of the Bank,” said Daniel Walker, chief
executive officer and chairman of the board. “Additionally, we
believe the strategic investments we made in 2012, in both
personnel and technology enhancements, will help continue to
distinguish Farmers & Merchants Bank as one of the strongest
banks in the region.”
About Farmers & Merchants Bank of Long Beach
Farmers & Merchants Bank of Long Beach provides personal and
business banking services through 21 offices in Los Angeles and
Orange Counties. Founded in 1907 by C.J. Walker, the Bank
specializes in commercial and small business banking along with
business loan programs.
FARMERS & MERCHANTS BANK OF LONG BEACH Income
Statements (Unaudited) (In Thousands)
Three Months Ended Dec.
31, Twelve Months Ended Dec. 31, 2012
2011 2012 2011
Interest income: Loans $ 26,060 $ 28,667 $
112,157 $ 115,395 Securities held-to-maturity 11,678 11,303 47,112
48,734 Securities available-for-sale 2,406 3,118 10,794 13,980
Deposits with banks 287 224 1,051
497 Total interest income 40,431 43,312
171,114 178,606
Interest
expense: Deposits 1,328 1,709 5,840 7,920 Securities
sold under agreement to repurchase 293 294
1,147 1,535 Total interest expense
1,621 2,003 6,987 9,455 Net
interest income 38,810 41,309 164,127 169,151
Provision
for loan losses - 5,450 -
14,200 Net interest income after provision for loan losses
38,810 35,859 164,127 154,951
Non-interest income: Service charges on
deposit accounts 1,136 1,481 4,598 5,114 Gains on sale of
securities 303 71 345 174 Merchant bankcard fees 376 354 1,710
1,257 Escrow fees 227 220 858 924 Other income 1,867
1,888 8,366 6,436 Total non-interest
income 3,909 4,014 15,877 13,905
Non-interest expense: Salaries and employee
benefits 13,012 9,850 48,271 41,814 FDIC and other insurance
expense 1,667 1,643 6,479 4,671 Occupancy expense 1,368 1,374 5,487
5,501 Equipment expense 1,718 1,322 5,800 5,435 Other real estate
owned expense,net 740 1,081 1,679 3,441 Amortization of investments
in LIC 1,866 2,541 7,762 3,894 Legal and professional fees 953
1,321 2,882 3,896 Marketing and promotional expense 1,067 1,096
3,674 3,934 Other expense 1,669 (364 ) 5,727
5,842 Total non-interest expense 24,060
19,864 87,761 78,428 Income before
income tax expense 18,659 20,009 92,243 90,428
Income tax
expense 5,420 6,223 28,856
31,310
Net income $ 13,239 $
13,786 $ 63,387 $ 59,118
Basic and diluted earnings per common share $ 101.12 $
105.30 $ 484.14 $ 451.53
FARMERS & MERCHANTS
BANK OF LONG BEACH Balance Sheets (Unaudited) (In
Thousands) Dec. 31,
2012 Dec. 31, 2011 Assets Cash and due
from banks: Noninterest-bearing balances $ 60,914 $ 57,394
Interest-bearing balances 253,087 278,525 Securities
held-to-maturity 1,942,085 1,564,841 Securities available for sale
630,055 548,289 Gross loans 1,990,146 2,087,388 Less allowance for
loan losses (56,700 ) (58,463 ) Less unamortized deferred loan
fees, net (364 ) (418 ) Net loans 1,933,082
2,028,507 Other real estate owned, net 17,696
23,036 Investments in low-income communities (LIC) 35,804 43,566
Bank premises and equipment, net 60,504 55,155 Accrued interest
receivable 18,542 16,464 Net deferred tax assets 28,302 28,583
Other assets 8,890 14,985
Total assets $ 4,988,961 $
4,659,345 Liabilities and stockholders'
equity Liabilities: Deposits: Demand,
non-interest bearing $ 1,474,215 $ 1,263,162 Demand, interest
bearing 346,991 300,984 Savings and money market savings 1,011,029
909,794 Time deposits 853,631 919,538
Total deposits 3,685,866 3,393,478 Securities sold
under agreements to repurchase 551,293 555,992 Other liabilities
34,543 39,659
Total
liabilities 4,271,702
3,989,129 Stockholders' Equity:
Common Stock, par value $20; authorized 250,000 shares; issued and
outstanding 130,928 shares 2,619 2,619 Surplus 12,044 12,044
Retained earnings 695,169 646,708 Accumulated other comprehensive
income 7,427 8,845
Total stockholders'
equity 717,259 670,216
Total liabilities and stockholders' equity
$ 4,988,961 $ 4,659,345
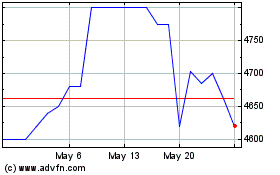
Farmers and Merchants Bank (QX) (USOTC:FMBL)
Historical Stock Chart
From Dec 2024 to Jan 2025

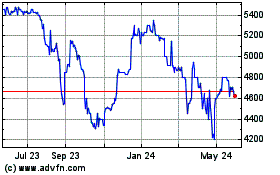
Farmers and Merchants Bank (QX) (USOTC:FMBL)
Historical Stock Chart
From Jan 2024 to Jan 2025
