RNS Number:1190Y
Eurocity Properties PLC
31 January 2001
www.eurocityproperties.com
Interim Accounts
For the six months ended30th September 2000Company Registration No. 2739940
In the six months ending 30 September, your company recorded a slightly
increased loss of #96,305 compared with #69,353 in 1999. Despite this loss
your directors believe that the company is making progress and continues to
improve the overall quality of its portfolio.A number of acquisitions were
made in the period of commercial properties let to sound covenants in good
locations.Your board is aware of the difficulty in trading in the shares in a
company as small as ours, and realise the need to market the shares to as wide
an audience as possible. Baron Bloom will present to regional and private
client brokers in an attempt to heighten the profile of the company. The
company was recently featured on a Channel 4 business programme where the
shares were picked as a buy. This resulted in significant trading in the
shares, enabling longstanding holders to exit and giving us the benefit of new
and stable holders.Since the end of the half year, the company has completed
the acquisition of three property companies, in a single transaction, at a
cost of #1.8m, of which #200,000 was satisfied by the issue of new shares at a
price of 50p per share. The assets of the companies are residential properties
in Central London. We expect to dispose of some of these properties quickly,
but in the meantime they are income producing. This was an opportunistic
purchase and does not represent a change in the strategic direction of the
company.The company is not yet in a position to pay a dividend.Nicholas
JeffreyChairman
Unaudited Audited
Period Period ended 30th Year ended 31st
ended September 2000 March 2000
30th
September
2000
# # #
Income from properties 251,470 211,328 481,949
Direct property expenses (43,830) (7,644) (16,216)
Operating expenses (210,887) (166,203) (322,446)
Exceptional item 2 --- --- (224,400)
Profit on sale of 54,630 --- ---
properties
Operating profit/(loss) 51,383 37,481 (81,113)
Interest receivable 11,991 5,540 170
Interest payable (159,679) (112,374) (237,286)
Loss on ordinary (96,305) (69,353) (318,229)
activities before
taxation
Taxation 5 --- --- ---
Loss on ordinary (96,305) (69,353) (318,229)
activities after taxation
Loss per share
Basic 3 2.7p 3.4p 13.9p
Fully diluted 3 2.6p 2.8p 11.8p
Unaudited Audited
Period Period ended 30th Year ended
ended September 2000 31st March
30th 2000
September
2000
# # #
Loss for the financial period (96,305) (69,353) (318,229)
Unrealised (deficit)/surplus on --- (44,926) 85,074
revaluation of investment
properties
Total recognised gains and losses (96,305) (114,279) (233,155)
relating to the period
Unaudited Audited
Notes 31st March
30th 2000
September
2000
# #
Fixed assets 6 5,345,991 5,330,000
Tangible assets --- 85,074
Current assets
Investments 7 124,630 ---
Debtors 79,389 29,064
Cash at bank and in hand 425,938 641,101
629,957 670,165
Creditors: Amounts falling due within one year (312,995) (535,756)
Net current assets 316,962 134,409
Total assets less current liabilities 5,662,953 5,464,409
Creditors: Amounts falling due after more than (3,386,630) (3,244,283)
one year
2,276,323 2,220,126
Capital and reserves
Called up share capital 8 1,925,170 1,757,670
Share premium account 9 663,583 678,581
Other reserve 9 53,711 53,711
Revaluation reserve 9 563,555 497,179
Profit and loss account 9 (929,696) (767,015)
Shareholders' funds 2,276,323 2,220,126
Net asset value per share 4 59.1p 63.2p
Unaudited Audited
Period Period ended 30th Year ended
ended September 1999 31st March
30th 2000
September
2000
# #
Cash flow from operating (96,423) 41,446 165,729
activities
Returns on investments and (147,688) (106,834) (237,116)
servicing of finance
Taxation --- --- ---
Capital expenditure and (46,991) (937,174) (937,174)
financial investment
Acquisitions and disposals --- (150,000) (150,000)
Cash outflow before (291,102) (1,152,562) (1,158,561)
financing
Financing 89,348 856,311 1,404,435
(Decrease)/increase in cash (201,754) (296,251) 245,874
in the period
RECONCILIATION OF NET CASH FLOW TO MOVEMENT IN DEBT
Period Period ended 30th Year ended 31st
ended September 1999 March 2000
30th
September
2000
# #
(Decrease)/increase in (201,754) (296,251) 245,874
cash in the year
Cash inflow from increase (113,319) (1,427,829) (1,362,278)
in debt
Change in net debt (315,073) (1,724,080) (1,116,404)
resulting from cashflows
Net debt brought forward (2,723,086) (1,606,682) (1,606,682)
Net debt carried forward (3,038,159) (3,330,762) (2,723,086)
1 Basis of preparation The interim financial statements have been prepared
on the basis of the accounting policies as set out in the statutory financial
statements for the year ended 31 March 2000. The interim financial statements,
which were approved by the Directors on 26 January 2001, are unaudited.
2 Exceptional item This relates to a provision of #200,000 in respect of
shares receivable under the directors' incentive scheme (note 11) together
with a provision for employers national insurance of #24,400.
3 Loss per share The calculation of loss per ordinary share is based on the
loss for the period of #96,305 (year to 31 March 2000 -- loss of #318,229;
period to 30 September 1999 -- loss of #69,353) and on the weighted average
number of shares in issue during the period of 3,573,782 shares (31 March 2000
-- 2,290,993 shares; 30 September 1999 -- 2,061,532 shares).
Fully diluted loss per share includes shares held under the directors'
incentive scheme (note 11) and is based on a loss for the period of #96,305
(year to 31 March 2000 -- loss of #318,229; period to 30 September 1999 --
loss of #69,353) and on a weighted average number of shares in issue during
the period of 3,698,782 shares (31 March 2000 -- 2,690,993 shares; 30
September 1999 -- 2,461,532 shares).
4 Net asset value per share The calculation of net asset value per share is
based on net assets of #2,276,323 (31 March 2000 -- #2,220,126) and on the
number of shares in issue at the balance sheet date of 3,850,340 shares (31
March 2000 -- 3,515,340 shares).
5 Taxation There is no charge to corporation tax for the group due to the
trading losses incurred.
6 Tangible assets
Investment properties
#
Valuation
1 April 2000 5,330,000
Additions 965,991
Disposals (950,000)
30 September 2000 5,345,991
7 Investments
Listed Investments
#
Cost
Additions 124,630
30th September 2000 124,630
The listed investment represents ordinary shares in Newport Holdings Plc
acquired as part consideration for the sale of investment properties.
8 Share capital
Unaudited Audited
30th September 31st
2000 March
2000
# #
Authorised:
60,000,000 ordinary shares of 50p each 30,000,000 30,000,000
Allotted, issued and fully paid 1,925,170 1,757,670
3,850,340 (31 March -- 3,515,340) ordinary shares of 50p each
During the period the company issued 60,000 ordinary 50p shares at par as part
consideration for the purchase of an investment property, and also issued
275,000 ordinary 50p shares at par representing bonus shares issued to D Bloom
(note 11).
9 Reserves
Re- Profit
Share Other Valuation and loss Total
premium reserve reserve account
# # # # #
1 April 2000 678,581 53,711 497,179 (767,015) 462,456
Share issue costs (14,998) --- --- --- (14,998)
Transfers of
revaluation on
sale of property --- --- 66,376 (66,376) ---
Loss for the period --- --- --- (96,305) (96,305)
30 September 2000 663,583 53,711 563,555 (929,696) 351,153
10 Cash flows
Unaudited Audited
Period Period ended Year ended
ended 30th September 31st March
30th 1999 2000
September
2000
# # #
(a) Reconciliation of operating
profit to net cash inflow from
operating activities
Operating profit/(loss) 32,993 37,481 (81,113)
Profit on sale of investment properties (54,630) --- ---
Increase in debtors (26,983) (7,485) (15,304)
(Decrease)/increase in creditors (47,803) 11,450 262,146
Net cash (outflow)/inflow from (96,423) 41,446 165,729
operating activities
# # #
(b) Analysis of cash flows for
headings netted in the cash flow
Returns on investments and servicing of
finance
Interest received 11,991 5,540 170
Interest paid (159,679) (112,374) (237,286)
(147,688) (106,834) (237,116)
Capital expenditure and financial
investment
Purchase of tangible fixed assets (926,991) (937,174) (937,174)
Sale of tangible fixed assets 880,000 --- ---
(46,991) (937,174) (937,174)
Acquisitions and disposals
Acquisition of subsidiary --- (150,000) (150,000)
Financing
Issue of shares (23,998) 139,000 728,675
New building society loans
820,000 777,500 777,500
Building society loans repaid (706,654) (60,189) (101,740)
Net cash outflow from financing
89,348 856,311 1,404,435
11 Directors' incentive scheme and warrants The company currently runs an
incentive scheme for certain directors. The scheme provides for certain
directors to be entitled to receive a specified amount, as set out below, to
be satisfied by the issue of new ordinary 50p shares in the company and
triggered by any of the following events:
(a) The company first achieving a net asset value target of 143p per
share, as shown by the audited accounts of the company for any of the
financial years ending in 1999, 2000, 2001, 2002 or 2003.
(b) The admission of the Company's shares to the Official List of the
London Stock Exchange or to trading on the Alternative Investment Market;
or
(c) Control of the company being acquired by another company whose
shares have been so admitted.
The number of shares granted to each of the directors is as follows:
No. of shares
DL Bloom 275,000
BA Bloom 125,000
DSM Glasner LLB ---
N Jeffery LLB ---
Less: shares issued in period (note 8) (275,000)
125,000
The entitlement to these shares has been triggered by the admission of the
company's shares to the Alternative Investment Market, and shares have been
issued to DL Bloom in the period. Full provision has been made in these
accounts for the shares due to BA Bloom.The company has created 2,250,107
warrants each giving the holder thereof the right to subscribe to one ordinary
share at a price of 55p per share at any time during the period of three years
from the date of admission to AIM on 31 March 2000. The warrants were issued
on 31 March 2000 to the holders of ordinary shares on the basis of one warrant
for every two ordinary shares.The directors have been granted warrants,
exercisable on the same terms, as follows:
No. of warrants
N Jeffrey LLB 191,818
BA Bloom 200,000
DSM Glasner 45,454
437,272-
None of these warrants have been exercised.
Introduction We have been instructed by the company to review the financial
information set out on pages 1 to 9 and we have read the other information
contained in the interim report and considered whether it contains any
apparent misstatements or material inconsistencies with the financial
information.
Directors' responsibilities The interim report, including the financial
information contained therein, is the responsibility of, and has been approved
by the directors. The Listing rules of the London Stock Exchange require that
the accounting policies and presentation applied to the interim figures should
be consistent with those applied in preparing annual accounts except where any
changes, and the reasons for them, are disclosed.
Review work performed We conducted our review in accordance with guidelines
contained in Bulletin 1999/4 issued by the Auditing Practices Board. A review
consists principally of making enquiries of group management and applying
analytical procedures to the financial information and underlying financial
data and based thereon, assessing whether the accounting policies and
presentation have been consistently applied unless otherwise disclosed. A
review excludes audit procedures such as tests of controls and verification of
assets, liabilities and transactions. It is substantially less in scope than
an audit performed in accordance with Auditing Standards and therefore
provides a lower level of assurance than an audit. Accordingly we do not
express an audit opinion on the financial information.
Review conclusion On the basis of our review we are not aware of any material
modifications that should be made to the financial information as presented
for the six months ended 30 September 2000.BAKER TILLYChartered Accountants2
Bloomsbury StreetLondonWC1B 3ST
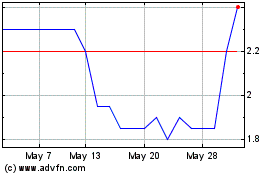
Energypathways (LSE:EPP)
Historical Stock Chart
From Sep 2024 to Oct 2024

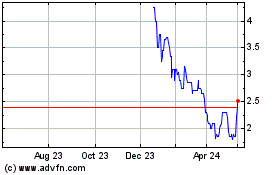
Energypathways (LSE:EPP)
Historical Stock Chart
From Oct 2023 to Oct 2024
