Delivers on 2023 guidance, strong 2024 outlook of
2.1 million Au eq. oz.
Tasiast and La Coipa projects completed driving significant free
cash flow
Great Bear exceeds expectations and adds more than one million
high-grade inferred ounces
TORONTO, Feb. 14, 2024 (GLOBE NEWSWIRE) --
Kinross Gold Corporation (TSX: K, NYSE: KGC) (“Kinross” or the
“Company”) today announced its results for the fourth-quarter and
year ended December 31, 2023.
This news release contains forward-looking
information about expected future events and financial and
operating performance of the Company. We refer to the risks and
assumptions set out in our Cautionary Statement on Forward-Looking
Information located on page 48 of this release. All dollar amounts
are expressed in U.S. dollars, unless otherwise noted.
2023 full-year results and 2024
guidance:
|
|
2023 guidance
(+/- 5%) |
Q4 2023 results |
2023 full-year results |
2024 guidance
(attributable)1
(+/- 5%) |
Gold equivalent
production1
(ounces) |
2.1 million |
546,513 |
2.15 million |
2.1 million |
Production cost of
sales1,2
($ per Au eq. oz.) |
$970 |
$976 |
$942 |
$1,020 |
All-in sustaining
cost1,2,3
($ per Au eq. oz.) |
$1,320 |
$1,353 |
$1,316 |
$1,360 |
|
Attributable1 capital
expenditures4 (million) |
$1,000 million |
$298 million
(Capital expenditures of $311 million4) |
$1,055 million
(Capital expenditures of $1,098 million4) |
$1,050 million
|
- Attributable1 production
in 2024 is expected to be 2.1 million Au eq. oz. Kinross has
forecasted stable production guidance of approximately 2.0
million attributable Au eq. oz. in each of 2025 and 2026.
Operational, development project and
exploration highlights:
- Tasiast had record
throughput in Q4 2023 and achieved record full-year production. It
remains well-positioned to deliver another strong year in
2024.
- La Coipa achieved
record quarterly production driven by strong throughput and
grades.
- Paracatu delivered
another year of steady production including record recovery in
2023.
- Tasiast,
Paracatu and La
Coipa represented nearly 70% of production and were
the lowest cost mines in the portfolio, contributing significant
free cash flow.
- Great Bear
increased its year-over-year inferred resource estimate by 45%,
adding more than one million ounces primarily driven by high-grade
underground additions. Kinross has increased Great Bear’s mineral
resource estimate to approximately 2.8 million Au oz. of measured
and indicated mineral resources, and to approximately 3.3 million
ounces of inferred mineral resources.
- At Manh Choh,
mining activities are well underway including the commencement of
ore mining and stockpiling. The project remains on budget and on
schedule for initial production in the second half of 2024.
- At Round Mountain,
mining of Phase S has commenced. Development of
the Phase X exploration decline is approaching the
target mineralization, with drilling activities having commenced in
early 2024 and set to ramp up through the year.
2023 Q4 and full-year
highlights:
- Production of
546,513 Au eq. oz. in Q4 2023, and 2,153,020 Au eq. oz. in
2023.
- Production cost of
sales2 of $976 per Au eq. oz. in Q4 2023, and
$942 per Au eq. oz. in 2023.
- All-in sustaining
cost3 of $1,353 per Au eq. oz. sold in Q4 2023,
and $1,316 per Au eq. oz. sold in 2023.
-
Margins5 of $998 per Au eq. oz. sold in
Q4 2023, and $1,003 for 2023.
- Operating cash
flow6 of $410.9 million in Q4 2023, and
$1,605.3 million in 2023.
- Adjusted operating cash
flow3 was $407.4 million in Q4 2023, and
$1,669.9 million in 2023.
- Attributable free cash
flow3 was $116.7 million in Q4 2023, and $559.7
million in 2023.
- Reported net
earnings7 of $65.4 million in Q4 2023, or $0.06
per share, and $416.3 million, or $0.34 per share, in 2023.
- Adjusted net
earnings3, 8 of $140.0
million, or $0.11 per share in Q4 2023, and $539.8 million, or
$0.44 per share, in 2023.
- Cash and cash
equivalents of $352.4 million, and total
liquidity9 of $1.9 billion at December
31, 2023. The Company also continued to prioritize debt reduction,
repaying the remaining balance on both its Tasiast loan and
revolving credit facility in Q4 2023.
- Kinross’ Board of Directors
declared a quarterly dividend of $0.03 per common
share payable on March 21, 2024, to shareholders of record
at the close of business on March 6, 2024.
CEO Commentary:
J. Paul Rollinson, President and CEO, made the following
comments in relation to 2023 fourth-quarter and year-end
results:
“2023 was a great year at Kinross and I am proud
of our global team who achieved the results that underpin our
reputation as strong operators. We met our production, cost and
capital guidance, and completed our projects at Tasiast and La
Coipa. Our portfolio of mines produced solid results, we more than
doubled free cash flow year-over-year while maintaining our
investment grade balance sheet, and we are carrying this momentum
into 2024.
“We expect to deliver another strong year in
2024, producing approximately 2.1 million gold equivalent ounces.
Our development projects are progressing well and we look forward
to first production from Manh Choh in the second half of the year.
Great Bear continues to exceed expectations and we were excited to
add more than one million ounces of higher-grade underground
resource. We continue to successfully target extensions of the
resource at depth, reinforcing our view that Great Bear has the
potential to be a large, long-life, high-grade mining complex.
“Operating responsibly, delivering on our
commitments and advancing our ESG strategy continue to be key
principles of our day-to-day operations. Kinross was recently named
to the Dow Jones Sustainability World Index, reflecting our
commitment to corporate citizenship as a core value and key
strategic driver of our business. We expect to publish our 2023
Sustainability and ESG Report in May and some highlights from the
year include:
- Completed construction of the solar
power plant at Tasiast and are on track to achieve our goal of
reducing emissions intensity by 30% by 2030 from our 2021
baseline;
- In Brazil, we published a book on
the Cerrado biodiversity corridor, highlighting the importance of
protecting this critical region and the strategic approach taken by
our Paracatu site;
- Made approximately $10 million of
monetary and in-kind contributions through site social investments;
and
- Established the “Kinross Alaska
Future Leaders” scholarship at the University of Alaska Fairbanks
focused on advancing the inclusion of underrepresented people in
the resource industry.”
Financial results
Summary of financial and operating
results
|
|
|
Three months ended |
Years ended |
|
|
|
December 31, |
December 31, |
|
(unaudited, in millions of U.S. dollars, except ounces, per share
amounts, and per ounce amounts) |
2023
|
2022 |
2023
|
2022
|
|
Operating Highlights |
|
|
|
|
|
| Total
gold equivalent ounces from continuing
operations(a),(b) |
|
|
|
|
|
Produced |
|
546,513 |
|
|
595,683 |
|
|
2,153,020 |
|
|
1,957,237 |
|
|
Sold |
|
565,389 |
|
|
620,599 |
|
|
2,179,936 |
|
|
1,927,818 |
|
|
|
|
|
|
|
|
|
Financial Highlights from Continuing
Operations(a) |
|
|
|
|
|
|
Metal sales |
|
$ |
1,115.7 |
|
$ |
1,076.2 |
|
$ |
4,239.7 |
|
$ |
3,455.1 |
|
|
Production cost of sales |
|
$ |
552.0 |
|
$ |
526.5 |
|
$ |
2,054.4 |
|
$ |
1,805.7 |
|
|
Depreciation, depletion and amortization |
|
$ |
271.7 |
|
$ |
251.9 |
|
$ |
986.8 |
|
$ |
784.0 |
|
|
Impairment charges and asset derecognition |
|
$ |
38.9 |
|
$ |
350.0 |
|
$ |
38.9 |
|
$ |
350.0 |
|
| Operating
earnings |
|
$ |
193.5 |
|
$ |
(160.1 |
) |
$ |
801.4 |
|
$ |
117.7 |
|
| Net
earnings (loss) from continuing operations attributable to common
shareholders |
|
$ |
65.4 |
|
$ |
(106.0 |
) |
$ |
416.3 |
|
$ |
31.9 |
|
| Basic
earnings (loss) per share from continuing operations attributable
to common shareholders |
|
$ |
0.06 |
|
$ |
(0.08 |
) |
$ |
0.34 |
|
$ |
0.02 |
|
| Diluted
earnings (loss) per share from continuing operations attributable
to common shareholders |
|
$ |
0.06 |
|
$ |
(0.08 |
) |
$ |
0.34 |
|
$ |
0.02 |
|
| Adjusted
net earnings from continuing operations attributable to common
shareholders(c) |
|
$ |
140.0 |
|
$ |
108.2 |
|
$ |
539.8 |
|
$ |
283.1 |
|
| Adjusted
net earnings from continuing operations per
share(c) |
|
$ |
0.11 |
|
$ |
0.09 |
|
$ |
0.44 |
|
$ |
0.22 |
|
| Net cash
flow of continuing operations provided from operating
activities |
|
$ |
410.9 |
|
$ |
474.3 |
|
$ |
1,605.3 |
|
$ |
1,002.5 |
|
| Adjusted
operating cash flow from continuing operations(c) |
|
$ |
407.4 |
|
$ |
496.1 |
|
$ |
1,669.9 |
|
$ |
1,256.5 |
|
| Capital
expenditures from continuing operations(d) |
|
$ |
311.3 |
|
$ |
316.8 |
|
$ |
1,098.3 |
|
$ |
764.2 |
|
|
Attributable(g) capital expenditures from continuing
operations(c) |
$ |
297.7 |
|
$ |
312.7 |
|
$ |
1,055.0 |
|
$ |
755.0 |
|
|
Attributable(g) free cash flow from continuing
operations(c) |
$ |
116.7 |
|
$ |
162.6 |
|
$ |
559.7 |
|
$ |
247.3 |
|
| Average
realized gold price per ounce from continuing
operations(e) |
|
$ |
1,974 |
|
$ |
1,731 |
|
$ |
1,945 |
|
$ |
1,793 |
|
|
Production cost of sales from continuing operations per equivalent
ounce(b) sold(f) |
|
$ |
976 |
|
$ |
848 |
|
$ |
942 |
|
$ |
937 |
|
|
Production cost of sales from continuing operations per ounce sold
on a by-product basis(c) |
|
$ |
936 |
|
$ |
793 |
|
$ |
892 |
|
$ |
912 |
|
| All-in
sustaining cost from continuing operations per ounce sold on a
by-product basis(c) |
|
$ |
1,328 |
|
$ |
1,203 |
|
$ |
1,284 |
|
$ |
1,255 |
|
| All-in
sustaining cost from continuing operations per equivalent
ounce(b) sold(c) |
|
$ |
1,353 |
|
$ |
1,236 |
|
$ |
1,316 |
|
$ |
1,271 |
|
|
Attributable(g) all-in cost from continuing operations
per ounce sold on a by-product basis(c) |
|
$ |
1,699 |
|
$ |
1,525 |
|
$ |
1,619 |
|
$ |
1,538 |
|
|
Attributable(g) all-in cost from continuing operations
per equivalent ounce(b) sold(c) |
|
$ |
1,709 |
|
$ |
1,540 |
|
$ |
1,634 |
|
$ |
1,545 |
|
|
(a) |
Results for the three months and year-ended December 31, 2023
and 2022 are from continuing operations and exclude results from
the Company’s Chirano and Russian operations due to the
classification of these operations as discontinued and their sale
in 2022. |
|
(b) |
“Gold equivalent ounces” include silver ounces produced and
sold converted to a gold equivalent based on a ratio of the average
spot market prices for the commodities for each period. The ratio
for 2023 was 83.13:1 (2022 – 82.90:1). |
|
(c) |
The definition and reconciliation of these non-GAAP financial
measures and ratios is included on pages 26 to 30 of this news
release. Non-GAAP financial measures and ratios have no
standardized meaning under IFRS and therefore, may not be
comparable to similar measures presented by other
issuers. |
|
(d) |
“Capital expenditures from continuing operations” is as
reported as “Additions to property, plant and equipment” on the
consolidated statements of cash flows. |
|
(e) |
“Average realized gold price per ounce from continuing
operations” is defined as gold metal sales from continuing
operations divided by total gold ounces sold from continuing
operations. |
|
(f) |
“Production cost of sales from continuing operations per
equivalent ounce sold” is defined as production cost of sales
divided by total gold equivalent ounces sold from continuing
operations. |
|
(g) |
“Attributable” includes Kinross’ share of Manh Choh (70%)
costs, capital expenditures and cash flow, as
appropriate. |
|
|
|
The following operating and financial results are based on
fourth-quarter and year-end 2023 gold equivalent
production:
Production: Kinross produced
546,513 Au eq. oz. from continuing operations in Q4 2023, compared
with 595,683 Au eq. oz. from continuing operations in Q4 2022.
Over the full year, Kinross produced 2,153,020
Au eq. oz. from continuing operations, compared with full-year 2022
production of 1,957,237 Au eq. oz. from continuing operations. The
10% year-over-year increase was largely a result of higher
production at La Coipa due to the ramp-up of operations in the
second half of 2022, and higher mill grades, recoveries and
throughput at Tasiast, partially offset by lower production at Bald
Mountain, consistent with the mine plan.
Average realized gold price:
The average realized gold price from continuing operations in Q4
2023 was $1,974 per ounce, compared with $1,731 per ounce in Q4
2022. For full-year 2023, the average realized gold price per ounce
from continuing operations was $1,945, compared with $1,793 per
ounce for full-year 2022.
Revenue: During the fourth
quarter, revenue from continuing operations increased to $1,115.7
million, compared with $1,076.2 million during Q4 2022. Revenue
from continuing operations increased to $4,239.7 million for
full-year 2023, compared with $3,455.1 million for full-year 2022.
The 23% year-over-year increase is due to the increase in
production at Tasiast and La Coipa and higher average realized gold
price.
Production cost of sales:
Production cost of sales from continuing operations per Au eq.
oz.2 sold was $976 for Q4 2023, compared with $848 in Q4
2022. Production cost of sales from continuing operations per Au
eq. oz.2 sold was $942 for full-year 2023, largely in
line with $937 per Au eq. oz. for full-year 2022.
Production cost of sales from continuing
operations per Au oz. sold on a by-product basis3 was
$936 in Q4 2023 compared with $793 in Q4 2022, based on gold sales
of 543,173 ounces and silver sales of 1,890,563 ounces. Production
cost of sales from continuing operations per Au eq. oz. sold on a
by-product basis3 was $892 for full-year 2023, in line
with $912 for full-year 2022, based on 2023 gold sales of 2,074,989
ounces and silver sales of 8,718,491 ounces.
Margins5: Kinross’
margin from continuing operations per Au eq. oz. sold was $998 for
Q4 2023, compared with the Q4 2022 margin of $883. Full-year 2023
margin from continuing operations per Au eq. oz. sold was $1,003,
compared with $856 for full-year 2022.
All-in sustaining
cost3: All-in sustaining cost from continuing
operations per Au eq. oz. sold was $1,353 in Q4 2023, compared with
$1,236 in Q4 2022. Full-year all-in sustaining cost from continuing
operations per Au eq. oz. sold was $1,316, compared with $1,271 for
full-year 2022.
In Q4 2023, all-in sustaining cost from
continuing operations per Au oz. sold on a by-product
basis3 was $1,328, compared with $1,203 in Q4 2022.
All-in sustaining cost from continuing operations per Au oz. sold
on a by-product basis3 was $1,284 for full-year 2023,
compared with $1,255 in 2022.
Operating cash
flow6: Operating cash flow from continuing
operations was $410.9 million for Q4 2023, compared with $474.3
million for Q4 2022. Operating cash flow from continuing operations
for full-year 2023 was $1,605.3 million, compared with $1,002.5
million for full-year 2022, primarily due to the increase in
margins.
Adjusted operating cash flow3 from
continuing operations for Q4 2023 was $407.4 million, compared with
$496.1 million for Q4 2022. Adjusted operating cash
flow3 from continuing operations for full-year 2023 was
$1,669.9 million, compared with $1,256.5 million in 2022.
Attributable1
free cash flow3:
Attributable free cash flow from continuing operations was $116.7
million in Q4 2023, compared with $162.6 million in Q4 2022.
Attributable free cash flow for full-year 2023 from continuing
operations was $559.7 million compared with attributable free cash
flow of $247.3 million in 2022.
Earnings7: Reported
net earnings from continuing operations were $65.4 million for Q4
2023, or $0.06 per share, compared with reported net loss of $106.0
million, or $0.08 per share, for Q4 2022. Full-year reported net
earnings in 2023 were $416.3 million, or $0.34 per share, compared
with reported net earnings of $31.9 million, or $0.02 per share, in
2022.
Adjusted net
earnings3,8 from continuing
operations were $140.0 million, or $0.11 per share, for Q4 2023,
compared with $108.2 million, or $0.09 per share, for Q4 2022.
Full-year adjusted net earnings3,8
from continuing operations were $539.8 million, or $0.44 per share,
compared with $283.1 million, or $0.22 per share, for full-year
2022.
Attributable1
capital expenditures4: Full-year
attributable capital expenditures from continuing operations were
$1,055.0 million compared with $755.0 million for 2022. The
full-year increase was primarily due to an increase in capital
stripping at Tasiast and Fort Knox, and increased development
activities at the Manh Choh project. Capital expenditures from
continuing operations4 were $311.3 million for Q4 2023,
compared with $316.8 million for Q4 2022. Capital expenditures from
continuing operations4 for full-year 2023 were $1,098.3
million, compared with $764.2 million in 2022.
Balance sheet
During the quarter, the Company repaid the
$140.0 million balance on its Tasiast loan, ahead of its 2027
maturity date, and the remaining $50 million balance on the
revolving credit facility.
After the repayments, Kinross had cash and cash
equivalents of $352.4 million as of December 31, 2023, compared
with $418.1 million at December 31, 2022.
The Company had additional available
credit10 of $1,557.5 million as of December 31, 2023,
and total liquidity9 of approximately $1.9 billion.
Return of capital
As part of its continuing quarterly dividend
program, the Company declared a dividend of $0.03 per common share
payable on March 21, 2024, to shareholders of record as of March 6,
2024. In 2023, the Company did not repurchase any shares.
Operating results
Mine-by-mine summaries for 2023 fourth-quarter
and full-year operating results may be found on pages 21 and 25 of
this news release. Highlights include the following:
Tasiast performed strongly in
2023, with production increasing 15% compared with full-year 2022.
The record annual production was mainly a result of strong grades,
record throughput following the completion of the Tasiast 24k
project, and higher recoveries. Quarter-over-quarter, production
was lower as a result of lower grades and timing of ounces
processed at the mill, partially offset by higher throughput and
recovery.
Tasiast’s full-year cost of sales per ounce was
lower year-over-year mainly due to the increase in production as
well as the higher proportion of capital development related to
capital stripping of West Branch 5. Cost of sales per ounce sold
was largely in line quarter-over-quarter. Following the completion
of the solar power plant, the Company expects to realize immediate
and long-term operating cost savings.
Paracatu full-year production
increased compared with 2022 primarily due to an increase in mill
throughput, as well as record-high recoveries, partially offset by
lower grades. Production decreased quarter-over-quarter mainly due
to lower grades, as expected, partially offset by higher mill
throughput. Cost of sales per ounce sold was higher in both
comparable periods mainly due to lower ounces sold and increased
mining volumes, as expected, and unfavourable foreign exchange
changes.
La Coipa continued to perform
well and achieved record quarterly production since its restart in
February 2022 driven by strong grades and throughput. Cost of sales
per ounce was higher year-over-year and quarter-over-quarter mainly
due to a reduction in capitalized stripping.
Fort Knox full-year production
and cost of sales were largely in line with 2022.
Quarter-over-quarter production increased mainly due to higher mill
throughput as well as timing of ounces processed in the mill.
Compared with Q3 2023, cost of sales per ounce sold was higher
mainly due to less capital development, partially offset by higher
production.
Round Mountain full-year
production increased year-over-year primarily due to an increase in
ounces recovered from the heap leach pads. Quarter-over-quarter
production decreased primarily due to fewer ounces recovered from
the heap leach pads, partially offset by higher grades. Full-year
cost of sales per ounce increased year-over-year mainly as a result
of higher-cost ounces recovered from the heap leach pads and less
capital development. Cost of sales per ounce sold in Q4 2023
decreased compared with the previous quarter largely due to lower
costs related to labour and consumables, partly offset by timing of
inventory movements.
Bald Mountain full-year
production decreased largely due to lower grades and timing of
ounces recovered from the heap leach pads. Compared with the
previous quarter, production increased mainly due to higher grades.
Full-year cost of sales per ounce sold increased as a result of
higher-cost heap leach ounces, as well as higher contractor,
reagent and maintenance costs. Compared with Q3 2023, fourth
quarter cost of sales per ounce sold was lower mainly due to higher
production, a higher proportion of capital development, and lower
contractor and reagent costs, partially offset by timing of ounces
recovered.
Development projects
Great Bear
At the Great Bear project, the
Company’s robust exploration program continues to make excellent
progress, execution planning for the advanced exploration program
is well underway, and permitting continues to advance on plan.
Following the completion of its 2023 drilling
program, Kinross has increased Great Bear’s mineral resource
estimate to approximately 2.8 Moz. of measured and indicated
resources and approximately 3.3 Moz. of inferred resources. This
includes the addition of more than one million higher-grade,
underground inferred ounces, representing a 45% year-over-year
increase.
Kinross continues to add higher-grade material to the
underground resource base, as demonstrated by the year-over-year
increase in the inferred grade, which went from 3.6 g/t to 4.5 g/t.
While the primary additions were in the LP zone, resources at Hinge
and Limb, traditional Red Lake style deposits proximal to the LP
zone, also increased. Further, high-grade intercepts below the
resource at Hinge in 2023 demonstrated the potential for this
mineralization to also continue at depth potentially supplementing
LP zone production in the future.
The updated mineral resource estimate is set out in the table
below:
|
Great Bear Mineral Resource estimates |
|
|
|
2022
(Au koz) |
Year-over-year additions
(Au koz) |
2023
(Au koz) |
Grade
(Au g/t) |
|
Measured and Indicated Resources |
2,737 |
75 |
2,813 |
2.7 |
|
Inferred Resources |
2,290 |
1,025 |
3,315 |
4.5 |
Since the last update on November 8, 2023, the Company has received
additional assay results, with a selection of the new results
highlighted below. Recent results highlighted in this release
were received after the 2023 resource database cut-off and have not
been used to inform year end resource figures.
Notable exploration results at Great Bear in the fourth
quarter include:
- BR-807 (Discovery)
2.7m @ 9.7 g/t Au at a vertical depth of 880m
- BR-814C6 (Yauro)
6.6m @ 8.4 g/t Au at a vertical depth of 750m
- Including 2.3m @ 23.3 g/t Au
- BR-819 (Auro) 8.9m @
13.9 g/t Au at a vertical depth of 700m
- Including 2.3m @ 51.5 g/t Au
- BR-843AC1A (Yuma)
15.4m @ 89.1 g/t Au at a vertical depth of 900m
- Including 3.5m @
389.6 g/t Au
- BR-890 (Discovery)
1.6m @ 18.8 g/t Au at a vertical depth of 1070m
These results continue to support the view of a
high-grade, large, long-life mining complex at Great Bear. Hole
BR-843AC1A has intersected 3.5m @ 389.6 g/t at 900m vertical depth
at Yuma and is expected to further increase the grade of already
high-grade resource stopes in that area. Holes BR-814C6 and BR-819
demonstrate the continuity of wide, high-grade mineralization below
the current resource at Yauro and Auro respectively. To the
northwest, holes BR-807 and BR-890A have intersected high-grade
mineralization at depths of 880m and 1070m respectively, vertically
below surface which highlights the highly prospective undertested
area beneath Discovery.
Kinross is progressing provincial permitting,
engineering, and execution planning activities for an advanced
exploration (AEX) program that would establish an underground
decline to obtain a bulk sample and allow for definition and infill
drilling in the LP zone. The mining lease for the main AEX surface
footprint has now been received, providing Kinross with the
necessary surface and mining rights to develop the AEX project,
subject to obtaining the required provincial permits.
Detailed engineering for AEX infrastructure is
well underway, and orders have been placed for the onsite camp and
high-quality water treatment facility. Procurement activities for
additional infrastructure and site construction activities are
progressing well.
Kinross is targeting a start of the surface
construction for the AEX program in the second half of 2024,
subject to receipt of permits, with start of the underground
decline planned in mid-2025.
For the main project, Kinross continues to
advance technical studies, including engineering and field test
work campaigns, with plans to release the results of this work in
the form of a preliminary economic assessment in the second half of
2024.
The required Federal Impact Assessment for the
main project is underway. The Initial Project Description has been
submitted to the Impact Assessment Agency of Canada, formally
kicking off the federal assessment process. The Detailed Project
Description is expected to be formally submitted in Q1 2024.
Studies are ongoing and the Company expects to file its Impact
Statement in the first half of 2025.
Selected Great Bear Drill
Results
See Appendix A for full results.
|
Hole ID |
|
From
(m) |
To
(m) |
Width
(m) |
True
Width (m) |
Au
(g/t) |
Target |
|
BR-807 |
|
964.5 |
980.6 |
16.1 |
14.1 |
0.59 |
Discovery |
|
BR-807 |
and |
994.5 |
1,009.5 |
15.0 |
13.2 |
1.65 |
|
|
BR-807 |
including |
1,002.3 |
1,008.0 |
5.8 |
5.1 |
3.33 |
|
|
BR-807 |
and |
1,027.2 |
1,037.7 |
10.5 |
9.2 |
0.44 |
|
|
BR-807 |
and |
1,059.0 |
1,069.5 |
10.5 |
9.2 |
0.89 |
|
|
BR-807 |
and |
1,084.8 |
1,089.0 |
4.2 |
3.7 |
1.74 |
|
|
BR-807 |
and |
1,095.7 |
1,209.0 |
113.3 |
99.7 |
0.67 |
|
|
BR-807 |
including |
1,106.7 |
1,109.7 |
3.0 |
2.7 |
9.68 |
|
|
BR-807 |
and including |
1,207.9 |
1,209.0 |
1.2 |
1.0 |
21.70 |
|
|
BR-814C6 |
|
717.7 |
729.4 |
11.7 |
9.4 |
0.71 |
Yauro |
|
BR-814C6 |
and |
893.3 |
897.2 |
3.9 |
3.1 |
0.61 |
|
|
BR-814C6 |
and |
910.8 |
919.0 |
8.3 |
6.6 |
8.40 |
|
|
BR-814C6 |
including |
913.2 |
916.0 |
2.9 |
2.3 |
23.32 |
|
|
BR-814C6 |
and |
928.0 |
931.3 |
3.3 |
2.6 |
0.72 |
|
|
BR-814C6 |
and |
1,036.5 |
1,040.5 |
4.0 |
3.2 |
6.91 |
|
|
BR-814C6 |
including |
1,037.5 |
1,040.5 |
3.0 |
2.4 |
8.78 |
|
|
BR-814C6 |
and |
1,068.0 |
1,074.6 |
6.6 |
5.2 |
0.72 |
|
|
BR-819 |
|
849.2 |
855.7 |
6.5 |
5.7 |
0.38 |
Auro |
|
BR-819 |
and |
876.0 |
886.2 |
10.2 |
8.9 |
13.87 |
|
|
BR-819 |
including |
879.0 |
881.7 |
2.7 |
2.3 |
51.45 |
|
|
BR-843AC1A |
|
1,317.1 |
1,336.4 |
19.3 |
15.4 |
89.14 |
Yuma |
|
BR-843AC1A |
including |
1,317.1 |
1,321.5 |
4.4 |
3.5 |
389.57 |
|
|
BR-843AC1A |
and |
1,481.8 |
1,484.8 |
3.0 |
2.4 |
2.07 |
|
|
BR-890A |
|
1,331.5 |
1,363.2 |
31.7 |
26.3 |
2.01 |
Discovery |
|
BR-890A |
including |
1,361.2 |
1,363.2 |
2.0 |
1.6 |
18.79 |
|
|
BR-890A |
and |
1,369.5 |
1,375.7 |
6.2 |
5.1 |
0.77 |
|
Results are preliminary in nature and are subject to
on-going QA/QC. Lengths are subject to rounding.
See Appendix B for a LP zone long section.
Manh Choh
At the 70% owned Manh Choh
project, of which Kinross is the operator, construction is
essentially complete, on budget and on schedule for production in
the second half of 2024. Mining activities are well underway
including the commencement of ore mining and stockpiling.
Transportation of ore to Fort Knox, where it will be processed, has
commenced and will gradually increase throughout the first half of
the year.
Modifications to the Fort Knox mill continue to
progress on schedule and on budget. Construction of the
conveyors and associated buildings are planned for the first
quarter along with interior piping and mechanical installations.
The commissioning and operational readiness team is in place and
preparing for pre-commissioning activities following the mechanical
completion of each area.
Tasiast solar power plant
At the Tasiast solar power
plant, construction of the solar field and battery system
is now complete, with first solar power delivered to the Tasiast
grid in December 2023. Commissioning of the battery system and
energy management system will continue in early 2024, supporting
the solar field and battery system integration and power ramp-up.
During the first quarter of 2024, grid scenario testing involving
incumbent generators, the solar field, and battery systems will
continue toward ensuring stable power from this new renewable
energy source. The Tasiast solar power plant has a continuous
power generation capacity of 34MW and an 18MW battery storage
system.
Round Mountain
The extension strategy at Round
Mountain is advancing on plan. At Phase
S, the operations team is in place and stripping remains
on schedule. For the heap leach pad expansion, detailed engineering
is complete, procurement is in progress, and construction
activities remain on track.
At Phase X, development of the
exploration decline is progressing well and more than 50% complete,
with approximately 1,475 metres developed so far, and is
approaching the target mineralization. Underground definition
drilling commenced in early 2024 and is set to ramp up throughout
the year. The Company expects to begin drilling the primary Phase X
target in Q2. At Gold Hill, drilling
continues to progress as planned with an infill program from the
bottom of the pit and exploration drilling from surface.
Chile
Kinross’ activities in Chile are currently
focused on La Coipa and potential opportunities to extend its mine
life. The Lobo-Marte project continues to provide
optionality as a potential large, low-cost mine upon the conclusion
of mining at La Coipa. While the Company focuses its technical
resources on La Coipa, it will continue to engage and build
relationships with communities related to Lobo-Marte and government
stakeholders.
Company Guidance
The following section of the news release represents
forward-looking information and users are cautioned that actual
results may vary. We refer to the risks and assumptions contained
in the Cautionary Statement on Forward-Looking Information on page
48 of this news release.
This Company Guidance section below
references all-in sustaining cost per equivalent ounce sold and
sustaining, non-sustaining and attributable capital expenditures,
which are non-GAAP ratios and financial measures, as applicable,
with no standardized meaning under IFRS and therefore, may not be
comparable to similar measures presented by other issuers. The
definitions of these non-GAAP ratios and financial measures and
comparable reconciliations are included on pages 26 to
30 of this news release.
Attributable1
production guidance
In 2024, Kinross expects to produce 2.1 million
attributable Au eq. oz.11 (+/- 5%) from its operations,
in line with total 2023 production of 2,153,020 Au eq. oz. Kinross’
annual production is expected to remain stable in 2025 and 2026 at
2.0 million attributable Au eq. oz.11 (+/-
5%) per year.
Annual attributable1
gold equivalent production guidance
(+/- 5%) |
|
2024 |
2.1 million oz. |
|
2025 |
2.0 million oz. |
|
2026 |
2.0 million oz. |
In 2024, attributable production is expected to be higher in the
second half of the year, which is largely driven by expected
initial production at Manh Choh, as well as higher production at
Paracatu.
Attributable1
cost guidance
Production cost of sales is expected to be
$1,020 per Au eq. oz.11 (+/- 5%) for 2024. In
2023, production cost of sales was $942 per Au eq. oz. The moderate
year-over-year increase in 2024 is mainly due to production mix,
including higher expected production from the Company’s U.S. assets
and lower production at Paracatu, and inflationary impacts.
The Company expects its all-in sustaining
cost3 to be $1,360 per Au eq. oz. (+/- 5%) for 2024. In
2023, all-in sustaining cost3 was $1,316 per Au eq. oz.
sold.
2024 attributable1
production and cost guidance
|
Attributable basis1 |
Q4 2023
results |
2023 full-year
results |
2024 guidance
(+/- 5%) |
| Gold equivalent
basis |
|
|
|
|
Production (Au eq. oz.) |
546,513 |
2.15 million |
2.1 million11 |
|
Production cost of sales per Au eq. oz.2 sold |
$976 |
$942 |
$1,020 |
|
All-in sustaining cost per Au eq. oz. sold3 |
$1,353 |
$1,316 |
$1,360 |
2024 attributable1
production and cost guidance by country
|
Country |
2024 production
guidance
(Au eq. oz.)11
(+/-5%) |
Percentage
of total
forecast
production12 |
2024 guidance
production cost of sales
(per Au eq. oz. sold)2,11
(+/-5%) |
2023 production
cost of sales
(per Au eq. oz. sold)2 |
|
United States |
730,000 |
35% |
$1,330 |
$1,318 |
|
Brazil |
510,000 |
24% |
$1,080 |
$909 |
|
Chile |
250,000 |
12% |
$800 |
$681 |
|
Mauritania |
610,000 |
29% |
$670 |
$661 |
|
TOTAL |
2.1 million |
100% |
$1,020 |
$942 |
Material assumptions used to forecast 2024 production cost of sales
are as follows:
- a gold price of $2,000 per
ounce;
- a silver price of $25 per
ounce;
- an oil price of $75 per
barrel;
- foreign exchange rates of:
- 4.75 Brazilian reais to the U.S.
dollar;
- 800 Chilean pesos to the U.S.
dollar;
- 35 Mauritanian ouguiyas to the U.S.
dollar; and
- 1.30 Canadian dollars to the U.S.
dollar;
Taking into account existing currency and oil hedges:
- a 10% change in foreign currency
exchange rates13 would be expected to result in an
approximate $20 impact on production cost of sales per
ounce;
- specific to the Brazilian real, a
10% change in this exchange rate would be expected to result in an
approximate $40 impact on Brazilian production cost of sales per
ounce;
- specific to the Chilean peso, a 10%
change in this exchange rate would be expected to result in an
approximate $30 impact on Chilean production cost of sales per
ounce;
- a $10 per barrel change in the
price of oil would be expected to result in an approximate $3
impact on fuel consumption costs on production cost of sales per
ounce; and
- a $100 change in the price of gold
would be expected to result in an approximate $4 impact on
production cost of sales per ounce as a result of a change in
royalties.
Attributable1 capital
expenditures4 guidance
Attributable capital expenditures for 2024 are
forecast to be approximately $1,050 million (+/- 5%) and are
summarized in the table below. The 2024 capital expenditures
guidance is in line with 2023 results.
Kinross’ attributable capital expenditures
outlook for 2025 and 2026 is $850 million and $650 million,
respectively, based on currently approved projects. As Kinross
continues to develop and optimize its portfolio for production
beyond 2026, other projects may be incorporated into its capital
expenditures, as well as potential inflationary impacts, over the
2024-2025 timeframe.
Country |
Forecast 2024
sustaining
capital14
(+/-5%)
(attributable)1
(million) |
Forecast 2024
non-sustaining
capital14
(+/-5%)
(attributable)1
(million) |
Total 2024
forecast
capital14
(+/-5%)
(attributable)1
(million)
|
2023
sustaining
capital3
million)
|
2023
non-sustaining
capital3
(million)
|
2023
total capital
(consolidated)
(million)
|
2023
total capital
(attributable)1
(million)
|
|
U.S. |
$250 |
$180 |
$430 |
$303 |
$216 |
$519 |
$476 |
|
Brazil |
$145 |
$0 |
$145 |
$167 |
$0 |
$167 |
$167 |
|
Chile |
$55 |
$15 |
$70 |
$36 |
$39 |
$75 |
$75 |
|
Mauritania |
$50 |
$270 |
$320 |
$46 |
$263 |
$309 |
$309 |
|
Canada15 and
other |
$0 |
$85 |
$85 |
$2 |
$26 |
$28 |
$28 |
|
|
|
|
|
|
|
|
|
|
TOTAL |
$500 |
$550 |
$1,050 |
$554 |
$544 |
$1,098 |
$1,055 |
2024 sustaining capital14 includes the
following forecast spending estimates:
|
• Mine development: |
$115 million (United States); $20 million (Chile); |
|
• Mobile equipment: |
$65 million (United States); $60 million (Brazil); $5 million
(Chile); $20 million (Mauritania) |
|
• Mill facilities: |
$5 million (United States); $25 million (Brazil); $10 million
(Chile); $5 million (Mauritania) |
|
• Leach facilities: |
$25 million (United States) |
|
• Tailings facilities: |
$5 million (United States); $50 million (Brazil), $5 million
(Chile); $15 million (Mauritania) |
2024 non-sustaining capital14 includes the
following forecast spending estimates:
|
• Tasiast West Branch stripping: |
$235 million |
|
• Round Mountain Phase S stripping and others: |
$120 million |
|
• Great Bear AEX and studies15: |
$85 million |
|
• Manh Choh (70%)16: |
$60 million |
|
• Development and growth projects and studies: |
$50 million |
Other 2024 guidance
|
Category |
2024 Guidance |
Summary |
Exploration and Business
Development ($M)
|
$185 (+/- 5%) |
2024 guidance includes
approximately $160 million of exploration spend on greenfields,
brownfields and minex exploration targets (2023 - $158.9
million).
For details about the 2024 exploration program, see page 14.
|
General and Administrative
($M)
|
$115 (+/- 5%) |
Largely in line with 2023
results.
|
Other Operating Costs ($M)
|
~$100 |
Primarily relates to studies and
permitting activities, as well as care and maintenance and
reclamation activities at non-operating sites.
|
Effective Tax Rate
(ETR)17
|
33% - 38% |
ETR based on adjusted net
earnings3 from continuing operations.
|
Taxes paid (cash) ($M)
|
$155 |
Taxes paid is expected to increase by approximately $5 million for
every $100/oz movement in the realized gold price.
|
DD&A ($/oz.)18
|
$540/oz. (+/- 5%) |
The forecasted increase in
DD&A per ounce largely relates to an increase in depreciable
asset base, relating to assets recently or to be put into service
for 2024.
|
Interest paid ($M)
(incl. capitalized interest)
|
$150 |
Includes approximately $105
million of capitalized interest and $45 million of interest
expense.
Interest expense excludes accretion of the Company’s reclamation
and remediation obligations, as well as lease liabilities, which
for 2023 totaled $39.1 million. |
Environment, Social and Governance
In 2023, Kinross continued its strong ESG
performance through implementation of its ESG strategy, with
priority focus areas in Workforce and Communities, Natural Capital
and Climate and Energy. ESG is a key factor in the Company’s
culture, business strategy and future growth plans. Our focus on
strong governance was maintained, including a bespoke ESG training
session conducted for the Board of Directors. In addition, updated
Social Performance standards were developed, while work began on
updating the standards for health and safety, and environment.
Kinross maintained consistently high ESG ratings
as measured by S&P CSA, MSCI, Refinitiv, Moody’s ESG, and
Sustainalytics. With a 97th percentile ranking as of
December 31, 2023, in its S&P Global Corporate Sustainability
Assessment (CSA), Kinross was named a constituent of the Dow Jones
Sustainability Indices (DJSI) World Index for 2023 and the S&P
ESG 1200. In The Globe and Mail’s annual Board Games
governance rating, Kinross maintained its ranking
in the top group of Canadian mining companies. Kinross obtained
external assurance of conformance with the Responsible Gold Mining
Principles, which were established by the World Gold Council, and
was provided a limited assurance statement as of March 31, 2023.
The Company has established an ongoing process to ensure that every
Kinross site meets the conformance requirements every three
years.
Across sites, operational ESG performance
focused on the Company’s First Priorities including health and
safety, environment, and communities. In health and
safety, the Company maintained low injury frequency rates
that were in line with three-year averages and continued its focus
on a people-centric and progressive safety philosophy. In
environment, Kinross completed a detailed
assessment of the Company’s status against the requirements of the
Task Force on Nature-related Disclosures and plans to use the
results to inform development of a Natural Capital strategy during
2024. At Paracatu, Kinross published a book on the flora and fauna
of the Cerrado biodiversity corridor, also highlighting the
Company’s long-term strategy to protect the biodiversity of this
critical region in Brazil.
Kinross has also progressed on its
Climate Strategy. Kinross is focused on renewable
power purchase agreements, electric autonomous haulage
partnerships, and energy-efficient opportunities across sites. The
outcome of these initiatives is that Kinross is on track to achieve
its greenhouse gas reduction goal of reducing emissions intensity
by 30% in 2030 from its baseline. The Tasiast solar power
plant, which has power generation capacity of 34MW and a
battery system of 18MW, was completed and is expected to provide
annualized fuel savings of 17 million litres of heavy oil, with a
payback of less than five years. This translates into an 18%
reduction of GHG emissions from the power plant over life of mine.
Annualized GHG emissions reductions are estimated at 50 kilotonnes
CO2e and, as a result, 22.5% of Tasiast’s energy
generation will be from renewable sources.
In host communities, a high level of
interactions was maintained and approximately $10 million of
monetary and in-kind contributions were made through site
community investment strategies throughout the
year. In the fourth quarter, Kinross Chile donated three fully
equipped research facilities to the University of Atacama’s high
altitude research station in the Nevado Tres Cruces National Park
near the La Coipa mine.
Kinross’ support of education
and training continued across all our sites. In Alaska, the Company
donated $350,000 to the University of Alaska Fairbanks to establish
the ‘Kinross Alaska Future Leaders Scholarship,’ which will focus
on advancing the inclusion of underrepresented people in the
resource development industry. In Canada, the endowed Kinross Chair
in Environmental Governance at the University of Guelph continued
to advance knowledge, with the most recent Chair exploring links
between the environment and reconciliation. In Chile, research
agreements are now in place with the University of Atacama in areas
covering health and safety as well as paleontology.
Kinross continued its close engagement with
Indigenous peoples related to its mines and
operations. At the Great Bear project in northwestern Ontario, an
updated exploration agreement was signed together with the
Wabauskang and Lac Seul First Nations. At the Manh Choh project in
Alaska, a groundbreaking ceremony was held with the presence of the
Chief, elders, and delegates from the Native Village of Tetlin, as
well as Alaska’s Governor and other government officials.
Through an in-depth consultation process across
all Kinross sites and coordinated through the Kinross Global
Inclusion and Diversity Council, an updated Diversity,
Equity and Inclusion Strategy was developed. Roll-out of
this strategy will commence in 2024. In 2023, Kinross achieved the
highest percentage of female employees to date and also increased
the percentage of women across all levels of management. Kinross
launched an updated set of leadership principles designed to
provide leaders at all levels with clear expectations about what
makes a leader at Kinross and how strong leadership enhances
business outcomes. Through our support for Skills for Change in
Toronto, the Company helped 40 black youth get training in Science,
Technology, Engineering and Math (STEM) subjects.
In anticipation of Bill S-211, Canada’s Modern
Slavery Act, which aims to prevent and reduce the risk of forced
labour in supply chains, a human rights task force was established
to provide cross-functional coordination on the important work
being done in this area and to help prepare the Company’s first
modern slavery statement to be published in May 2024.
For more information on Kinross’ sustainability
performance, see the Company’s 2022 Sustainability and ESG
Report and its ESG Analyst Centre located on
the Company website. The Sustainability and ESG Report follows the
Global Reporting Initiative (GRI) and Sustainability Accounting
Standards Board (SASB) reporting standards. The Company’s 2023
Sustainability and ESG Report is expected to be published in May
2024.
Exploration update
In 2023, approximately 300,000 metres of
drilling was completed for all exploration projects (brownfields,
greenfields, minex).
Brownfields exploration
The Company’s brownfields exploration efforts –
which accounts for approximately 90% of the Company’s exploration
budget – continued to primarily focus within the footprint of
existing mines and projects during 2023.
Highlights of the 2023 brownfields exploration
programs include results from: Round Mountain, Curlew Basin,
Alaska, Bald Mountain, Tasiast and Chile, as well as Great Bear as
detailed on page 6.
Round Mountain
The Phase X exploration decline that commenced
in 2023 is designed to provide a platform for definition drilling
of the main Phase X underground target. The exploration
program plans for definition drill holes in critical areas to
test growth potential outward from the main zone of mineralization,
in particular testing for continuity of mineralization along strike
in areas where surface drilling was limited. Exploration holes are
also planned to be drilled at the end of the decline to test for
mineralization beyond the planned development. In parallel with
developing the decline, Kinross has commenced opportunity drilling
between the open pit and the main underground target in Q4
2023.
2023 exploration work at Gold Hill demonstrated
significant upside potential at this organic growth target. This
year’s work confirmed an 800 metre strike extension of multiple
veins yielding high grade intercepts within the Jersey vein zone
(D-1195, -94 and -96), suggesting that this robust system continues
and remains open (reported in Q2 2023). These results build on
successful strike extensions from previous years.
Exploration drilling (7,950m) at Gold Hill was
accelerated to be completed in the first half of 2023 to fuel
studies and initial permitting efforts. Exploration drilling from
surface and definition drilling from the bottom of the pit resumed
in Q4 2023 and is planned to continue into the first half of
2024.
Curlew Basin
Results at Curlew Basin continue to trend well.
At this organic growth project, the 2023 exploration program
(16,900m diamond drilling) delivered the following successes:
- Confirmed extensions and continuity
in several critical vein zones with multiple wide, high-grade
intercepts.
- ST-1312 – 27.1m @ 12.5 g/t Au, includes
10.7m @ 19.9 g/t Au
- ST-1181 – 2.5m @ 198.4 g/t Au, includes 0.3m @
1,610.0 g/t Au
- Demonstrated upside potential
continues with the spatially distinct mineralization at the new
“Roadrunner” zone (reported in Q3 14.2m @16.5 g/t
Au, includes 7.3m @ 25.3 g/t Au).
Underground drilling resumed in Q4 2023 and will be the primary
focus for the first half of 2024.
- Meaningful resource increase,
including a 34% increase in the inferred resource (note: the
cut-off date for the 2023 year-end mineral resource estimate
precedes the new intercepts listed above).
In 2024, Kinross plans to follow up on resource
growth and new discoveries.
Alaska
Drilling this year in Alaska primarily focused on two main
areas: targets for proximal growth around the Fort Knox pit, and
targets for potential deeper underground mineralization.
Proximal growth highlights include:
- FFC23-1879 – 24.7m @ 3.5 g/t Au, includes 3.8m @ 22.7 g/t
Au
- FFC23-1868 – 58.8m @ 0.8 g/t Au
- FFC23-1903 – 38.7m @ 1.8 g/t Au, includes 6.3m @ 6.0 g/t
Au
- FFC23-1904 – 24.3m @ 1.3 g/t Au, includes 4.0m @ 5.4 g/t
Au
Underground Dandelion shear highlight:
- FFC23-1871 – 3.2m @ 25.7 g/t Au
These proximal growth highlights have not been
included in the current resource update and may offer potential to
augment medium-term production plans at Fort Knox.
At Manh Choh, 2,090 metres of drilling was
completed across six target areas. The near-mine exploration area
was expanded to include several new targets identified along the
mine road corridor. Regional reconnaissance work also continued
this year and will continue across the greater Tetlin lease area in
2024.
Bald Mountain
Exploration drilling focused on near-term growth
enabling the addition of 78koz. to reserves this year. In 2024, the
strategy will continue to focus on low-strip, near-pit extensions
across six target areas in the North and South area of operations,
as well as test new target areas within the Bida trend.
Tasiast
At Tasiast, exploration drilling resumed in Q4
2023 targeting soil anomalies in the north satellite area on the
TMLSA license. The work tested for the potential northern extension
of a known structure that forms part of the 75km long Aoueouat
Greenstone Belt, hosting Kinross’ known gold deposits. The reverse
circulation drill program successfully outlined mineralization and
proved the continuity of a known structure. A follow-up drilling
program is planned later this year.
Reverse circulation drilling of priority targets
on the SENISA licenses also began in Q4 2023 and is expected to
continue throughout the year. The initial program was designed to
test the western extremity of the greenstone belt, roughly 9km due
west of Kinross’ Piment deposit, where favorable geochemistry and
prospecting had outlined anomalous gold.
Drilling around the existing operations for deep
extensions at West Branch, Piment and Prolongation that could
support underground mining will be a focus in 2024, with deep
drilling expected to begin later this year.
Chile
In Chile, the brownfields drilling program was
successful in uncovering potential porphyry mineralization when
testing a target at Cerros Bravos on Kinross’ 100% owned property.
The porphyry is located approximately 8km due north of Kinross’
mine facilities. Follow-up work in 2024 is expected to include
geophysics and additional drilling.
At the La Coipa extensions, approximately
~15,000 metres were drilled in 2023 in and around current and
historically active pits to extend oxide mineralization and
generate geotechnical and geometallurgical data to support
progressing these projects.
Brazil
In Brazil, brownfields and greenfields
exploration efforts are focused on the Company’s extensive land
packages, which are primarily along the northwest corridor from the
Paracatu mine. Kinross’ land holdings extend for over 35km and are
hosted by the sedimentary package that hosts Paracatu. Extensive
soil surveying has uncovered numerous anomalies that have been
followed up by prospecting, sampling and mapping. Recent drilling
of some of these anomalies have revealed similar style
mineralization and grades to Paracatu.
In 2024, Kinross expects to actively drill a
number of untested targets and follow up on the best results.
Greenfields exploration
update
The primary greenfields exploration strategy is
to identify and explore in areas that have the potential to host
high-grade gold deposits. The Company looks for opportunities where
it can stake its own claims or collaborate with high-quality junior
exploration companies through either joint venture agreements or
via equity investment. The primary focus is exploring for orogenic,
epithermal, Carlin and intrusion related gold and gold-copper style
deposits.
The greenfields exploration programs in 2023
were focused on targets located in Canada, the USA and Finland with
approximately 52,000 metres of drilling completed on all
projects.
Canada
Outside of Great Bear, the focus in Canada was
on the large land holdings in Snow Lake, Manitoba, where Kinross
has 100% ownership in six exploration properties: Laguna, Puella
Bay, Lucky Jack, Laguna North, DSN and SLG. Work on the Laguna and
the Laguna North properties over the past few years has uncovered
gold rich, shear hosted vein systems.
Prospecting and mapping on the Laguna North
property was successful, with the discovery of a new quartz vein
assaying 104.5 g/t Au and 1.8 g/t Ag. Kinross plans to follow
up in the coming field season with more detailed prospecting and
mapping.
Highlights from prospecting and mapping on the
SLG property returned 6.0, 7.4, 9.4 and 11.5 g/t Au from
mineralized quartz vein material within a shear zone that our
geologists have uncovered for over a 200m along strike. Roughly
1.5km due south of the gold showing described above, geologists
uncovered veining that contained copper and zinc mineralization
with one of the samples returning 0.2 g/t Au, 15.5 g/t Ag, 2.03% Zn
and 0.89% Cu. Further work on all of these areas is planned in
2024.
In February 2023, a joint venture was
established with BTU Metals Corp., who holds a large land package
abutting the southern boundary of Kinross’ Great Bear project in
Red Lake, Ontario. Upon signing the agreement, compilation and
modelling work began, and the relogging and sampling of existing
core got underway in the second half of the year and will continue
in 2024. A drilling program is anticipated at the end of the year,
testing the best targets resulting from the relogging and modelling
work.
USA
Kinross holds a number of projects in Nevada
that are either 100% owned or are in joint venture with private
individuals.
Work on Kinross’ various projects consisted of
geophysics, prospecting and mapping as well as reverse circulation
drilling of targets that were more advanced. A total of 38 reverse
circulation drill holes for 12,785 metres, were conducted over the
combined land packages during the year. These properties have the
potential to host low sulphidation epithermal, Carlin and porphyry
style deposits.
Work continues on evaluating and adding new
pipeline projects through third party agreements and claim staking
opportunities in the principal metallogenic belts throughout the US
Great Basin, including the Walker Lane and the primary trends of
Carlin-type deposits.
Finland
In the Central Lapland Greenstone Belt of
northern Finland, exploration was conducted on Kinross’ joint
venture and 100% owned projects. Kinross’ land positions are
proximal to Agnico Eagle’s Kittilä Gold mine and Rupert Resource’s
Ikkari gold deposit, that has reported more than 4 million ounces
at 2.2 g/t Au in indicated resources.
Work in 2023 consisted of prospecting and
mapping during the summer months and Base of Till drilling that was
conducted throughout the year. The resulting gold anomalies were
followed up with diamond drilling. A total of 21 holes for 3,116
metres of core and 10,981 metres of Base of Till drilling was
carried out on Kinross’ various properties.
The latest joint venture agreement was signed
with Aurion Resources on August 23, 2023, for its Launi East
property. The property hosts the potential for orogenic gold
mineralization and contains at least seven gold zones discovered
prior to the joint venture. Limited diamond drilling has been
carried out over the numerous gold showings and work will build on
the existing data and vector in priority areas. Compilation work as
well as mapping and Base of Till drilling was undertaken on the
property before year end. The results will be followed up in
2024.
2024 Focus
For 2024, the exploration expenditure guidance
(brownfields, greenfields and minex) is $160 million (+/-5%)
compared with the $158.9 million spent in 2023. The 2024 programs
are designed to follow-up on existing zones of mineralization and
to make new discoveries in all of Kinross’ jurisdictions.
Looking at the priority exploration projects:
- At Great Bear, expand the mineralized zones, LP, Hinge and
Limb, and explore for new mineralization on Kinross’ land
package
- At Curlew, expand on the existing resource and follow-up on the
newly discovered high-grade mineralization at Roadrunner
- At Round Mountain, begin to delineate the Phase X
mineralization from the underground exploration decline. Additional
drilling from surface and the bottom of the pit at Gold Hill will
test the numerous, high-grade gold veins
- At Tasiast, underground-focused drilling from surface at Piment
and West Branch and exploration of the SENISA and TMLSA land
packages
- In Chile, a number of greenfields and brownfields targets will
be drill tested over the course of the year and the porphyry
mineralization at Cerros Bravos will be followed up
- At Paracatu, expand regional exploration activities
- In Canada, continue to explore the Snow Lake, Manitoba, land
package
Appendix C: Refer to page 42 of
this news release for supplementary illustrations.
Full drill results are available here: www.kinross.com/Exploration-Drill-Results-Appendix-C-Q4-YE-2023
2023 Mineral Reserves and Mineral
Resources update
(See the Company’s detailed Annual
Mineral Reserve and Mineral Resource Statement estimated as at
December 31, 2023 and explanatory notes starting at page
32.)
Kinross maintained its gold price assumptions of
$1,400 per ounce and $1,700 per ounce for its mineral reserve and
mineral resource estimates, respectively, as of December 31,
202310.
The Company also maintained its silver price
assumption of $17.50 per ounce and of $21.30 per ounce for its
mineral reserve and mineral resource estimates5.
Kinross continues to prioritize quality,
high-margin, low-cost ounces in its portfolio, and maintained its
fully loaded costing methodology.
Kinross is focused on upgrading the quality of
its resources and delineating high-grade gold ounces with the
objective of converting to reserves. While there was an overall
reduction in reserves at year-end 2023, additions to resources are
primarily high-grade ounces driven by the substantial increase at
Great Bear.
Kinross Gold Mineral Reserve and Mineral Resource
estimates19
|
|
|
2022
(Au koz) |
Depletion
(Au koz) |
Geology & Engineering
(Au koz) |
2023
(Au koz) |
|
Proven and Probable Reserves |
25,535 |
(2,435) |
(344) |
22,757 |
|
Measured and Indicated Resources |
26,211 |
(69) |
(174) |
25,968 |
|
Inferred Resources |
10,522 |
(85) |
1,049 |
11,484 |
Proven and Probable Mineral Reserves
Kinross’ total proven and probable mineral
reserve estimates decreased by 11%, or 2.8 million Au oz., to 22.8
million Au oz. at year-end 2023 compared with 25.5 million Au oz.
at year-end 2022. The net decrease was mostly due to depletion,
with an additional decrease of 0.4 million Au oz. at Paracatu due
to geological and engineering updates, with decreases offset by an
increase of 0.1 million Au oz. at Bald Mountain due to the addition
of several smaller pits (converting from resource).
The Company’s total proven and probable silver
mineral reserve estimate decreased by 34% or 12.4 million Ag oz. to
23.7 million Ag oz. at year-end 2023 compared with 36.1 million Ag
oz. at year-end 2022. The net decrease was mostly due to depletion
at La Coipa.
Measured and Indicated Mineral
Resources
Kinross’ total measured and indicated mineral
resource estimate at year-end 2023 was 26.0 million Au oz. compared
with 26.2 million Au oz. at year-end 2022. The slight reduction was
largely a result of increased costs at Paracatu, Fort Knox and
small conversions of mineral resources to mineral reserves at Bald
Mountain. Decreases were offset by a geologic increase at
Tasiast.
The Company’s total measured and indicated
silver resources decreased by 10% to 34.0 million Ag oz. at
year-end 2023 compared with 37.6 million Ag oz. at year-end
2022.
Inferred Mineral Resources
Kinross’ total inferred mineral resource
estimate increased by 9% or 1.0 million Au oz. to 11.5 million Au
oz. at year-end 2023, compared with 10.5 million Au oz. at year-end
2022. The increase can be attributed to Great Bear which added 1.0
million ounces of inferred material, and Curlew Basin (Kettle
River).
The Company’s total inferred silver resources decreased by 13%
to 4.0 million Ag oz. at year-end 2023 compared with 4.6 million Ag
oz. at year-end 2022.
Board update
Mr. Ian Atkinson, who has been a Board member
since February 2016, will, pursuant to Kinross’ retirement policy,
be retiring and not stand for re-election at the Company’s Annual
General Meeting of Shareholders in May 2024. Kinross’ management
and Board would like to thank Mr. Atkinson for his many
contributions during his tenure, including those related to his
role as Chair of the Corporate Governance and Nominating Committee
and his membership on the Corporate Responsibility and Technical
Committee and the Human Resources and Compensation Committee.
The Board of Directors of Kinross has appointed
Mr. George Paspalas as a Director with an effective date of January
1, 2024. Mr. Paspalas is a veteran of the mining industry with
nearly 40 years of mining experience and brings a wealth of
knowledge to his new position. He is currently the President &
Chief Executive Officer and a board director of MAG Silver Corp., a
Canadian silver producer and exploration company, a position he has
held from May 2013. Prior to that, Mr. Paspalas held senior
leadership positions at Aurizon Mines Ltd., Silver Standard
Resources Inc., Sargold Resources Corp., and Placer Dome. He has a
B. Eng. (Hons) from the University of New South Wales and has
completed the Advanced Management Program from INSEAD. Mr. Paspalas
has been appointed to sit on the Company’s Corporate Responsibility
and Technical Committee.
The appointment of Mr. Paspalas will support the
transition of Mr. Atkinson’s retirement as both individuals have
commensurate skillsets, including capital markets and senior-level
resource industry experience, deep technical knowledge, and
operational leadership.
Conference call details
In connection with this news release, Kinross
will hold a conference call and audio webcast on Thursday, February
15, 2024, at 8 a.m. ET to discuss the results, followed by a
question-and-answer session. To access the call, please dial:
Canada & US
toll-free – +1 (888) 330-2446; Passcode: 4915537
Outside of Canada & US – +1 (240) 789-2732;
Passcode: 4915537
Replay (available up to 14 days after the
call):
Canada & US toll-free – +1 (800) 770-2030;
Passcode: 4915537
Outside of Canada & US – +1 (647) 362-9199;
Passcode: 4915537
You may also access the conference call on a
listen-only basis via webcast at our website www.kinross.com. The audio
webcast will be archived on www.kinross.com.
This release should be read in conjunction with
Kinross’ 2023 year-end Financial Statements and Management’s
Discussion and Analysis report at www.kinross.com. Kinross’ 2023
year-end Financial Statements and Management’s Discussion and
Analysis have been filed with Canadian securities regulators
(available at www.sedar.com) and furnished
with the U.S. Securities and Exchange Commission (available at
www.sec.gov). Kinross
shareholders may obtain a copy of the financial statements free of
charge upon request to the Company.
About Kinross Gold Corporation
Kinross is a Canadian-based global senior gold
mining company with operations and projects in the United States,
Brazil, Mauritania, Chile and Canada. Our focus is on delivering
value based on the core principles of responsible mining,
operational excellence, disciplined growth, and balance sheet
strength. Kinross maintains listings on the Toronto Stock Exchange
(symbol:K) and the New York Stock Exchange (symbol:KGC).
Media Contact
Victoria Barrington
Senior Director, Corporate Communications
phone: 647-788-4153
victoria.barrington@kinross.com
Investor Relations Contact
Chris Lichtenheldt
Vice-President, Investor Relations
phone: 416-365-2761
chris.lichtenheldt@kinross.com
Review of operations
|
|
|
|
|
|
|
|
|
|
|
|
|
|
Three months ended December 31, |
Gold equivalent ounces |
|
|
|
|
|
|
|
|
Produced |
|
Sold |
|
Production cost of sales ($millions) |
|
Production cost of sales/equivalent ounce
sold |
|
|
2023 |
2022 |
|
2023 |
2022 |
|
2023 |
2022 |
|
2023 |
2022 |
|
|
|
|
|
|
|
|
|
|
|
|
|
|
Tasiast |
160,764 |
143,002 |
|
171,199 |
147,019 |
|
$ |
110.4 |
$ |
96.2 |
|
$ |
645 |
$ |
654 |
|
Paracatu |
127,940 |
180,809 |
|
132,886 |
183,190 |
|
|
144.2 |
|
130.3 |
|
|
1,085 |
|
711 |
| La
Coipa |
73,823 |
67,683 |
|
73,477 |
68,135 |
|
|
52.9 |
|
39.4 |
|
|
720 |
|
578 |
|
|
|
|
|
|
|
|
|
|
|
|
|
| Fort
Knox |
84,215 |
83,739 |
|
81,306 |
87,061 |
|
|
104.3 |
|
102.1 |
|
|
1,283 |
|
1,173 |
| Round
Mountain |
55,764 |
61,929 |
|
56,495 |
67,484 |
|
|
82.6 |
|
95.1 |
|
|
1,462 |
|
1,409 |
| Bald
Mountain |
44,007 |
58,521 |
|
49,375 |
66,847 |
|
|
57.1 |
|
62.8 |
|
|
1,156 |
|
939 |
|
United States Total |
183,986 |
204,189 |
|
187,176 |
221,392 |
|
|
244.0 |
|
260.0 |
|
|
1,304 |
|
1,174 |
|
|
|
|
|
|
|
|
|
|
|
|
|
|
Maricunga |
- |
- |
|
651 |
863 |
|
|
0.2 |
|
0.6 |
|
|
307 |
|
693 |
|
|
|
|
|
|
|
|
|
|
|
|
|
|
Continuing Operations Total |
546,513 |
595,683 |
|
565,389 |
620,599 |
|
|
551.7 |
|
526.5 |
|
|
976 |
|
848 |
|
|
|
|
|
|
|
|
|
|
|
|
|
|
Discontinued Operations |
|
|
|
|
|
|
|
|
|
|
|
|
Kupol |
- |
- |
|
- |
- |
|
|
- |
|
- |
|
$ |
- |
$ |
- |
| Chirano
(100%) |
- |
- |
|
- |
- |
|
|
- |
|
24.3 |
|
|
- |
|
- |
|
|
- |
- |
|
- |
- |
|
|
- |
|
24.3 |
|
|
|
| |
|
|
|
|
|
|
|
|
|
|
|
| |
|
|
|
|
|
|
|
|
|
|
|
|
|
|
Years ended December 31, |
Gold equivalent ounces |
|
|
|
|
|
|
|
|
Produced |
|
Sold |
|
Production cost of sales ($millions) |
|
Production cost of sales/equivalent ounce
sold |
|
|
2023 |
2022 |
|
2023 |
2022 |
|
2023 |
2022 |
|
2023 |
2022 |
|
|
|
|
|
|
|
|
|
|
|
|
|
|
Tasiast |
620,793 |
538,591 |
|
615,065 |
519,292 |
|
$ |
406.8 |
$ |
380.1 |
|
$ |
661 |
$ |
732 |
|
Paracatu |
587,999 |
577,354 |
|
592,224 |
571,164 |
|
|
538.6 |
|
497.6 |
|
|
909 |
|
871 |
| La
Coipa |
260,138 |
109,576 |
|
268,491 |
99,915 |
|
|
182.8 |
|
57.2 |
|
|
681 |
|
572 |
|
|
|
|
|
|
|
|
|
|
|
|
|
| Fort
Knox |
290,651 |
291,248 |
|
287,532 |
291,793 |
|
|
343.5 |
|
350.7 |
|
|
1,195 |
|
1,202 |
| Round
Mountain |
235,690 |
226,374 |
|
234,064 |
227,655 |
|
|
357.7 |
|
309.2 |
|
|
1,528 |
|
1,358 |
| Bald
Mountain |
157,749 |
214,094 |
|
180,139 |
214,808 |
|
|
223.5 |
|
208.8 |
|
|
1,241 |
|
972 |
|
United States Total |
684,090 |
731,716 |
|
701,735 |
734,256 |
|
|
924.7 |
|
868.7 |
|
|
1,318 |
|
1,183 |
|
|
|
|
|
|
|
|
|
|
|
|
|
|
Maricunga |
- |
- |
|
2,421 |
3,191 |
|
|
1.4 |
|
2.1 |
|
|
578 |
|
658 |
|
|
|
|
|
|
|
|
|
|
|
|
|
|
Continuing Operations Total |
2,153,020 |
1,957,237 |
|
2,179,936 |
1,927,818 |
|
|
2,054.3 |
|
1,805.7 |
|
|
942 |
|
937 |
|
|
|
|
|
|
|
|
|
|
|
|
|
Discontinued Operations |
|
|
|
|
|
|
|
|
|
|
|
|
Kupol |
- |
169,156 |
|
- |
122,295 |
|
|
- |
|
83.8 |
|
|
- |
|
685 |
| Chirano
(100%) |
- |
82,060 |
|
- |
87,823 |
|
|
- |
|
131.2 |
|
|
- |
|
1,494 |
|
|
- |
251,216 |
|
- |
210,118 |
|
|
- |
|
215.0 |
|
|
|
| |
|
|
|
|
|
|
|
|
|
|
|
Consolidated balance sheets
| (expressed in millions of
U.S. dollars, except share amounts) |
|
|
|
|
|
|
|
|
|
|
|
|
|
As at |
|
|
|
December 31, |
|
December 31, |
|
|
|
|
2023 |
|
|
|
2022 |
|
|
|
|
|
|
|
|
Assets |
|
|
|
|
|
Current assets |
|
|
|
|
|
Cash and cash equivalents |
|
$ |
352.4 |
|
|
$ |
418.1 |
|
|
Restricted cash |
|
|
9.8 |
|
|
|
10.1 |
|
|
Accounts receivable and other assets |
|
|
268.7 |
|
|
|
318.2 |
|
|
Current income tax recoverable |
|
|
3.4 |
|
|
|
8.5 |
|
|
Inventories |
|
|
1,153.0 |
|
|
|
1,072.2 |
|
|
Unrealized fair value of derivative assets |
|
|
15.0 |
|
|
|
25.5 |
|
|
|
|
|
1,802.3 |
|
|
|
1,852.6 |
|
|
Non-current assets |
|
|
|
|
|
Property, plant and equipment |
|
|
7,963.2 |
|
|
|
7,741.4 |
|
|
Long-term investments |
|
|
54.7 |
|
|
|
116.9 |
|
|
Other long-term assets |
|
|
710.6 |
|
|
|
680.9 |
|
|
Deferred tax assets |
|
|
12.5 |
|
|
|
4.6 |
|
|
Total assets |
|
$ |
10,543.3 |
|
|
$ |
10,396.4 |
|
|
|
|
|
|
|
|
Liabilities |
|
|
|
|
|
Current liabilities |
|
|
|
|
|
Accounts payable and accrued liabilities |
|
$ |
531.5 |
|
|
$ |
550.0 |
|
|
Current income tax payable |
|
|
92.9 |
|
|
|
89.4 |
|
|
Current portion of long-term debt and credit facilities |
|
|
- |
|
|
|
36.0 |
|
|
Current portion of provisions |
|
|
48.8 |
|
|
|
50.8 |
|
|
Other current liabilities |
|
|
12.3 |
|
|
|
25.3 |
|
|
|
|
|
685.5 |
|
|
|
751.5 |
|
|
Non-current liabilities |
|
|
|
|
|
Long-term debt and credit facilities |
|
|
2,232.6 |
|
|
|
2,556.9 |
|
|
Provisions |
|
|
889.9 |
|
|
|
755.9 |
|
|
Long-term lease liabilities |
|
|
17.5 |
|
|
|
23.1 |
|
|
Other long-term liabilities |
|
|
82.4 |
|
|
|
125.3 |
|
|
Deferred tax liabilities |
|
|
449.7 |
|
|
|
301.5 |
|
|
Total liabilities |
|
$ |
4,357.6 |
|
|
$ |
4,514.2 |
|
|
|
|
|
|
|
|
Equity |
|
|
|
|
|
Common shareholders' equity |
|
|
|
|
|
Common share capital |
|
$ |
4,481.6 |
|
|
$ |
4,449.5 |
|
|
Contributed surplus |
|
|
10,646.0 |
|
|
|
10,667.5 |
|
|
Accumulated deficit |
|
|
(8,982.6 |
) |
|
|
(9,251.6 |
) |
|
Accumulated other comprehensive income (loss) |
|
|
(61.3 |
) |
|
|
(41.7 |
) |
|
Total common shareholders' equity |
|
|
6,083.7 |
|
|
|
5,823.7 |
|
|
Non-controlling interests |
|
|
102.0 |
|
|
|
58.5 |
|
|
Total equity |
|
|
6,185.7 |
|
|
|
5,882.2 |
|
|
Total liabilities and equity |
|
$ |
10,543.3 |
|
|
$ |
10,396.4 |
|
|
|
|
|
|
|
|
Common shares |
|
|
|
|
|
Authorized |
|
|
Unlimited |
|
|
|
Unlimited |
|
|
Issued and outstanding |
|
|
1,227,837,974 |
|
|
|
1,221,891,341 |
|
|
|
|
|
|
|
| |
|
|
|
|
Consolidated statements of operations
| (expressed in millions of
U.S. dollars, except share and per share amounts) |
|
|
|
|
|
|
|
Years ended |
|
|
|
December 31, |
|
December 31, |
|
|
|
|
2023 |
|
|
|
2022 |
|
|
Revenue |
|
|
|
|
|
Metal sales |
|
$ |
4,239.7 |
|
|
$ |
3,455.1 |
|
|
|
|
|
|
|
|
Cost of sales |
|
|
|
|
|
Production cost of sales |
|
|
2,054.4 |
|
|
|
1,805.7 |
|
|
Depreciation, depletion and amortization |
|
|
986.8 |
|
|
|
784.0 |
|
|
Impairment charges |
|
|
38.9 |
|
|
|
350.0 |
|
|
Total cost of sales |
|
|
3,080.1 |
|
|
|
2,939.7 |
|
|
Gross profit |
|
|
1,159.6 |
|
|
|
515.4 |
|
|
Other operating expense |
|
|
64.5 |
|
|
|
113.8 |
|
|
Exploration and business development |
|
|
185.0 |
|
|
|
154.1 |
|
|
General and administrative |
|
|
108.7 |
|
|
|
129.8 |
|
|
Operating earnings |
|
|
801.4 |
|
|
|
117.7 |
|
|
Other (expense) income - net |
|
|
(27.3 |
) |
|
|
64.4 |
|
|
Finance income |
|
|
40.5 |
|
|
|
18.3 |
|
|
Finance expense |
|
|
(106.0 |
) |
|
|
(93.7 |
) |
|
Earnings from continuing operations before
tax |
|
|
708.6 |
|
|
|
106.7 |
|
|
Income tax expense - net |
|
|
(293.2 |
) |
|
|
(76.1 |
) |
| Earnings
from continuing operations after tax |
|
|
415.4 |
|
|
|
30.6 |
|
| Loss from
discontinued operations after tax |
|
|
- |
|
|
|
(636.3 |
) |
|
Net earnings (loss) |
|
$ |
415.4 |
|
|
$ |
(605.7 |
) |
|
Net earnings (loss) from continuing operations attributable
to: |
|
|
|
|
|
Non-controlling interests |
|
$ |
(0.9 |
) |
|
$ |
(1.3 |
) |
|
Common shareholders |
|
$ |
416.3 |
|
|
$ |
31.9 |
|
|
Net earnings (loss) from discontinued operations
attributable to: |
|
|
|
|
|
Non-controlling interests |
|
$ |
- |
|
|
$ |
0.8 |
|
|
Common shareholders |
|
$ |
- |
|
|
$ |
(637.1 |
) |
|
Net earnings (loss) attributable to: |
|
|
|
|
|
Non-controlling interests |
|
$ |
(0.9 |
) |
|
$ |
(0.5 |
) |
|
Common shareholders |
|
$ |
416.3 |
|
|
$ |
(605.2 |
) |
|
Earnings per share from continuing operations attributable
to common shareholders |
|
|
|
|
|
Basic |
|
$ |
0.34 |
|
|
$ |
0.02 |
|
|
Diluted |
|
$ |
0.34 |
|
|
$ |
0.02 |
|
|
Loss per share from discontinued operations attributable to
common shareholders |
|
$ |
- |
|
|
$ |
(0.50 |
) |
|
Basic |
|
$ |
- |
|
|
$ |
(0.50 |
) |
|
Diluted |
|
|
|
|
|
Earnings (loss) per share attributable to common
shareholders |
|
|
|
|
|
Basic |
|
$ |
0.34 |
|
|
$ |
(0.47 |
) |
|
Diluted |
|
$ |
0.34 |
|
|
$ |
(0.47 |
) |
|
|
|
|
|
|
Consolidated statements of cash flows
| (expressed in millions of
U.S. dollars) |
|
|
|
|
|
|
|
|
|
Years ended |
|
|
|
|
December 31, |
|
December 31, |
|
|
|
|
|
2023 |
|
|
|
2022 |
|
|
Net inflow (outflow) of cash related to the following
activities: |
|
|
|
|
|
|
Operating: |
|
|
|
|
|
| Earnings
from continuing operations after tax |
|
|
$ |
415.4 |
|
|
$ |
30.6 |
|
|
Adjustments to reconcile net earnings from continuing operations to
net cash provided from operating activities: |
|
|
|
|
|
|
Depreciation, depletion and amortization |
|
|
|
986.8 |
|
|
|
784.0 |
|
|
Impairment charges |
|
|
|
38.9 |
|
|
|
350.0 |
|
|
Share-based compensation expense |
|
|
|
6.7 |
|
|
|
9.3 |
|
|
Finance expense |
|
|
|
106.0 |
|
|
|
93.7 |
|
|
Deferred tax expense (recovery) |
|
|
|
143.9 |
|
|
|
(56.2 |
) |
|
Foreign exchange (gains) losses and other |
|
|
|
(8.6 |
) |
|
|
21.6 |
|
|
Reclamation (recovery) expense |
|
|
|
(19.2 |
) |
|
|
23.5 |
|
|
Changes in operating assets and liabilities: |
|
|
|
|
|
|
Accounts receivable and other assets |
|
|
|
68.7 |
|
|
|
17.9 |
|
|
Inventories |
|
|
|
(91.4 |
) |
|
|
(261.6 |
) |
|
Accounts payable and accrued liabilities |
|
|
|
95.5 |
|
|
|
130.4 |
|
|
Cash flow provided from operating activities |
|
|
|
1,742.7 |
|
|
|
1,143.2 |
|
|
Income taxes paid |
|
|
|
(137.4 |
) |
|
|
(140.7 |
) |
|
Net cash flow of continuing operations provided from
operating activities |
|
|
|
1,605.3 |
|
|
|
1,002.5 |
|
|
Net cash flow of discontinued operations provided from
operating activities |
|
|
|
- |
|
|
|
47.6 |
|
|
Investing: |
|
|
|
|
|
|
Additions to property, plant and equipment |
|
|
|
(1,098.3 |
) |
|
|
(764.2 |
) |
|
Interest paid capitalized to property, plant and equipment |
|
|
|
(114.1 |
) |
|
|
(43.7 |
) |
|
Acquisitions net of cash acquired |
|
|
|
- |
|
|
|
(1,027.5 |
) |
|
Net disposals (additions) to long-term investments and other
assets |
|
|
|
1.7 |
|
|
|
(67.2 |
) |
|
Decrease (increase) in restricted cash - net |
|
|
|
25.3 |
|
|
|
(4.2 |
) |
|
Interest received and other - net |
|
|
|
18.2 |
|
|
|
8.8 |
|
|
Net cash flow of continuing operations used in investing
activities |
|
|
|
(1,167.2 |
) |
|
|
(1,898.0 |
) |
|
Net cash flow of discontinued operations provided from
investing activities |
|
|
|
45.0 |
|
|
|
296.2 |
|
|
Financing: |
|
|
|
|
|
|
Proceeds from issuance or drawdown of debt |
|
|
|
588.1 |
|
|
|
1,297.6 |
|
|
Repayment of debt |
|
|
|
(960.0 |
) |
|
|
(340.0 |
) |
|
Interest paid |
|
|
|
(53.2 |
) |
|
|
(52.4 |
) |
|
Payment of lease liabilities |
|
|
|
(30.2 |
) |
|
|
(23.2 |
) |
|
Funding from non-controlling interest |
|
|
|
46.2 |
|
|
|
10.8 |
|
|
Dividends paid to common shareholders |
|
|
|
(147.3 |
) |
|
|
(154.0 |
) |
|
Repurchase and cancellation of shares |
|
|
|
- |
|
|
|
(300.8 |
) |
|
Other - net |
|
|
|
7.4 |
|
|
|
(0.5 |
) |
|
Net cash flow of continuing operations (used in) provided
from financing activities |
|
|
|
(549.0 |
) |
|
|
437.5 |
|
|
Net cash flow of discontinued operations provided from
financing activities |
|
|
|
- |
|
|
|
- |
|
|
Effect of exchange rate changes on cash and cash
equivalents of continuing operations |
|
|
|
0.2 |
|
|
|
(0.8 |
) |
|
Effect of exchange rate changes on cash and cash
equivalents of discontinued operations |
|
|
|
- |
|
|
|
1.6 |
|
|
Decrease in cash and cash equivalents |
|
|
|
(65.7 |
) |
|
|
(113.4 |
) |
|
Cash and cash equivalents, beginning of
period |
|
|
|
418.1 |
|
|
|
531.5 |
|
|
Cash and cash equivalents of assets held for sale,
beginning of period |
|
|
|
- |
|
|
|
- |
|
|
Cash and cash equivalents, end of period |
|
|
$ |
352.4 |
|
|
$ |
418.1 |
|
| |
|
|
|
|
|
|
|
Operating
Summary |
|
|
Mine |
Period |
Tonnes Ore Mined |
Ore
Processed (Milled) |
Ore
Processed (Heap Leach) |
Grade (Mill) |
Grade (Heap Leach) |
Recovery (a)(d) |
Gold Eq
Production(b) |
Gold Eq Sales(b) |
Production cost of sales |
Production cost of
sales/oz(c) |
Cap Ex -
sustaining(e) |
Total Cap Ex (e) |
DD&A |
|
|
|
|
('000 tonnes) |
('000 tonnes) |
('000 tonnes) |
(g/t) |
(g/t) |
(%) |
(ounces) |
(ounces) |
($ millions) |
($/ounce) |
($ millions) |
($ millions) |
($ millions) |
West Africa
|
Tasiast
|
Q4 2023 |
2,937 |
2,056 |
- |
3.04 |
- |
93% |
160,764 |
171,199 |
$ |
110.4 |
$ |
645 |
$ |
9.7 |
$ |
85.2 |
$ |
70.6 |
|
Q3 2023 |
3,486 |
1,796 |
- |
3.10 |
- |
92% |
171,140 |
162,823 |
$ |
108.5 |
$ |
666 |
$ |
12.2 |
$ |
77.3 |
$ |
69.0 |
|
Q2 2023 |
1,688 |
1,663 |
- |
3.25 |
- |
93% |
157,844 |
152,564 |
$ |
99.5 |
$ |
652 |
$ |
9.1 |
$ |
81.9 |
$ |
58.6 |
|
Q1 2023 |
1,690 |
1,208 |
- |
3.49 |
- |
91% |
131,045 |
128,479 |
$ |
88.4 |
$ |
688 |
$ |
14.6 |
$ |
64.6 |
$ |
46.2 |
|
Q4 2022 |
3,737 |
1,627 |
- |
3.21 |
- |
90% |
143,002 |
147,019 |
$ |
96.2 |
$ |
654 |
$ |
38.3 |
$ |
90.3 |
$ |
48.7 |
Americas
|
Paracatu
|
Q4 2023 |
16,865 |
15,279 |
- |
0.35 |
- |
79% |
127,940 |
132,886 |
$ |
144.2 |
$ |
1,085 |
$ |
41.6 |
$ |
41.6 |
$ |
43.3 |
|
Q3 2023 |
14,725 |
14,669 |
- |
0.41 |
- |
79% |
172,482 |
167,105 |
$ |
141.2 |
$ |
845 |
$ |
58.4 |
$ |
58.4 |
$ |
53.1 |
|
Q2 2023 |
14,199 |
15,104 |
- |
0.42 |
- |
80% |
164,243 |
163,889 |
$ |
135.2 |
$ |
825 |
$ |
39.7 |
$ |
39.7 |
$ |
49.8 |
|
Q1 2023 |
8,056 |
15,130 |
- |
0.37 |
- |
79% |
123,334 |
128,344 |
$ |
118.0 |
$ |
919 |
$ |
27.8 |
$ |
27.8 |
$ |
40.4 |
|
Q4 2022 |
13,324 |
13,847 |
- |
0.50 |
- |
81% |
180,809 |
183,190 |
$ |
130.3 |
$ |
711 |
$ |
43.9 |
$ |
43.9 |
$ |
52.7 |
La Coipa(f)
|
Q4 2023 |
1,591 |
1,188 |
- |
1.92 |
- |
78% |
73,823 |
73,477 |
$ |
52.9 |
$ |
720 |
$ |
7.0 |
$ |
10.9 |
$ |
54.8 |
|
Q3 2023 |
1,137 |
1,017 |
- |
1.69 |
- |
81% |
65,975 |
65,856 |
$ |
41.4 |
$ |
629 |
$ |
7.5 |
$ |
15.2 |
$ |
48.3 |
|
Q2 2023 |
869 |
971 |
- |
1.62 |
- |
81% |
66,744 |
67,378 |
$ |
43.6 |
$ |
647 |
$ |
19.9 |
$ |
23.3 |
$ |
48.3 |
|
Q1 2023 |
748 |
691 |
- |
1.68 |
- |
88% |
53,596 |
61,780 |
$ |
44.9 |
$ |
727 |
$ |
1.6 |
$ |
25.4 |
$ |
36.4 |
|
Q4 2022 |
1,047 |
933 |
- |
1.47 |
- |
84% |
67,683 |
68,135 |
$ |
39.4 |
$ |
578 |
$ |
2.6 |
$ |
46.0 |
$ |
25.6 |
Fort Knox
|
Q4 2023 |
11,002 |
2,173 |
9,930 |
0.69 |
0.22 |
78% |
84,215 |
81,306 |
$ |
104.3 |
$ |
1,283 |
$ |
50.6 |
$ |
69.0 |
$ |
31.5 |
|
Q3 2023 |
6,667 |
1,912 |
5,961 |
0.81 |
0.21 |
78% |
71,611 |
71,616 |
$ |
82.3 |
$ |
1,149 |
$ |
52.1 |
$ |
57.8 |
$ |
24.6 |
|
Q2 2023 |
7,624 |
2,075 |
6,837 |
0.82 |
0.24 |
82% |
69,438 |
69,206 |
$ |
79.3 |
$ |
1,146 |
$ |
52.1 |
$ |
58.2 |
$ |
22.1 |
|
Q1 2023 |
7,412 |
1,966 |
5,972 |
0.78 |
0.22 |
82% |
65,387 |
65,404 |
$ |
77.6 |
$ |
1,186 |
$ |
38.6 |
$ |
39.1 |
$ |
18.6 |
|
Q4 2022 |
12,205 |
2,395 |
11,454 |
0.69 |
0.20 |
79% |
83,739 |
87,061 |
$ |
102.1 |
$ |
1,173 |
$ |
34.4 |
$ |
39.1 |
$ |
40.9 |
Round Mountain
|
Q4 2023 |
4,666 |
884 |
2,729 |
0.91 |
0.48 |
68% |
55,764 |
56,495 |
$ |
82.6 |
$ |
1,462 |
$ |
4.6 |
$ |
4.8 |
$ |
45.0 |
|
Q3 2023 |
8,474 |
911 |
7,644 |
0.75 |
0.38 |
75% |
63,648 |
61,931 |
$ |
93.1 |
$ |
1,503 |
$ |
7.7 |
$ |
7.8 |
$ |
44.1 |
|
Q2 2023 |
10,496 |
1,021 |
10,028 |
0.67 |
0.35 |
76% |
57,446 |
57,412 |
$ |
85.5 |
$ |
1,489 |
$ |
10.5 |
$ |
10.5 |
$ |
33.5 |
|
Q1 2023 |
5,019 |
878 |
4,367 |
0.81 |
0.44 |
79% |
58,832 |
58,226 |
$ |
96.5 |
$ |
1,657 |
$ |
7.4 |
$ |
7.4 |
$ |
34.6 |
|
Q4 2022 |
5,177 |
962 |
4,772 |
0.74 |
0.36 |
74% |
61,929 |
67,484 |
$ |
95.1 |
$ |
1,409 |
$ |
41.1 |
$ |
41.1 |
$ |
19.1 |
Bald Mountain
|
Q4 2023 |
3,894 |
- |
3,918 |
- |
0.47 |
nm |
44,007 |
49,375 |
$ |
57.1 |
$ |
1,156 |
$ |
36.3 |
$ |
38.8 |
$ |
25.0 |
|
Q3 2023 |
7,412 |
- |
7,412 |
- |
0.39 |
nm |
40,593 |
41,300 |
$ |
53.9 |
$ |
1,305 |
$ |
20.6 |
$ |
24.9 |
$ |
23.3 |
|
Q2 2023 |
4,142 |
- |
4,119 |
- |
0.42 |
nm |
39,321 |
42,181 |
$ |
54.5 |
$ |
1,292 |
$ |
16.5 |
$ |
31.4 |
$ |
25.6 |
|
Q1 2023 |
1,864 |
- |
1,857 |
- |
0.47 |
nm |
33,828 |
47,283 |
$ |
58.0 |
$ |
1,227 |
$ |
6.1 |
$ |
25.2 |
$ |
33.9 |
|
Q4 2022 |
3,002 |
- |
2,957 |
- |
0.37 |
nm |
58,521 |
66,847 |
$ |
62.8 |
$ |
939 |
$ |
17.2 |
$ |
37.4 |
$ |
63.4 |
|
(a) |
Due to the nature of heap leach operations, recovery rates at
Bald Mountain cannot be accurately measured on a quarterly basis.
Recovery rates at Fort Knox and Round Mountain represent mill
recovery only. |
| (b) |
Gold equivalent ounces
include silver ounces produced and sold converted to a gold
equivalent based on the ratio of the average spot market prices for
the commodities for each period. The ratios for the quarters
presented are as follows: Q4 2023: 85:1; Q3 2023: 81.82:1; Q2 2023:
81.88:1; Q1 2023: 83.82:1; Q4 2022: 81.88:1. |
| (c) |
“Production cost of sales per
equivalent ounce sold” is defined as production cost of sales
divided by total gold equivalent ounces sold from continuing
operations. |
| (d) |
"nm" means not
meaningful. |
| (e) |
"Total Cap Ex" is as reported
as “Additions to property, plant and equipment” on the consolidated
statements of cash flows. "Capital expenditures - sustaining" is a
non-GAAP financial measure. The definition and reconciliation of
this non-GAAP financial measure is included on page 30 of this news
release. |
| (f) |
La Coipa silver grade and
recovery were as follows: Q4 2023: 96.24 g/t, 44%; Q3 2023: 106.70
g/t, 63%; Q2 2023: 109.84 g/t, 56%; Q1 2023: 125.77 g/t, 70%; Q4
2022: 137.53 g/t, 68%. |
| |
|
Reconciliation of non-GAAP financial measures and
ratios
The Company has included certain non-GAAP
financial measures and ratios in this document. These financial
measures and ratios are not defined under IFRS and should not be
considered in isolation. The Company believes that these financial
measures and ratios, together with financial measures and ratios
determined in accordance with IFRS, provide investors with an
improved ability to evaluate the underlying performance of the
Company. The inclusion of these financial measures and ratios is
meant to provide additional information and should not be used as a
substitute for performance measures prepared in accordance with
IFRS. These financial measures and ratios are not necessarily
standard and therefore may not be comparable to other issuers.
All the non-GAAP financial measures and ratios
in this document are from continuing operations and exclude results
from the Company’s Chirano and Russian operations due to the
classification of these operations as discontinued and their sale
in 2022. As a result of the exclusion of Chirano, the following
non-GAAP financial measures and ratios are no longer on an
attributable basis, but on a total basis: production cost of sales
from continuing operations per ounce sold on a by-product basis and
all-in-sustaining cost from continuing operations per equivalent
ounce sold and per ounce sold on a by-product basis.
Adjusted Net Earnings from Continuing
Operations Attributable to Common Shareholders and Adjusted Net
Earnings from Continuing Operations per Share
Adjusted net earnings from continuing operations
attributable to common shareholders and adjusted net earnings from
continuing operations per share are non-GAAP financial measures and
ratios which determine the performance of the Company, excluding
certain impacts which the Company believes are not reflective of
the Company’s underlying performance for the reporting period, such
as the impact of foreign exchange gains and losses, reassessment of
prior year taxes and/or taxes otherwise not related to the current
period, impairment charges (reversals), gains and losses and other
one-time costs related to acquisitions, dispositions and other
transactions, and non-hedge derivative gains and losses. Although
some of the items are recurring, the Company believes that they are
not reflective of the underlying operating performance of its
current business and are not necessarily indicative of future
operating results. Management believes that these measures and
ratios, which are used internally to assess performance and in
planning and forecasting future operating results, provide
investors with the ability to better evaluate underlying
performance, particularly since the excluded items are typically
not included in public guidance. However, adjusted net earnings
from continuing operations and adjusted net earnings from
continuing operations per share measures and ratios are not
necessarily indicative of net earnings from continuing operations
and earnings per share measures and ratios as determined under
IFRS.
The following table provides a reconciliation of
net earnings (loss) from continuing operations to adjusted net
earnings from continuing operations for the periods presented:
|
|
|
|
|
|
|
|
|
(expressed in millions of U.S dollars, |
Three months ended |
|
Years ended |
|
except per share amounts) |
December 31, |
|
December 31, |
|
|
|
|
2023 |
|
|
2022 |
|
|
|
2023 |
|
|
2022 |
|
|
|
|
|
|
|
|
|
| Net
earnings (loss) from continuing operations attributable to common
shareholders - as reported |
$ |
65.4 |
|
$ |
(106.0 |
) |
|
$ |
416.3 |
|
$ |
31.9 |
|
| Adjusting
items: |
|
|
|
|
|
|
|
Foreign exchange losses
(gains) |
|
2.7 |
|
|
(0.7 |
) |
|
|
1.9 |
|
|
(0.8 |
) |
|
|
Foreign exchange losses
(gains) on translation of tax basis and foreign exchange on
deferred income taxes within income tax expense |
|
24.1 |
|
|
(17.1 |
) |
|
|
29.3 |
|
|
(25.5 |
) |
|
|
Taxes in respect of prior
periods |
|
(19.9 |
) |
|
0.4 |
|
|
|
13.9 |
|
|
16.2 |
|
|
|
Impairment charges and asset
derecognition(a) |
|
38.9 |
|
|
350.0 |
|
|
|
38.9 |
|
|
350.0 |
|
|
|
Restructuring costs |
|
- |
|
|
- |
|
|
|
- |
|
|
13.0 |
|
|
|
Reclamation (recovery)
expense |
|
(5.1 |
) |
|
19.6 |
|
|
|
(19.2 |
) |
|
23.5 |
|
|
|
VAT expense (recovery) in
respect of prior periods |
|
- |
|
|
(24.2 |
) |
|
|
8.5 |
|
|
(24.2 |
) |
|
|
Tasiast insurance
recoveries |
|
- |
|
|
(77.1 |
) |
|
|
- |
|
|
(77.1 |
) |
|
|
Loss on sale of assets |
|
8.1 |
|
|
12.1 |
|
|
|
14.8 |
|
|
14.3 |
|
|
|
Settlement provisions |
|
20.0 |
|
|
- |
|
|
|
30.0 |
|
|
- |
|
|
|
Other(b) |
|
8.2 |
|
|
16.4 |
|
|
|
9.6 |
|
|
22.6 |
|
|
|
Tax effects of the above
adjustments |
|
(2.4 |
) |
|
(65.2 |
) |
|
|
(4.2 |
) |
|
(60.8 |
) |
|
|
|
|
74.6 |
|
|
214.2 |
|
|
|
123.5 |
|
|
251.2 |
|
| Adjusted
net earnings from continuing operations attributable to common
shareholders |
$ |
140.0 |
|
$ |
108.2 |
|
|
$ |
539.8 |
|
$ |
283.1 |
|
| Weighted
average number of common shares outstanding - Basic |
|
1,227.8 |
|
|
1,258.4 |
|
|
|
1,227.0 |
|
|
1,280.5 |
|
| Adjusted
net earnings from continuing operations per share |
$ |
0.11 |
|
$ |
0.09 |
|
|
$ |
0.44 |
|
$ |
0.22 |
|
| Basic
earnings per share from continuing operations attributable to
common shareholders - as reported |
$ |
0.06 |
|
$ |
(0.08 |
) |
|
$ |
0.34 |
|
$ |
0.02 |
|
|
|
|
|
|
|
|
|
|
(a) |
During the year ended December 31, 2023, the Company recognized
impairment charges of $38.9 million related to a reduction in the
estimate of recoverable ounces on the Fort Knox heap leach pads due
to changes in recovery rates. The tax impact of the impairment was
an income tax recovery of $3.1 million. During the year ended
December 31, 2022, the Company recognized impairment charges of
$350.0 million at Round Mountain, of which $106.8 million related
to impairment of metal inventory and $243.2 million related to
impairment of property, plant and equipment. The income tax
recoveries related to the impairment charges were $18.9 million and
$41.8 million, respectively. During the year ended December 31,
2021, the Company recognized impairment and asset derecognition
charges of $144.5 million at Bald Mountain, of which $95.2 million
related to impairment of metal inventory and $49.3 million related
to the derecognition of property, plant and equipment. The income
tax recoveries related to the impairment charges were $25.3 million
and $13.1 million, respectively. |
|
(b) |
Other includes various impacts, such as one-time costs at
sites, and gains and losses on hedges, which the Company believes
are not reflective of the Company’s underlying performance for the
reporting period. |
|
|
|
Attributable Free Cash Flow from
Continuing Operations
Attributable free cash flow is defined as net
cash flow of continuing operations provided from operating
activities less attributable capital expenditures and
non-controlling interest included in net cash flow from operating
activities. The Company believes that this measure, which is used
internally to evaluate the Company’s underlying cash generation
performance and the ability to repay creditors and return cash to
shareholders, provides investors with the ability to better
evaluate the Company’s underlying performance. However, this
measure is not necessarily indicative of operating earnings or net
cash flow of continuing operations provided from operating
activities, as determined under IFRS.
The following table provides a reconciliation of
attributable free cash flow from continuing operations for the
periods presented:
|
|
|
|
|
|
|
|
|
|
|
Three months ended |
|
Years ended |
(expressed in millions of U.S dollars)
|
|
December 31, |
|
December 31, |
|
|
|
|
2023 |
|
|
2022 |
|
|
|
2023 |
|
|
2022 |
|
|
|
|
|
|
|
|
|
| Net cash
flow of continuing operations provided from operating activities -
as reported |
$ |
410.9 |
|
$ |
474.3 |
|
|
$ |
1,605.3 |
|
$ |
1,002.5 |
|
|
|
|
|
|
|
|
|
| Less:
Attributable capital expenditures |
$ |
(297.7 |
) |
$ |
(312.7 |
) |
|
$ |
(1,055.0 |
) |
$ |
(755.0 |
) |
|
|
|
|
|
|
|
|
| Less
Non-controlling interest cash flow (from) used in operating
activities(j) |
|
3.5 |
|
|
1.0 |
|
|
|
9.4 |
|
|
(0.2 |
) |
|
|
|
|
|
|
|
|
|
Attributable free cash flow from continuing operations |
$ |
116.7 |
|
$ |
162.6 |
|
|
$ |
559.7 |
|
$ |
247.3 |
|
|
|
|
|
|
|
|
|
See page 31 for details of the endnotes
referenced within the table above.
Adjusted operating cash flow from
continuing operations is a non-GAAP financial measure and
is defined as net cash flow of continuing operations provided from
operating activities excluding certain impacts which the Company
believes are not reflective of the Company’s regular operating cash
flow and excluding changes in working capital. Working capital can
be volatile due to numerous factors, including the timing of tax
payments. The Company uses adjusted operating cash flow from
continuing operations internally as a measure of the underlying
operating cash flow performance and future operating cash
flow-generating capability of the Company. However, the adjusted
operating cash flow from continuing operations measure is not
necessarily indicative of net cash flow of continuing operations
provided from operating activities as determined under
IFRS.
The following table provides a reconciliation of
adjusted operating cash flow from continuing operations for the
periods presented:
|
|
|
|
|
|
|
|
|
|
|
Three months ended |
|
Years ended |
|
(expressed in millions of U.S dollars) |
December 31, |
|
December 31, |
|
|
|
|
2023 |
|
|
2022 |
|
|
|
2023 |
|
|
2022 |
|
|
|
|
|
|
|
|
|
| Net cash
flow of continuing operations provided from operating activities -
as reported |
$ |
410.9 |
|
$ |
474.3 |
|
|
$ |
1,605.3 |
|
$ |
1,002.5 |
|
|
|
|
|
|
|
|
|
| Adjusting
items: |
|
|
|
|
|
|
|
Working capital changes: |
|
|
|
|
|
|
|
Accounts receivable and other assets |
|
(2.1 |
) |
|
29.1 |
|
|
|
(68.7 |
) |
|
(17.9 |
) |
|
|
Inventories |
|
(1.8 |
) |
|
39.2 |
|
|
|
91.4 |
|
|
261.6 |
|
|
|
Accounts payable and other liabilities, including income taxes
paid |
|
0.4 |
|
|
(46.5 |
) |
|
|
41.9 |
|
|
10.3 |
|
|
|
Total working capital
changes |
|
(3.5 |
) |
|
21.8 |
|
|
|
64.6 |
|
|
254.0 |
|
| Adjusted
operating cash flow from continuing operations |
$ |
407.4 |
|
$ |
496.1 |
|
|
$ |
1,669.9 |
|
$ |
1,256.5 |
|
|
|
|
|
|
|
|
|
| |
|
|
|
|
|
|
Production cost of sales from continuing
operations per ounce sold on a by-product basis is a
non-GAAP ratio which calculates the Company’s non-gold production
as a credit against its per ounce production costs, rather than
converting its non-gold production into gold equivalent ounces and
crediting it to total production, as is the case in co-product
accounting. Management believes that this ratio provides investors
with the ability to better evaluate Kinross’ production cost of
sales per ounce on a comparable basis with other major gold
producers who routinely calculate their cost of sales per ounce
using by-product accounting rather than co-product
accounting.
The following table provides a reconciliation of
production cost of sales from continuing operations per ounce sold
on a by-product basis for the periods presented:
|
|
|
|
(expressed in millions of U.S. dollars,
|
|
Three months ended |
|
Years ended |
|
except ounces and production cost of sales per equivalent
ounce) |
|
December 31, |
|
December 31, |
|
|
|
|
2023 |
|
|
2022 |
|
|
|
2023 |
|
|
2022 |
|
|
|
|
|
|
|
|
|
|
Production cost of sales from continuing operations - as
reported |
$ |
552.0 |
|
$ |
526.5 |
|
|
$ |
2,054.4 |
|
$ |
1,805.7 |
|
| Less:
silver revenue(a) |
|
(43.7 |
) |
|
(61.9 |
) |
|
|
(204.3 |
) |
|
(98.9 |
) |
|
Production cost of sales from continuing operations net of silver
by-product revenue |
$ |
508.3 |
|
$ |
464.6 |
|
|
$ |
1,850.1 |
|
$ |
1,706.8 |
|
|
|
|
|
|
|
|
|
| Gold
ounces sold from continuing operations |
|
543,173 |
|
|
586,146 |
|
|
|
2,074,989 |
|
|
1,872,342 |
|
| Total
gold equivalent ounces sold from continuing operations |
|
565,389 |
|
|
620,599 |
|
|
|
2,179,936 |
|
|
1,927,818 |
|
|
Production cost of sales from continuing operations per equivalent
ounce sold(b) |
$ |
976 |
|
$ |
848 |
|
|
$ |
942 |
|
$ |
937 |
|
|
Production cost of sales from continuing operations per ounce sold
on a by-product basis |
$ |
936 |
|
$ |
793 |
|
|
$ |
892 |
|
$ |
912 |
|
|
|
|
|
|
|
|
|
See page 31 for details of the footnotes
referenced within the table above.
All-in sustaining cost and attributable
all-in cost from continuing operations per ounce sold on a
by-product basis are non-GAAP financial measures and
ratios, as applicable, calculated based on guidance published by
the World Gold Council (“WGC”). The WGC is a market development
organization for the gold industry and is an association whose
membership comprises leading gold mining companies including
Kinross. Although the WGC is not a mining industry regulatory
organization, it worked closely with its member companies to
develop these metrics. Adoption of the all-in sustaining cost and
all-in cost metrics is voluntary and not necessarily standard, and
therefore, these measures and ratios presented by the Company may
not be comparable to similar measures and ratios presented by other
issuers. The Company believes that the all-in sustaining cost and
all-in cost measures complement existing measures and ratios
reported by Kinross.
All-in sustaining cost includes both operating
and capital costs required to sustain gold production on an ongoing
basis. The value of silver sold is deducted from the total
production cost of sales as it is considered residual production,
i.e. a by-product. Sustaining operating costs represent
expenditures incurred at current operations that are considered
necessary to maintain current production. Sustaining capital
represents capital expenditures at existing operations comprising
mine development costs, including capitalized stripping, and
ongoing replacement of mine equipment and other capital facilities,
and does not include capital expenditures for major growth projects
or enhancement capital for significant infrastructure improvements
at existing operations.
All-in cost is comprised of all-in sustaining
cost as well as operating expenditures incurred at locations with
no current operation, or costs related to other non-sustaining
activities, and capital expenditures for major growth projects or
enhancement capital for significant infrastructure improvements at
existing operations.
All-in sustaining cost and attributable
all-in cost from continuing operations per ounce sold on a
by-product basis are calculated by adjusting production
cost of sales from continuing operations, as reported on the
consolidated statements of operations, as follows:
|
|
|
|
|
|
|
|
|
(expressed in millions of U.S. dollars, |
Three months ended |
|
Years ended |
|
except ounces and costs per ounce) |
December 31, |
|
December 31, |
|
|
|
|
2023 |
|
|
2022 |
|
|
|
2023 |
|
|
2022 |
|
|
|
|
|
|
|
|
|
|
Production cost of sales from continuing operations - as
reported |
$ |
552.0 |
|
$ |
526.5 |
|
|
$ |
2,054.4 |
|
$ |
1,805.7 |
|
| Less:
silver revenue from continuing operations(a) |
|
(43.7 |
) |
|
(61.9 |
) |
|
|
(204.3 |
) |
|
(98.9 |
) |
|
Production cost of sales from continuing operations net of silver
by-product revenue |
$ |
508.3 |
|
$ |
464.6 |
|
|
$ |
1,850.1 |
|
$ |
1,706.8 |
|
| Adjusting
items: |
|
|
|
|
|
|
|
General and
administrative(d) |
|
26.5 |
|
|
29.3 |
|
|
|
106.9 |
|
|
116.8 |
|
|
|
Other operating expense -
sustaining(e) |
|
5.2 |
|
|
5.0 |
|
|
|
23.0 |
|
|
28.5 |
|
|
|
Reclamation and remediation -
sustaining(f) |
|
16.4 |
|
|
14.2 |
|
|
|
63.1 |
|
|
42.7 |
|
|
|
Exploration and business
development - sustaining(g) |
|
10.4 |
|
|
7.7 |
|
|
|
38.3 |
|
|
30.6 |
|
|
|
Additions to property, plant
and equipment - sustaining(h) |
|
150.1 |
|
|
178.0 |
|
|
|
554.3 |
|
|
402.6 |
|
|
|
Lease payments -
sustaining(i) |
|
4.6 |
|
|
6.1 |
|
|
|
29.5 |
|
|
22.4 |
|
| All-in
Sustaining Cost on a by-product basis |
$ |
721.5 |
|
$ |
704.9 |
|
|
$ |
2,665.2 |
|
$ |
2,350.4 |
|
| Adjusting
items on an attributable(c) basis: |
|
|
|
|
|
|
|
Other operating expense -
non-sustaining(e) |
|
11.1 |
|
|
12.8 |
|
|
|
38.5 |
|
|
45.1 |
|
|
|
Reclamation and remediation -
non-sustaining(f) |
|
2.2 |
|
|
1.9 |
|
|
|
7.7 |
|
|
8.0 |
|
|
|
Exploration and business
development - non-sustaining(g) |
|
40.1 |
|
|
40.1 |
|
|
|
145.9 |
|
|
122.3 |
|
|
|
Additions to property, plant
and equipment - non-sustaining(h) |
|
147.6 |
|
|
134.4 |
|
|
|
500.7 |
|
|
352.4 |
|
|
|
Lease payments -
non-sustaining(i) |
|
0.1 |
|
|
- |
|
|
|
0.7 |
|
|
0.8 |
|
| All-in
Cost on a by-product basis - attributable(c) |
$ |
922.6 |
|
$ |
894.1 |
|
|
$ |
3,358.7 |
|
$ |
2,879.0 |
|
| Gold
ounces sold from continuing operations |
|
543,173 |
|
|
586,146 |
|
|
|
2,074,989 |
|
|
1,872,342 |
|
|
Production cost of sales from continuing operations per equivalent
ounce sold(b) |
$ |
976 |
|
$ |
848 |
|
|
$ |
942 |
|
$ |
937 |
|
| All-in
sustaining cost from continuing operations per ounce sold on a
by-product basis |
$ |
1,328 |
|
$ |
1,203 |
|
|
$ |
1,284 |
|
$ |
1,255 |
|
|
Attributable(c) all-in cost from continuing operations
per ounce sold on a by-product basis |
$ |
1,699 |
|
$ |
1,525 |
|
|
$ |
1,619 |
|
$ |
1,538 |
|
|
|
|
|
|
|
|
|
See page 31 for details of the endnotes
referenced within the table above.
The Company also assesses its all-in sustaining
cost and attributable all-in cost from continuing operations on a
gold equivalent ounce basis. Under these non-GAAP financial
measures and ratios, the Company’s production of silver is
converted into gold equivalent ounces and credited to total
production.
All-in sustaining cost and attributable
all-in cost from continuing operations per equivalent ounce
sold are calculated by adjusting production cost of sales
from continuing operations, as reported on the consolidated
statements of operations, as follows:
|
|
|
|
|
|
|
|
|
(expressed in millions of U.S. dollars, |
Three months ended |
|
Years ended |
|
except ounces and costs per ounce) |
December 31, |
|
December 31, |
|
|
|
|
2023 |
|
|
2022 |
|
|
|
2023 |
|
|
2022 |
|
|
|
|
|
|
|
|
|
|
Production cost of sales from continuing operations - as
reported |
$ |
552.0 |
|
$ |
526.5 |
|
|
$ |
2,054.4 |
|
$ |
1,805.7 |
|
| Adjusting
items: |
|
|
|
|
|
|
|
General and
administrative(d) |
|
26.5 |
|
|
29.3 |
|
|
|
106.9 |
|
|
116.8 |
|
|
|
Other operating expense -
sustaining(e) |
|
5.2 |
|
|
5.0 |
|
|
|
23.0 |
|
|
28.5 |
|
|
|
Reclamation and remediation -
sustaining(f) |
|
16.4 |
|
|
14.2 |
|
|
|
63.1 |
|
|
42.7 |
|
|
|
Exploration and business
development - sustaining(g) |
|
10.4 |
|
|
7.7 |
|
|
|
38.3 |
|
|
30.6 |
|
|
|
Additions to property, plant
and equipment - sustaining(h) |
|
150.1 |
|
|
178.0 |
|
|
|
554.3 |
|
|
402.6 |
|
|
|
Lease payments -
sustaining(i) |
|
4.6 |
|
|
6.1 |
|
|
|
29.5 |
|
|
22.4 |
|
| All-in
Sustaining Cost |
$ |
765.2 |
|
$ |
766.8 |
|
|
$ |
2,869.5 |
|
$ |
2,449.3 |
|
| Adjusting
items on an attributable(c) basis: |
|
|
|
|
|
|
|
Other operating expense -
non-sustaining(e) |
|
11.1 |
|
|
12.8 |
|
|
|
38.5 |
|
|
45.1 |
|
|
|
Reclamation and remediation -
non-sustaining(f) |
|
2.2 |
|
|
1.9 |
|
|
|
7.7 |
|
|
8.0 |
|
|
|
Exploration and business
development - non-sustaining(g) |
|
40.1 |
|
|
40.1 |
|
|
|
145.9 |
|
|
122.3 |
|
|
|
Additions to property, plant
and equipment - non-sustaining(h) |
|
147.6 |
|
|
134.4 |
|
|
|
500.7 |
|
|
352.4 |
|
|
|
Lease payments -
non-sustaining(i) |
|
0.1 |
|
|
- |
|
|
|
0.7 |
|
|
0.8 |
|
| All-in
Cost - attributable(c) |
$ |
966.3 |
|
$ |
956.0 |
|
|
$ |
3,563.0 |
|
$ |
2,977.9 |
|
| Gold
equivalent ounces sold from continuing operations |
|
565,389 |
|
|
620,599 |
|
|
|
2,179,936 |
|
|
1,927,818 |
|
|
Production cost of sales from continuing operations per equivalent
ounce sold(b) |
$ |
976 |
|
$ |
848 |
|
|
$ |
942 |
|
$ |
937 |
|
| All-in
sustaining cost from continuing operations per equivalent ounce
sold |
$ |
1,353 |
|
$ |
1,236 |
|
|
$ |
1,316 |
|
$ |
1,271 |
|
|
Attributable(c) all-in cost from continuing operations
per equivalent ounce sold |
$ |
1,709 |
|
$ |
1,540 |
|
|
$ |
1,634 |
|
$ |
1,545 |
|
|
|
|
|
|
|
|
|
See page 31 for details of the
endnotes referenced within the table above.
Capital Expenditures and Attributable
Capital Expenditures From Continuing Operations
Capital expenditures are classified as either
sustaining capital expenditures or non-sustaining capital
expenditures, depending on the nature of the expenditure.
Sustaining capital expenditures typically represent capital
expenditures at existing operations including capitalized
exploration costs and capitalized stripping unless related to major
projects, ongoing replacement of mine equipment and other capital
facilities and other capital expenditures and is calculated as
total additions to property, plant and equipment (as reported on
the consolidated statements of cash flows), less non-sustaining
capital expenditures. Non-sustaining capital expenditures represent
capital expenditures for major projects, including major capital
stripping projects at existing operations that are expected to
materially benefit the operation, as well as enhancement capital
for significant infrastructure improvements at existing operations.
Management believes the distinction between sustaining capital
expenditures and non-sustaining capital expenditures is a useful
indicator for the purpose of capital expenditures and this
distinction is an input into the calculation of all-in sustaining
costs from continuing operations per ounce and attributable all-in
costs from continuing operations per ounce. The categorization of
sustaining capital expenditures and non-sustaining capital
expenditures is consistent with the definitions under the WGC
all-in cost standard. Sustaining capital expenditures and
non-sustaining capital expenditures are not defined under IFRS,
however, the sum of these two measures total to additions to
property, plant and equipment as disclosed under IFRS on the
consolidated statements of cash flows. Additions to property, plant
and equipment per the statement of cash flow includes 100% of
capital expenditures for Manh Choh. Attributable capital
expenditures includes Kinross' 70% share of capital expenditures
for Manh Choh. Management believes this to be a useful indicator of
Kinross’ cash resources utilized for capital expenditures.
The following table provides a reconciliation of
the classification of capital expenditures for the periods
presented:
(expressed in millions of U.S dollars)
|
|
|
|
|
|
|
|
|
|
Three months ended December 31, 2023: |
Tasiast (Mauritania) |
Paracatu (Brazil) |
La Coipa (Chile) |
Fort Knox (USA) |
Round Mountain (USA) |
Bald Mountain (USA) |
Manh Choh (USA) |
Total USA |
|
Other |
Total |
|
Sustaining capital expenditures |
$ |
9.7 |
$ |
41.6 |
$ |
7.0 |
$ |
50.6 |
$ |
4.6 |
$ |
36.3 |
$ |
- |
|
$ |
91.5 |
|
|
$ |
0.3 |
$ |
150.1 |
|
|
Non-sustaining capital expenditures |
|
75.5 |
|
- |
|
3.9 |
|
18.4 |
|
0.2 |
|
2.5 |
|
45.1 |
|
|
66.2 |
|
|
|
15.6 |
|
161.2 |
|
|
Additions to property, plant and equipment - per cash flow |
$ |
85.2 |
$ |
41.6 |
$ |
10.9 |
$ |
69.0 |
$ |
4.8 |
$ |
38.8 |
$ |
45.1 |
|
$ |
157.7 |
|
|
$ |
15.9 |
$ |
311.3 |
|
|
Less: Non-controlling interest(j) |
|
- |
|
- |
|
- |
|
- |
|
- |
|
- |
|
(13.6 |
) |
|
(13.6 |
) |
|
|
- |
|
(13.6 |
) |
|
Attributable capital expenditures(c) |
$ |
85.2 |
$ |
41.6 |
$ |
10.9 |
$ |
69.0 |
$ |
4.8 |
$ |
38.8 |
$ |
31.5 |
|
$ |
144.1 |
|
|
$ |
15.9 |
$ |
297.7 |
|
|
|
|
|
|
|
|
|
|
|
|
|
|
|
Three months ended December 31, 2022: |
|
|
|
|
|
|
|
|
|
|
|
|
Sustaining capital expenditures |
$ |
38.3 |
$ |
43.9 |
$ |
2.6 |
$ |
34.4 |
$ |
41.1 |
$ |
17.2 |
$ |
- |
|
$ |
92.7 |
|
|
$ |
0.8 |
$ |
178.3 |
|
|
Non-sustaining capital expenditures |
|
52.0 |
|
- |
|
43.4 |
|
4.7 |
|
- |
|
20.2 |
|
17.1 |
|
|
42.0 |
|
|
|
1.1 |
|
138.5 |
|
|
Additions to property, plant and equipment - per cash flow |
$ |
90.3 |
$ |
43.9 |
$ |
46.0 |
$ |
39.1 |
$ |
41.1 |
$ |
37.4 |
$ |
17.1 |
|
$ |
134.7 |
|
|
$ |
1.9 |
$ |
316.8 |
|
|
Less: Non-controlling interest(j) |
|
- |
|
- |
|
- |
|
- |
|
- |
|
- |
|
(4.1 |
) |
|
(4.1 |
) |
|
|
- |
|
(4.1 |
) |
|
Attributable capital expenditures(c) |
$ |
90.3 |
$ |
43.9 |
$ |
46.0 |
$ |
39.1 |
$ |
41.1 |
$ |
37.4 |
$ |
13.0 |
|
$ |
130.6 |
|
|
$ |
1.9 |
$ |
312.7 |
|
|
|
|
|
|
|
|
|
|
|
|
|
|
(expressed in millions of U.S dollars)
|
|
|
|
|
|
|
|
|
|
Year ended December 31, 2023: |
Tasiast (Mauritania) |
Paracatu (Brazil) |
La Coipa (Chile) |
Fort Knox (USA) |
Round Mountain (USA) |
Bald Mountain (USA) |
Manh Choh (USA) |
Total USA |
|
Other |
Total |
|
Sustaining capital expenditures |
$ |
45.6 |
$ |
167.5 |
$ |
36.0 |
$ |
193.4 |
$ |
30.2 |
$ |
79.5 |
$ |
- |
|
$ |
303.1 |
|
|
$ |
2.1 |
$ |
554.3 |
|
|
Non-sustaining capital expenditures |
|
263.4 |
|
- |
|
38.8 |
|
30.7 |
|
0.3 |
|
40.8 |
|
144.3 |
|
|
216.1 |
|
|
|
25.7 |
|
544.0 |
|
|
Additions to property, plant and equipment - per cash flow |
$ |
309.0 |
$ |
167.5 |
$ |
74.8 |
$ |
224.1 |
$ |
30.5 |
$ |
120.3 |
$ |
144.3 |
|
$ |
519.2 |
|
|
$ |
27.8 |
$ |
1,098.3 |
|
|
Less: Non-controlling interest(j) |
|
- |
|
- |
|
- |
|
- |
|
- |
|
- |
|
(43.3 |
) |
|
(43.3 |
) |
|
|
- |
|
(43.3 |
) |
|
Attributable capital expenditures(c) |
$ |
309.0 |
$ |
167.5 |
$ |
74.8 |
$ |
224.1 |
$ |
30.5 |
$ |
120.3 |
$ |
101.0 |
|
$ |
475.9 |
|
|
$ |
27.8 |
$ |
1,055.0 |
|
|
|
|
|
|
|
|
|
|
|
|
|
|
|
Year ended December 31, 2022: |
|
|
|
|
|
|
|
|
|
|
|
|
Sustaining capital expenditures |
$ |
52.7 |
$ |
124.7 |
$ |
7.8 |
$ |
78.7 |
$ |
102.2 |
$ |
35.3 |
$ |
- |
|
$ |
216.2 |
|
|
$ |
1.2 |
$ |
402.6 |
|
|
Non-sustaining capital expenditures |
|
114.7 |
|
- |
|
147.7 |
|
7.4 |
|
0.2 |
|
52.3 |
|
33.2 |
|
|
93.1 |
|
|
|
6.1 |
|
361.6 |
|
|
Additions to property, plant and equipment - per cash flow |
$ |
167.4 |
$ |
124.7 |
$ |
155.5 |
$ |
86.1 |
$ |
102.4 |
$ |
87.6 |
$ |
33.2 |
|
$ |
309.3 |
|
|
$ |
7.3 |
$ |
764.2 |
|
|
Less: Non-controlling interest(j) |
|
- |
|
- |
|
- |
|
- |
|
- |
|
- |
|
(9.2 |
) |
|
(9.2 |
) |
|
|
- |
|
(9.2 |
) |
|
Attributable capital expenditures(c) |
$ |
167.4 |
$ |
124.7 |
$ |
155.5 |
$ |
86.1 |
$ |
102.4 |
$ |
87.6 |
$ |
24.0 |
|
$ |
300.1 |
|
|
$ |
7.3 |
$ |
755.0 |
|
See page 31 for details of the endnotes referenced within
the table above.
Endnotes
|
(a) |
“Silver revenue” represents the portion of metal sales realized
from the production of the secondary or by-product metal (i.e.
silver). Revenue from the sale of silver, which is produced as a
by-product of the process used to produce gold, effectively reduces
the cost of gold production |
|
(b) |
“Production cost of sales from continuing operations per
equivalent ounce sold” is defined as production cost of sales from
continuing operations divided by total gold equivalent ounces sold
from continuing operations. |
|
(c) |
“Attributable” includes Kinross’ share of Manh Choh (70%) free
cash flow, costs and capital expenditures. As Manh Choh is a
non-operating site, the attributable costs and capital expenditures
are non-sustaining and as such only impact the all-in-cost
measures. |
|
(d) |
“General and administrative” expenses is as reported on the
consolidated statements of operations, net of certain restructuring
expenses. General and administrative expenses are considered
sustaining costs as they are required to be absorbed on a
continuing basis for the effective operation and governance of the
Company. |
|
(e) |
“Other operating expense – sustaining” is calculated as “Other
operating expense” as reported on the consolidated statements of
operations, less other operating and reclamation and remediation
expenses related to non-sustaining activities as well as other
items not reflective of the underlying operating performance of our
business. Other operating expenses are classified as either
sustaining or non-sustaining based on the type and location of the
expenditure incurred. The majority of other operating expenses that
are incurred at existing operations are considered costs necessary
to sustain operations, and are therefore classified as sustaining.
Other operating expenses incurred at locations where there is no
current operation or related to other non-sustaining activities are
classified as non-sustaining. |
|
(f) |
“Reclamation and remediation - sustaining” is calculated as
current period accretion related to reclamation and remediation
obligations plus current period amortization of the corresponding
reclamation and remediation assets, and is intended to reflect the
periodic cost of reclamation and remediation for currently
operating mines. Reclamation and remediation costs for development
projects or closed mines are excluded from this amount and
classified as non-sustaining. |
|
(g) |
“Exploration and business development – sustaining” is
calculated as “Exploration and business development” expenses as
reported on the consolidated statements of operations, less
non-sustaining exploration and business development expenses.
Exploration expenses are classified as either sustaining or
non-sustaining based on a determination of the type and location of
the exploration expenditure. Exploration expenditures within the
footprint of operating mines are considered costs required to
sustain current operations and so are included in sustaining costs.
Exploration expenditures focused on new ore bodies near existing
mines (i.e. brownfield), new exploration projects (i.e. greenfield)
or for other generative exploration activity not linked to existing
mining operations are classified as non-sustaining. Business
development expenses are classified as either sustaining or
non-sustaining based on a determination of the type of expense and
requirement for general or growth related operations. |
|
(h) |
“Additions to property, plant and equipment – sustaining
and non-sustaining are as presented on page 30. Non-sustaining
capital expenditures included in the calculation of attributable
all-in-cost includes Kinross’ share of Manh Choh (70%)
costs. |
|
(i) |
“Lease payments – sustaining” represents the majority of lease
payments as reported on the consolidated statements of cash flows
and is made up of the principal and financing components of such
cash payments, less non-sustaining lease payments. Lease payments
for development projects or closed mines are classified as
non-sustaining. |
| (j) |
Non-controlling interest” represents the non-controlling
interest portion in Manh Choh (30%) and other subsidiaries for
which the Company’s interest is less than 100% for cash flow from
operating activities and capital expenditures. |
| |
|
2023 Annual Mineral Reserve and Resource
Statement
Proven and Probable Mineral Reserves
|
MINERAL RESERVE AND MINERAL RESOURCE
STATEMENT |
|
GOLD |
|
PROVEN AND PROBABLE MINERAL RESERVES
(1,3,4,5,6,7) |
|
|
|
Kinross Gold Corporation's Share at December 31,
2023 |
|
|
|
|
|
|
Kinross |
Proven |
Probable |
Proven and Probable |
|
|
|
Location |
Interest |
Tonnes |
Grade |
Ounces |
Tonnes |
Grade |
Ounces |
Tonnes |
Grade |
Ounces |
|
|
|
|
(%) |
(kt) |
(g/t) |
(koz) |
(kt) |
(g/t) |
(koz) |
(kt) |
(g/t) |
(koz) |
|
NORTH AMERICA |
|
|
|
|
|
|
|
|
|
Bald Mountain |
|
USA |
100% |
638 |
0.5 |
9 |
27,628 |
0.5 |
480 |
28,265 |
0.5 |
489 |
|
Fort Knox |
|
USA |
100% |
17,029 |
0.4 |
229 |
119,594 |
0.4 |
1,357 |
136,623 |
0.4 |
1,586 |
|
Manh Choh |
|
USA |
70% |
4 |
2.7 |
0 |
2,881 |
7.7 |
709 |
2,885 |
7.6 |
709 |
|
Round Mountain |
8 |
USA |
100% |
5,485 |
0.4 |
70 |
72,448 |
0.8 |
1,908 |
77,933 |
0.8 |
1,979 |
|
SUBTOTAL |
23,156 |
0.4 |
309 |
222,551 |
0.6 |
4,454 |
245,706 |
0.6 |
4,763 |
|
SOUTH AMERICA |
|
|
|
|
|
|
|
|
|
La Coipa |
9 |
Chile |
100% |
1,286 |
1.6 |
65 |
11,918 |
1.8 |
695 |
13,205 |
1.8 |
760 |
|
Lobo Marte |
2 |
Chile |
100% |
0 |
0.0 |
0 |
160,702 |
1.3 |
6,733 |
160,702 |
1.3 |
6,733 |
|
Paracatu |
|
Brazil |
100% |
293,503 |
0.5 |
4,337 |
122,147 |
0.3 |
1,110 |
415,650 |
0.4 |
5,446 |
|
SUBTOTAL |
294,790 |
0.5 |
4,402 |
294,767 |
0.9 |
8,538 |
589,557 |
0.7 |
12,940 |
|
AFRICA |
|
|
|
|
|
|
|
|
|
Tasiast |
|
Mauritania |
100% |
56,719 |
1.1 |
2,072 |
45,827 |
2.0 |
2,982 |
102,546 |
1.5 |
5,055 |
|
SUBTOTAL |
56,719 |
1.1 |
2,072 |
45,827 |
2.0 |
2,982 |
102,546 |
1.5 |
5,055 |
|
|
|
|
|
|
|
|
|
|
|
|
|
|
|
TOTAL
GOLD |
374,664 |
0.6 |
6,783 |
563,145 |
0.9 |
15,974 |
937,809 |
0.8 |
22,757 |
|
|
|
|
|
|
|
|
|
|
|
|
|
|
|
MINERAL RESERVE AND MINERAL RESOURCE
STATEMENT |
|
SILVER |
|
PROVEN AND PROBABLE MINERAL RESERVES
(1,3,4,5,6,7) |
|
|
|
Kinross Gold Corporation's Share at December 31,
2023 |
|
|
|
|
|
Location |
Kinross |
Proven |
Probable |
Proven and Probable |
|
|
|
|
Interest |
Tonnes |
Grade |
Ounces |
Tonnes |
Grade |
Ounces |
Tonnes |
Grade |
Ounces |
|
|
|
|
(%) |
(kt) |
(g/t) |
(koz) |
(kt) |
(g/t) |
(koz) |
(kt) |
(g/t) |
(koz) |
|
NORTH AMERICA |
|
|
|
|
|
|
|
|
|
Manh Choh |
|
USA |
70% |
4 |
4.4 |
1 |
2,881 |
13.5 |
1,249 |
2,885 |
13.5 |
1,249 |
|
SUBTOTAL |
4 |
4.4 |
1 |
2,881 |
13.5 |
1,249 |
2,885 |
13.5 |
1,249 |
|
SOUTH AMERICA |
|
|
|
|
|
|
|
|
|
La Coipa |
9 |
Chile |
100% |
1,286 |
74.4 |
3,077 |
11,918 |
50.4 |
19,327 |
13,205 |
52.8 |
22,404 |
|
SUBTOTAL |
1,286 |
74.4 |
3,077 |
11,918 |
50.4 |
19,327 |
13,205 |
52.8 |
22,404 |
|
|
|
|
|
|
|
|
|
|
|
|
|
|
|
TOTAL
SILVER |
1,290 |
74.2 |
3,077 |
14,799 |
43.2 |
20,576 |
16,090 |
45.7 |
23,653 |
See page 35 of this news release for details of the
footnotes referenced within the table above.
Measured and Indicated Mineral Resources
|
MINERAL RESERVE AND MINERAL RESOURCE
STATEMENT |
|
GOLD |
|
MEASURED AND INDICATED MINERAL RESOURCES
(3,4,5,6,7,10,11,13) |
|
|
|
Kinross Gold Corporation's Share at December 31,
2023 |
|
|
|
|
|
|
Kinross |
Measured |
|
|
Indicated |
Measured and Indicated |
|
|
|
Location |
Interest |
Tonnes |
Grade |
Ounces |
Tonnes |
Grade |
Ounces |
Tonnes |
Grade |
Ounces |
|
|
|
|
(%) |
(kt) |
(g/t) |
(koz) |
(kt) |
(g/t) |
(koz) |
(kt) |
(g/t) |
(koz) |
|
NORTH AMERICA |
|
|
|
|
|
|
|
|
|
Bald Mountain |
|
USA |
100% |
7,743 |
0.7 |
180 |
232,973 |
0.5 |
3,506 |
240,716 |
0.5 |
3,686 |
|
Fort Knox |
|
USA |
100% |
4,137 |
0.4 |
50 |
66,131 |
0.3 |
697 |
70,269 |
0.3 |
747 |
|
Great Bear |
|
CAN |
100% |
1,839 |
2.6 |
152 |
31,029 |
2.7 |
2,661 |
32,867 |
2.7 |
2,813 |
|
Curlew Basin |
|
USA |
100% |
0 |
0.0 |
0 |
1,985 |
6.4 |
408 |
1,985 |
6.4 |
408 |
|
Manh Choh |
|
USA |
70% |
0 |
0.0 |
0 |
436 |
2.3 |
32 |
436 |
2.3 |
32 |
|
Round Mountain |
8 |
USA |
100% |
0 |
0.0 |
0 |
120,545 |
0.9 |
3,361 |
120,545 |
0.9 |
3,361 |
|
SUBTOTAL |
13,719 |
0.9 |
382 |
453,099 |
0.7 |
10,665 |
466,818 |
0.7 |
11,047 |
|
SOUTH AMERICA |
|
|
|
|
|
|
|
|
|
La Coipa |
9 |
Chile |
100% |
6,006 |
1.8 |
347 |
19,824 |
1.6 |
1,028 |
25,830 |
1.7 |
1,375 |
|
Lobo Marte |
12 |
Chile |
100% |
0 |
0.0 |
0 |
99,440 |
0.7 |
2,366 |
99,440 |
0.7 |
2,366 |
|
Maricunga |
|
Chile |
100% |
64,728 |
0.7 |
1,521 |
221,602 |
0.7 |
4,688 |
286,329 |
0.7 |
6,209 |
|
Paracatu |
|
Brazil |
100% |
81,953 |
0.5 |
1,253 |
212,573 |
0.3 |
1,788 |
294,526 |
0.3 |
3,041 |
|
SUBTOTAL |
152,686 |
0.6 |
3,121 |
553,439 |
0.6 |
9,870 |
706,125 |
0.6 |
12,991 |
|
AFRICA |
|
|
|
|
|
|
|
|
|
Tasiast |
|
Mauritania |
100% |
9,615 |
0.9 |
284 |
48,936 |
1.0 |
1,646 |
58,551 |
1.0 |
1,930 |
|
SUBTOTAL |
9,615 |
0.9 |
284 |
48,936 |
1.0 |
1,646 |
58,551 |
1.0 |
1,930 |
|
|
|
|
|
|
|
|
|
|
|
|
|
|
|
TOTAL GOLD |
176,020 |
0.7 |
3,787 |
1,055,474 |
0.7 |
22,181 |
1,231,494 |
0.7 |
25,968 |
|
|
|
|
|
|
|
|
|
|
|
|
|
|
|
MINERAL RESERVE AND MINERAL RESOURCE
STATEMENT |
SILVER |
|
MEASURED AND INDICATED MINERAL RESOURCES
(3,4,5,6,7,10,11,13) |
|
|
Kinross Gold Corporation's Share at December 31,
2023 |
|
|
|
|
Location |
Kinross |
Measured |
|
|
Indicated |
Measured and Indicated |
|
|
|
|
Interest |
Tonnes |
Grade |
Ounces |
Tonnes |
Grade |
Ounces |
Tonnes |
Grade |
Ounces |
|
|
|
|
(%) |
(kt) |
(g/t) |
(koz) |
(kt) |
(g/t) |
(koz) |
(kt) |
(g/t) |
(koz) |
|
NORTH AMERICA |
|
|
|
|
|
|
|
|
|
Manh Choh |
|
USA |
70% |
0 |
0.0 |
0 |
436 |
9.1 |
128 |
436 |
9.1 |
128 |
|
Round Mountain |
8 |
USA |
100% |
0 |
0.0 |
0 |
4,085 |
8.4 |
1,106 |
4,085 |
8.4 |
1,106 |
|
SUBTOTAL |
0 |
0.0 |
0 |
4,520 |
8.5 |
1,234 |
4,520 |
8.5 |
1,234 |
|
SOUTH AMERICA |
|
|
|
|
|
|
|
|
|
La Coipa |
9 |
Chile |
100% |
6,006 |
29.5 |
5,697 |
19,824 |
42.4 |
27,042 |
25,830 |
39.4 |
32,739 |
|
SUBTOTAL |
6,006 |
29.5 |
5,697 |
19,824 |
42.4 |
27,042 |
25,830 |
39.4 |
32,739 |
|
|
|
|
|
|
|
|
|
|
|
|
|
|
|
TOTAL SILVER |
6,006 |
29.5 |
5,697 |
24,344 |
36.1 |
28,276 |
30,350 |
34.8 |
33,972 |
See page 35 of this news release for details of the
footnotes referenced within the table above.
Inferred Mineral Resources
|
MINERAL RESERVE AND MINERAL RESOURCE
STATEMENT |
|
GOLD |
|
INFERRED MINERAL RESOURCES
(3,4,5,6,7,10,11,13) |
|
|
|
Kinross Gold Corporation's Share at December 31,
2023 |
|
|
|
|
|
|
Kinross |
Inferred |
|
|
|
Location |
Interest |
Tonnes |
Grade |
Ounces |
|
|
|
|
(%) |
(kt) |
(g/t) |
(koz) |
|
NORTH AMERICA |
|
|
|
|
|
|
Bald Mountain |
|
USA |
100% |
49,041 |
0.3 |
489 |
|
Fort Knox |
|
USA |
100% |
19,265 |
0.3 |
193 |
|
Great Bear |
|
CAN |
100% |
22,691 |
4.5 |
3,315 |
|
Curlew Basin |
|
USA |
100% |
3,728 |
6.0 |
715 |
|
Manh Choh |
|
USA |
70% |
10 |
4.1 |
1 |
|
Round Mountain |
8 |
USA |
100% |
95,361 |
0.5 |
1,542 |
|
SUBTOTAL |
|
|
190,095 |
1.0 |
6,255 |
|
SOUTH AMERICA |
|
|
|
|
|
|
La Coipa |
9 |
Chile |
100% |
2,933 |
1.2 |
116 |
|
Lobo Marte |
12 |
Chile |
100% |
18,474 |
0.7 |
445 |
|
Maricunga |
|
Chile |
100% |
174,847 |
0.6 |
3,097 |
|
Paracatu |
|
Brazil |
100% |
7,348 |
0.3 |
67 |
|
SUBTOTAL |
|
|
|
203,602 |
0.6 |
3,725 |
|
AFRICA |
|
|
|
|
|
|
Tasiast |
|
Mauritania |
100% |
19,551 |
2.4 |
1,504 |
|
SUBTOTAL |
|
|
19,551 |
2.4 |
1,504 |
|
|
|
|
|
|
|
|
|
TOTAL GOLD |
|
|
|
413,248 |
0.9 |
11,484 |
|
|
|
|
|
|
|
|
|
MINERAL RESERVE AND MINERAL RESOURCE
STATEMENT |
|
SILVER |
|
INFERRED MINERAL RESOURCES
(3,4,5,6,7,10,11,13) |
|
|
|
Kinross Gold Corporation's Share at December 31,
2023 |
|
|
|
|
|
|
Kinross |
Inferred |
|
|
|
Location |
Interest |
Tonnes |
Grade |
Ounces |
|
|
|
|
(%) |
(kt) |
(g/t) |
(koz) |
|
NORTH AMERICA |
|
|
|
|
|
|
Manh Choh |
|
USA |
70% |
10 |
10.2 |
3 |
|
Round Mountain |
8 |
USA |
100% |
330 |
1.1 |
12 |
|
SUBTOTAL |
|
|
339 |
1.4 |
15 |
|
SOUTH AMERICA |
|
|
|
|
|
|
La Coipa |
9 |
Chile |
100% |
2,933 |
42.3 |
3,987 |
|
SUBTOTAL |
|
|
2,933 |
42.3 |
3,987 |
|
|
|
|
|
|
|
|
|
TOTAL SILVER |
|
|
3,272 |
38.0 |
4,002 |
See page 35 of this news release
for details of the footnotes referenced within the table
above.
Mineral Reserve and Mineral Resource Statement
Notes
(1) Unless otherwise noted, the Company's
mineral reserves are estimated using appropriate cut-off grades
based on an assumed gold price of $1,400 per ounce and a silver
price of $17.50 per ounce. Mineral reserves are estimated using
appropriate process recoveries, operating costs and mine plans that
are unique to each property and include estimated allowances for
dilution and mining recovery. Mineral reserve estimates are
reported in contained units based on Kinross' interest and are
estimated based on the following foreign exchange rates:
Canadian Dollar to $US 1.30
Chilean Peso to $US 850.00
Brazilian Real to $US 5.00
Mauritanian Ouguiya to $US 35.00
(2) The mineral reserve estimates for Lobo
Marte assume a $1,200 per ounce gold price and foreign exchange
rate assumption of Chilean Peso to $US 800.00 are based on the 2021
Feasibility Study.
(3) The Company’s mineral reserve and
mineral resource estimates as at December 31, 2023 are classified
in accordance with the Canadian Institute of Mining, Metallurgy and
Petroleum (“CIM”) “CIM Definition Standards ‑ For
Mineral Resources and Mineral Reserves” adopted by the CIM Council
(as amended, the “CIM Definition Standards”) in accordance with the
requirements of National Instrument 43‑101
“Standards of Disclosure for Mineral Projects” (“NI
43‑101”). Mineral reserve and mineral resource
estimates reflect the Company’s reasonable expectation that all
necessary permits and approvals will be obtained and
maintained.
(4) Cautionary note to U.S. investors
concerning estimates of mineral reserves and mineral resources.
These estimates have been prepared in accordance with the
requirements of Canadian securities laws, which differ from the
requirements of United States’ securities laws. The terms “mineral
reserve”, “proven mineral reserve”, “probable mineral reserve”,
“mineral resource”, “measured mineral resource”, “indicated mineral
resource” and “inferred mineral resource” are Canadian mining terms
as defined in accordance with NI 43‑101 and the
CIM Definition Standards. These definitions differ from the
definitions in subpart 1300 of Regulation S‑K
(“Subpart 1300”), which replaced the United States Securities and
Exchange Commission (“SEC”) Industry Guide 7 as part of the SEC’s
amendments to its disclosure rules to modernize the mineral
property disclosure requirements. These amendments became effective
February 25, 2019 and registrants are required to comply with the
Subpart 1300 provisions by their first fiscal year beginning on or
after January 1, 2021. While the definitions in Subpart 1300 are
more similar to the definitions in NI 43‑101 and
the CIM Definitions Standard than were the Industry Guide 7
provisions due to the adoption in Subpart 1300 of terms describing
mineral reserves and mineral resources that are “substantially
similar” to the corresponding terms under the CIM Definition
Standards, including the SEC now recognizing estimates of “measured
mineral resources”, “indicated mineral resources” and “inferred
mineral resources” and amending its definitions of “proven mineral
reserves” and “probable mineral reserves” to be “substantially
similar” to the corresponding CIM Definitions, the definitions in
Subpart 1300 still differ from the requirements of, and the
definitions in, NI 43‑101 and the CIM Definition
Standards. U.S. investors are cautioned that while the above terms
are “substantially similar” to CIM Definitions, there are
differences in the definitions in Subpart 1300 and the CIM
Definition Standards. Accordingly, there is no assurance any
mineral reserves or mineral resources that the Company may report
as “proven mineral reserves”, “probable mineral reserves”,
“measured mineral resources”, “indicated mineral resources” and
“inferred mineral resources” under NI 43‑101
would be the same had the Company prepared the mineral reserve or
mineral resource estimates under the standards set forth in Subpart
1300. U.S. investors are also cautioned that while the SEC
recognizes “measured mineral resources”, “indicated mineral
resources” and “inferred mineral resources” under Subpart 1300,
investors should not assume that any part or all of the
mineralization in these categories will ever be converted into a
higher category of mineral resources or into mineral reserves.
Mineralization described using these terms has a greater amount of
uncertainty as to its existence and feasibility than mineralization
that has been characterized as reserves. Accordingly, investors are
cautioned not to assume that any measured mineral resources,
indicated mineral resources, or inferred mineral resources that the
Company reports are or will be economically or legally mineable.
Further, “inferred mineral resources” have a greater amount of
uncertainty as to their existence and as to whether they can be
mined legally or economically. Therefore, U.S. investors are also
cautioned not to assume that all or any part of the “inferred
mineral resources” exist. Under Canadian securities laws, estimates
of “inferred mineral resources” may not form the basis of
feasibility or pre‑feasibility studies, except in
rare cases. As a foreign private issuer that files its annual
report on Form 40‑F with the SEC pursuant to the
multi‑jurisdictional disclosure system, the
Company is not required to provide disclosure on its mineral
properties under the Subpart 1300 provisions and will continue to
provide disclosure under NI 43‑101 and the CIM
Definition Standards. If the Company ceases to be a foreign private
issuer or loses its eligibility to file its annual report on Form
40‑F pursuant to the
multi‑jurisdictional disclosure system, then the
Company will be subject to reporting pursuant to the Subpart 1300
provisions, which differ from the requirements of NI
43‑101 and the CIM Definition
Standards.
For the above reasons, the mineral reserve
and mineral resource estimates and related information in this news
release may not be comparable to similar information made public by
U.S. companies subject to the reporting and disclosure requirements
under the United States federal securities laws and the rules and
regulations thereunder.
(5) The Company’s mineral resource and
mineral reserve estimates were prepared under the supervision of
and verified by Mr. Nicos Pfeiffer, who is a qualified person as
defined by NI 43‑101.
(6) The Company’s normal data verification
procedures have been used in collecting, compiling, interpreting
and processing the data used to estimate mineral reserves and
mineral resource.
(7) Rounding of values to the 000s may
result in apparent discrepancies.
(8) Round Mountain refers to the Round
Mountain project, which includes the Round Mountain deposit and the
Gold Hill deposit. The Round Mountain deposit does not contain
silver and all silver resources at Round Mountain are contained
exclusively within the Gold Hill deposit. Disclosure of gold
mineral reserves and mineral resources reflect both the Round
Mountain deposit and the Gold Hill deposit. Disclosure of silver
mineral reserves and mineral resources reflect only the Gold Hill
deposit.
(9) Includes mineral resources and mineral
reserves from the Puren deposit in which the Company holds a 65%
interest; as well as mineral resources from the Catalina deposit,
in which the Company holds a 50% interest.
(10) Mineral resources are exclusive of
mineral reserves.
(11) Unless otherwise noted, the Company’s
mineral resources are estimated using appropriate cut-off grades
based on a gold price of $1,700 per ounce and a silver price of
$21.3 per ounce. Foreign exchange rates for estimating mineral
resources were the same as for mineral reserves.
(12) The mineral resource estimates for Lobo
Marte assume a $1,600 per ounce gold price and are based on the
2021 Feasibility Study.
(13) Mineral resources that are not mineral
reserves do not have to demonstrate economic viability. Mineral
resources are subject to infill drilling, permitting, mine
planning, mining dilution and recovery losses, among other things,
to be converted into mineral reserves. Due to the uncertainty
associated with inferred mineral resources, it cannot be assumed
that all or any part of an inferred mineral resource will ever be
upgraded to indicated or measured mineral resources, including as a
result of continued exploration.
Mineral Reserve and Mineral Resource
Definitions
A ‘Mineral Resource’ is a
concentration or occurrence of solid material of economic interest
in or on the Earth’s crust in such form, grade or quality and
quantity that there are reasonable prospects for eventual economic
extraction. The location, quantity, grade or quality, continuity
and other geological characteristics of a Mineral Resource are
known, estimated or interpreted from specific geological evidence
and knowledge, including sampling.
An ‘Inferred Mineral Resource’
is that part of a Mineral Resource for which quantity and grade or
quality are estimated on the basis of limited geological evidence
and sampling. Geological evidence is sufficient to imply but not
verify geological and grade or quality continuity. An Inferred
Mineral Resource has a lower level of confidence than that applying
to an Indicated Mineral Resource and must not be converted to a
Mineral Reserve. It is reasonably expected that the majority of
Inferred Mineral Resources could be upgraded to Indicated Mineral
Resources with continued exploration.
An ‘Indicated Mineral Resource’
is that part of a Mineral Resource for which quantity, grade or
quality, densities, shape and physical characteristics are
estimated with sufficient confidence to allow the application of
Modifying Factors in sufficient detail to support mine planning and
evaluation of the economic viability of the deposit. Geological
evidence is derived from adequately detailed and reliable
exploration, sampling and testing and is sufficient to assume
geological and grade or quality continuity between points of
observation. An Indicated Mineral Resource has a lower level of
confidence than that applying to a Measured Mineral Resource and
may only be converted to a Probable Mineral Reserve.
A ‘Measured Mineral Resource’
is that part of a Mineral Resource for which quantity, grade or
quality, densities, shape, and physical characteristics are
estimated with confidence sufficient to allow the application of
Modifying Factors to support detailed mine planning and final
evaluation of the economic viability of the deposit. Geological
evidence is derived from detailed and reliable exploration,
sampling and testing and is sufficient to confirm geological and
grade or quality continuity between points of observation. A
Measured Mineral Resource has a higher level of confidence than
that applying to either an Indicated Mineral Resource or an
Inferred Mineral Resource. It may be converted to a Proven Mineral
Reserve or to a Probable Mineral Reserve.
A ‘Mineral Reserve’ is the
economically mineable part of a Measured and/or Indicated Mineral
Resource. It includes diluting materials and allowances for losses,
which may occur when the material is mined or extracted and is
defined by studies at Pre-Feasibility or Feasibility level as
appropriate that include application of Modifying Factors. Such
studies demonstrate that, at the time of reporting, extraction
could reasonably be justified. The reference point at which Mineral
Reserves are defined, usually the point where the ore is delivered
to the processing plant, must be stated. It is important that, in
all situations where the reference point is different, such as for
a saleable product, a clarifying statement is included to ensure
that the reader is fully informed as to what is being reported. The
public disclosure of a Mineral Reserve must be demonstrated by a
Pre-Feasibility Study or Feasibility Study.
A ‘Probable Mineral Reserve’ is
the economically mineable part of an Indicated, and in some
circumstances, a Measured Mineral Resource. The confidence in the
Modifying Factors applying to a Probable Mineral Reserve is lower
than that applying to a Proven Mineral Reserve.
A ‘Proven Mineral Reserve’ is the economically
mineable part of a Measured Mineral Resource. A Proven Mineral
Reserve implies a high degree of confidence in the Modifying
Factors.
APPENDIX A
Recent LP zone assay results
|
Hole ID |
|
From
(m) |
To
(m) |
Width
(m) |
True
Width (m) |
Au
(g/t) |
Target |
|
BR-778C4 |
|
1,513.9 |
1,519.0 |
5.2 |
4.6 |
0.56 |
Yuma |
|
BR-778C5 |
No Significant Intersections |
Yuma |
|
BR-789 |
|
1,305.3 |
1,339.5 |
34.2 |
25.7 |
1.05 |
Discovery |
|
BR-789 |
and |
1,354.9 |
1,365.1 |
10.2 |
7.6 |
0.42 |
|
|
BR-789 |
and |
1,512.0 |
1,516.3 |
4.3 |
3.2 |
0.50 |
|
|
BR-799A |
No Significant Intersections |
Bruma |
|
BR-799C |
No Significant Intersections |
Bruma |
|
BR-799D |
|
1,548.0 |
1,551.0 |
3.0 |
2.3 |
0.78 |
Bruma |
|
BR-799D |
and |
1,559.3 |
1,571.4 |
12.1 |
9.3 |
0.52 |
|
|
BR-799D |
and |
1,576.7 |
1,585.5 |
8.8 |
6.7 |
0.38 |
|
|
BR-799D |
and |
1,591.5 |
1,595.6 |
4.1 |
3.2 |
0.48 |
|
|
BR-807 |
|
964.5 |
980.6 |
16.1 |
14.1 |
0.59 |
Discovery |
|
BR-807 |
and |
994.5 |
1,009.5 |
15.0 |
13.2 |
1.65 |
|
|
BR-807 |
including |
1,002.3 |
1,008.0 |
5.8 |
5.1 |
3.33 |
|
|
BR-807 |
and |
1,027.2 |
1,037.7 |
10.5 |
9.2 |
0.44 |
|
|
BR-807 |
and |
1,059.0 |
1,069.5 |
10.5 |
9.2 |
0.89 |
|
|
BR-807 |
and |
1,084.8 |
1,089.0 |
4.2 |
3.7 |
1.74 |
|
|
BR-807 |
and |
1,095.7 |
1,209.0 |
113.3 |
99.7 |
0.67 |
|
|
BR-807 |
including |
1,106.7 |
1,109.7 |
3.0 |
2.7 |
9.68 |
|
|
BR-807 |
and including |
1,207.9 |
1,209.0 |
1.2 |
1.0 |
21.70 |
|
|
BR-808 |
|
797.2 |
801.3 |
4.1 |
3.7 |
0.51 |
Discovery |
|
BR-808 |
and |
809.1 |
820.3 |
11.2 |
10.1 |
0.50 |
|
|
BR-808 |
and |
837.6 |
851.8 |
14.3 |
12.8 |
0.79 |
|
|
BR-809 |
|
716.0 |
742.5 |
26.5 |
22.5 |
0.54 |
Discovery |
|
BR-809 |
and |
781.7 |
809.6 |
27.9 |
23.7 |
0.47 |
|
|
BR-809 |
and |
816.5 |
837.0 |
20.5 |
17.4 |
0.91 |
|
|
BR-809 |
and |
865.3 |
868.3 |
3.0 |
2.6 |
0.44 |
|
|
BR-809 |
and |
907.5 |
910.5 |
3.0 |
2.6 |
2.85 |
|
|
BR-809 |
and |
997.4 |
1,004.3 |
6.9 |
5.9 |
1.17 |
|
|
BR-814C4 |
|
722.9 |
725.9 |
3.0 |
2.5 |
0.38 |
Yauro |
|
BR-814C5 |
|
716.2 |
726.4 |
10.2 |
9.3 |
0.84 |
Yauro |
|
BR-814C5 |
and |
917.3 |
930.0 |
12.8 |
11.7 |
2.71 |
|
|
BR-814C5 |
including |
929.3 |
930.0 |
0.7 |
0.6 |
35.60 |
|
|
BR-814C5 |
and |
971.0 |
974.0 |
3.0 |
2.8 |
0.38 |
|
|
BR-814C5 |
and |
1,089.6 |
1,098.0 |
8.4 |
7.7 |
0.61 |
|
|
BR-814C6 |
|
717.7 |
729.4 |
11.7 |
9.4 |
0.71 |
Yauro |
|
BR-814C6 |
and |
893.3 |
897.2 |
3.9 |
3.1 |
0.61 |
|
|
BR-814C6 |
and |
910.8 |
919.0 |
8.3 |
6.6 |
8.40 |
|
|
BR-814C6 |
including |
913.2 |
916.0 |
2.9 |
2.3 |
23.32 |
|
|
BR-814C6 |
and |
928.0 |
931.3 |
3.3 |
2.6 |
0.72 |
|
|
BR-814C6 |
and |
1,036.5 |
1,040.5 |
4.0 |
3.2 |
6.91 |
|
|
BR-814C6 |
including |
1,037.5 |
1,040.5 |
3.0 |
2.4 |
8.78 |
|
|
BR-814C6 |
and |
1,068.0 |
1,074.6 |
6.6 |
5.2 |
0.72 |
|
|
BR-819 |
|
849.2 |
855.7 |
6.5 |
5.7 |
0.38 |
Auro |
|
BR-819 |
and |
876.0 |
886.2 |
10.2 |
8.9 |
13.87 |
|
|
BR-819 |
including |
879.0 |
881.7 |
2.7 |
2.3 |
51.45 |
|
|
BR-827 |
|
464.2 |
473.0 |
8.8 |
7.7 |
0.41 |
Viggo |
|
BR-827 |
and |
477.6 |
483.6 |
6.0 |
5.2 |
0.58 |
|
|
BR-828 |
|
468.8 |
480.0 |
11.2 |
10.0 |
0.64 |
Viggo |
|
BR-829 |
|
486.6 |
497.2 |
10.6 |
8.5 |
3.78 |
Viggo |
|
BR-829 |
including |
486.6 |
489.0 |
2.4 |
1.9 |
15.05 |
|
|
BR-832C4 |
|
998.7 |
1,002.0 |
3.3 |
2.5 |
0.46 |
Bruma |
|
BR-832C4 |
and |
1,111.5 |
1,117.5 |
6.0 |
4.6 |
1.89 |
|
|
BR-832C4 |
and |
1,170.6 |
1,188.2 |
17.6 |
13.5 |
1.30 |
|
|
BR-832C4 |
and |
1,194.6 |
1,252.3 |
57.8 |
44.5 |
0.62 |
|
|
BR-832C4 |
and |
1,257.7 |
1,274.3 |
16.6 |
12.7 |
1.00 |
|
|
BR-835A |
No Significant Intersections |
Viggo |
|
BR-836 |
No Significant Intersections |
Viggo |
|
BR-837 |
|
895.9 |
898.9 |
3.0 |
2.6 |
0.51 |
Viggo |
|
BR-838 |
|
762.9 |
766.0 |
3.1 |
2.6 |
0.82 |
Viggo |
|
BR-839 |
No Significant Intersections |
Viggo |
|
BR-843 |
|
244.5 |
249.0 |
4.5 |
3.5 |
1.26 |
Yuma |
|
BR-843A |
|
1,258.5 |
1,299.0 |
40.5 |
35.6 |
0.74 |
Yuma |
|
BR-843A |
and |
1,317.0 |
1,321.5 |
4.5 |
4.0 |
0.93 |
|
|
BR-843A |
and |
1,356.6 |
1,359.0 |
2.4 |
2.1 |
3.49 |
|
|
BR-843AC1A |
|
1,317.1 |
1,336.4 |
19.3 |
15.4 |
89.14 |
Yuma |
|
BR-843AC1A |
including |
1,317.1 |
1,321.5 |
4.4 |
3.5 |
389.57 |
|
|
BR-843AC1A |
and |
1,481.8 |
1,484.8 |
3.0 |
2.4 |
2.07 |
|
|
BR-844 |
|
1,369.0 |
1,375.4 |
6.4 |
5.1 |
0.47 |
Bruma |
|
BR-844 |
and |
1,394.2 |
1,402.0 |
7.9 |
6.2 |
0.98 |
|
|
BR-844 |
and |
1,417.8 |
1,427.5 |
9.8 |
7.7 |
0.47 |
|
|
BR-844 |
and |
1,435.0 |
1,438.0 |
3.0 |
2.4 |
0.70 |
|
|
BR-844 |
and |
1,451.3 |
1,463.8 |
12.5 |
9.9 |
0.70 |
|
|
BR-844C1 |
|
1,115.3 |
1,120.4 |
5.1 |
4.3 |
0.96 |
Bruma |
|
BR-844C1 |
and |
1,378.5 |
1,402.0 |
23.5 |
20.0 |
0.71 |
|
|
BR-844C1 |
and |
1,408.0 |
1,435.2 |
27.2 |
23.1 |
0.51 |
|
|
BR-844C1 |
and |
1,454.5 |
1,459.5 |
5.0 |
4.3 |
0.97 |
|
|
BR-844C1 |
and |
1,473.6 |
1,481.7 |
8.1 |
6.8 |
0.55 |
|
|
BR-845 |
|
858.0 |
891.5 |
33.5 |
30.5 |
1.32 |
Discovery |
|
BR-845 |
including |
865.5 |
870.2 |
4.8 |
4.3 |
4.71 |
|
|
BR-845 |
and |
920.2 |
924.9 |
4.7 |
4.3 |
0.83 |
|
|
BR-845 |
and |
958.5 |
961.5 |
3.0 |
2.7 |
0.82 |
|
|
BR-845 |
and |
970.5 |
973.5 |
3.0 |
2.7 |
0.54 |
|
|
BR-845 |
and |
996.0 |
1,005.0 |
9.0 |
8.2 |
0.45 |
|
|
BR-846 |
|
885.5 |
888.8 |
3.4 |
3.1 |
0.37 |
Discovery |
|
BR-846 |
and |
906.1 |
911.2 |
5.2 |
4.7 |
0.38 |
|
|
BR-846 |
and |
946.5 |
956.6 |
10.1 |
9.3 |
0.76 |
|
|
BR-846 |
and |
962.0 |
982.9 |
20.9 |
19.2 |
0.45 |
|
|
BR-846 |
and |
1,116.0 |
1,119.8 |
3.8 |
3.5 |
0.82 |
|
|
BR-852 |
No Significant Intersections |
Viggo |
|
BR-854 |
No Significant Intersections |
Regional |
|
BR-861 |
|
404.7 |
408.3 |
3.6 |
3.3 |
1.20 |
Regional |
|
BR-864 |
No Significant Intersections |
Regional |
|
BR-865 |
|
1,466.0 |
1,469.0 |
3.0 |
2.7 |
0.65 |
Auro |
|
BR-866 |
|
1,074.5 |
1,077.5 |
3.0 |
2.4 |
0.41 |
Auro |
|
BR-867A |
|
1,073.0 |
1,077.5 |
4.5 |
3.9 |
0.75 |
Auro |
|
BR-867A |
and |
1,230.9 |
1,234.4 |
3.5 |
3.0 |
0.85 |
|
|
BR-870C3A |
|
1,176.0 |
1,180.5 |
4.5 |
3.4 |
0.37 |
Yuma |
|
BR-870C3A |
and |
1,271.8 |
1,287.0 |
15.2 |
11.6 |
2.10 |
|
|
BR-870C3A |
including |
1,285.5 |
1,287.0 |
1.5 |
1.1 |
15.70 |
|
|
BR-870C3A |
and |
1,292.9 |
1,304.3 |
11.4 |
8.6 |
1.16 |
|
|
BR-870C3A |
and |
1,315.5 |
1,335.0 |
19.5 |
14.8 |
0.90 |
|
|
BR-870C3A |
and |
1,377.8 |
1,381.5 |
3.8 |
2.9 |
0.73 |
|
|
BR-870C4A |
No Significant Intersections |
Yuma |
|
BR-870C4B |
No Significant Intersections |
Yuma |
|
BR-870C4C |
No Significant Intersections |
Yuma |
|
BR-870C4E |
|
1,221.9 |
1,224.9 |
3.1 |
2.6 |
0.60 |
Yuma |
|
BR-870C4E |
and |
1,231.5 |
1,235.0 |
3.5 |
2.9 |
0.38 |
|
|
BR-870C4E |
and |
1,249.9 |
1,260.4 |
10.6 |
8.9 |
0.64 |
|
|
BR-870C4E |
and |
1,272.3 |
1,275.3 |
3.0 |
2.5 |
0.33 |
|
|
BR-880 |
No Significant Intersections |
Viggo |
|
BR-881 |
|
1,278.6 |
1,284.0 |
5.4 |
4.2 |
0.79 |
Viggo |
|
BR-881 |
and |
1,291.6 |
1,295.0 |
3.4 |
2.7 |
0.47 |
|
|
BR-883 |
|
1,030.7 |
1,035.2 |
4.5 |
3.8 |
0.41 |
Auro |
|
BR-883 |
and |
1,074.2 |
1,081.0 |
6.8 |
5.8 |
0.64 |
|
|
BR-883 |
and |
1,101.2 |
1,104.2 |
3.0 |
2.6 |
0.69 |
|
|
BR-883 |
and |
1,110.2 |
1,119.0 |
8.8 |
7.5 |
0.73 |
|
|
BR-890A |
|
1,331.5 |
1,363.2 |
31.7 |
26.3 |
2.01 |
Discovery |
|
BR-890A |
including |
1,361.2 |
1,363.2 |
2.0 |
1.6 |
18.79 |
|
|
BR-890A |
and |
1,369.5 |
1,375.7 |
6.2 |
5.1 |
0.77 |
|
|
BR-900 |
|
252.4 |
255.5 |
3.1 |
2.5 |
0.45 |
Yauro |
|
BR-900A |
No Significant Intersections |
Yauro |
|
DHZ-062 |
|
66.3 |
69.3 |
3.0 |
2.7 |
0.44 |
Hinge |
|
DHZ-063 |
No Significant Intersections |
Hinge |
|
DL-093 |
|
329.5 |
334.1 |
4.6 |
3.7 |
2.72 |
Limb |
|
DL-100 |
|
405.3 |
413.1 |
7.8 |
6.3 |
1.78 |
Limb |
|
DL-101 |
No Significant Intersections |
Limb |
|
DL-131C1 |
No Significant Intersections |
Hinge |
|
DL-131C2 |
No Significant Intersections |
Hinge |
|
DL-131C3 |
|
947.3 |
949.7 |
2.4 |
2.2 |
7.44 |
Hinge |
|
DL-149 |
|
781.5 |
788.5 |
7.1 |
5.9 |
3.02 |
Limb |
|
DL-149 |
including |
783.0 |
786.5 |
3.5 |
2.9 |
4.19 |
|
Appendix B
LP long section demonstrating potential for extension of a
high-grade underground resource.
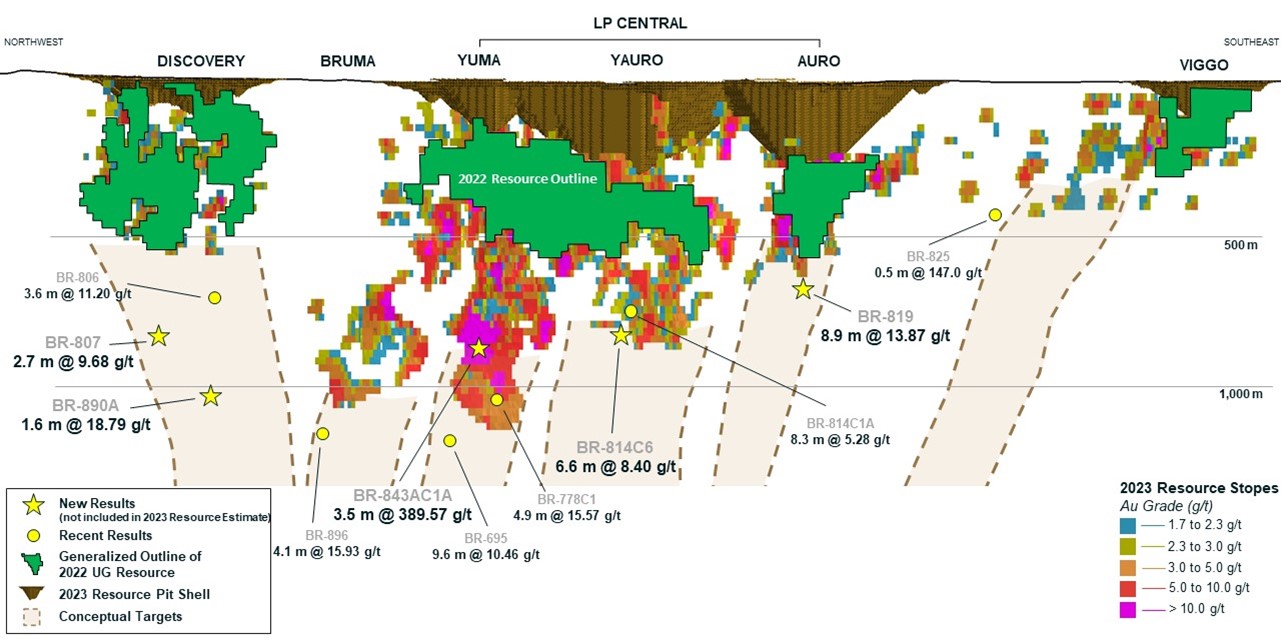
An infographic is available at https://www.globenewswire.com/NewsRoom/AttachmentNg/dc2d62e2-fd15-4bcb-8efb-71ca2c59278f
Composites generated from drill intersections received
since the November 8, 2023, news release includes assays from
49 fully assayed drill holes at the LP zone, 9 fully assayed drill
holes at the Hinge and Limb zone, and 3 fully assayed regional
drill holes. Composites are generated using 0.3 g/t minimum grade,
maximum linear internal dilution of 5.0 m, and allows short
high-grade intervals greater than 8 GXM to be retained. Results are
preliminary in nature and are subject to on-going QA/QC. For full
list of significant, composited assay results, see Appendix A.
APPENDIX C
Figure 1: Curlew Basin Cross Section
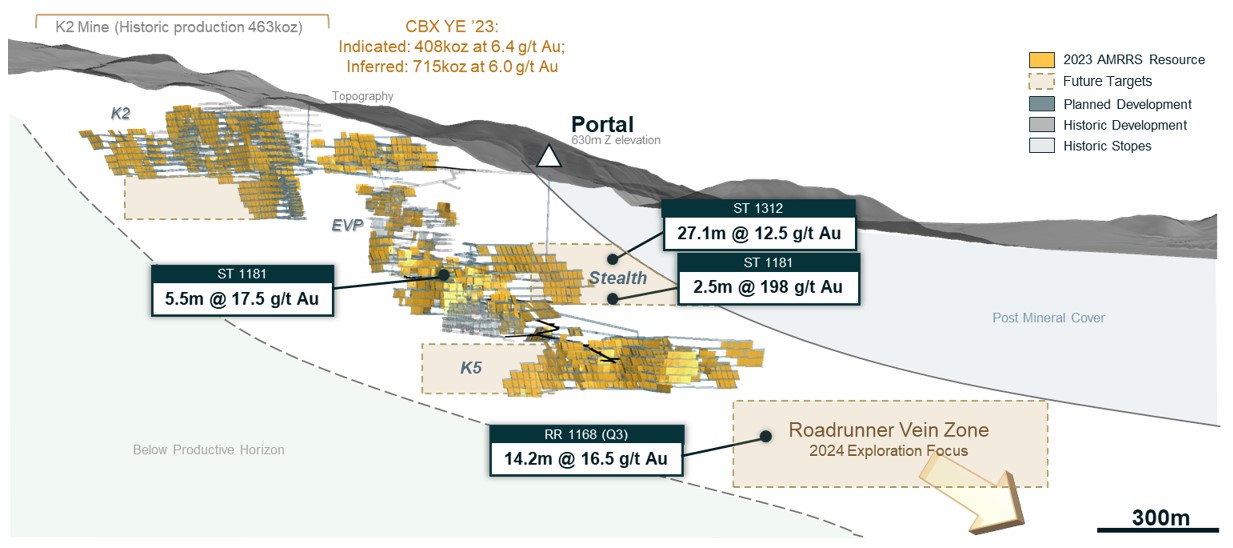
An infographic is available at https://www.globenewswire.com/NewsRoom/AttachmentNg/e8a68ba5-15e6-4518-a8e1-24133cfc5ed7
Figure 2: Alaska Exploration Intercept
Highlights
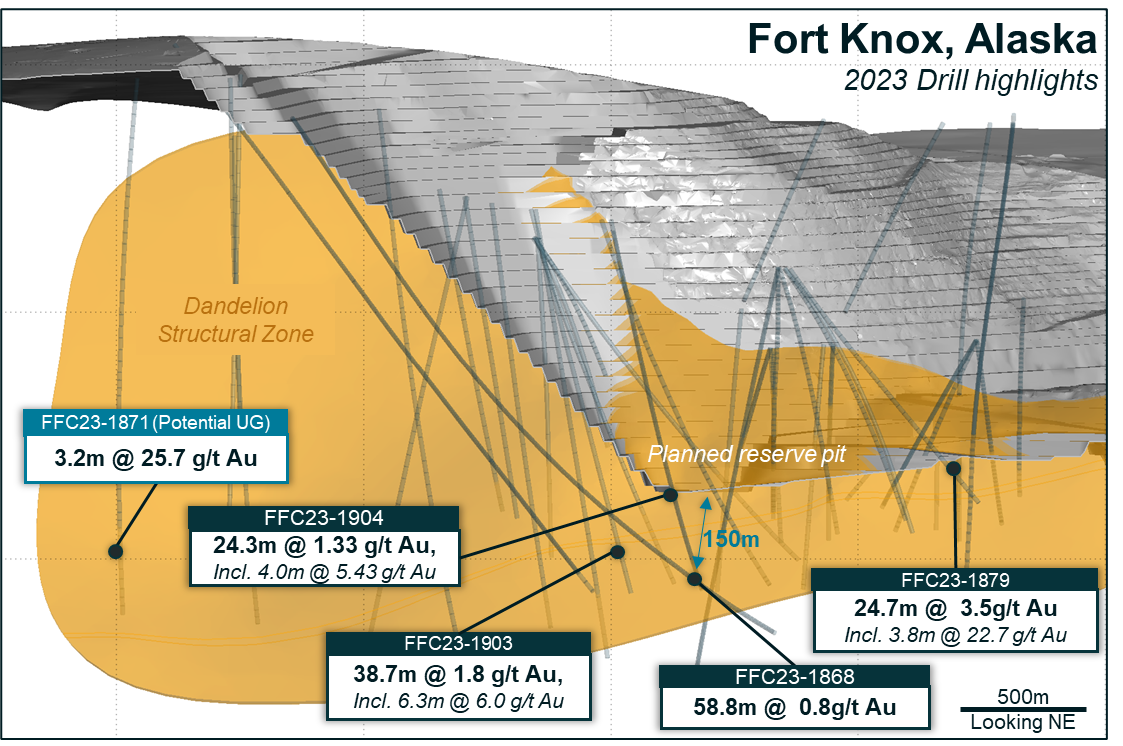
An infographic is available at https://www.globenewswire.com/NewsRoom/AttachmentNg/48a65dda-8c9c-4821-9bc9-6c7fe3a7abdf
Figure 3: SENISA and TMLSA License Map
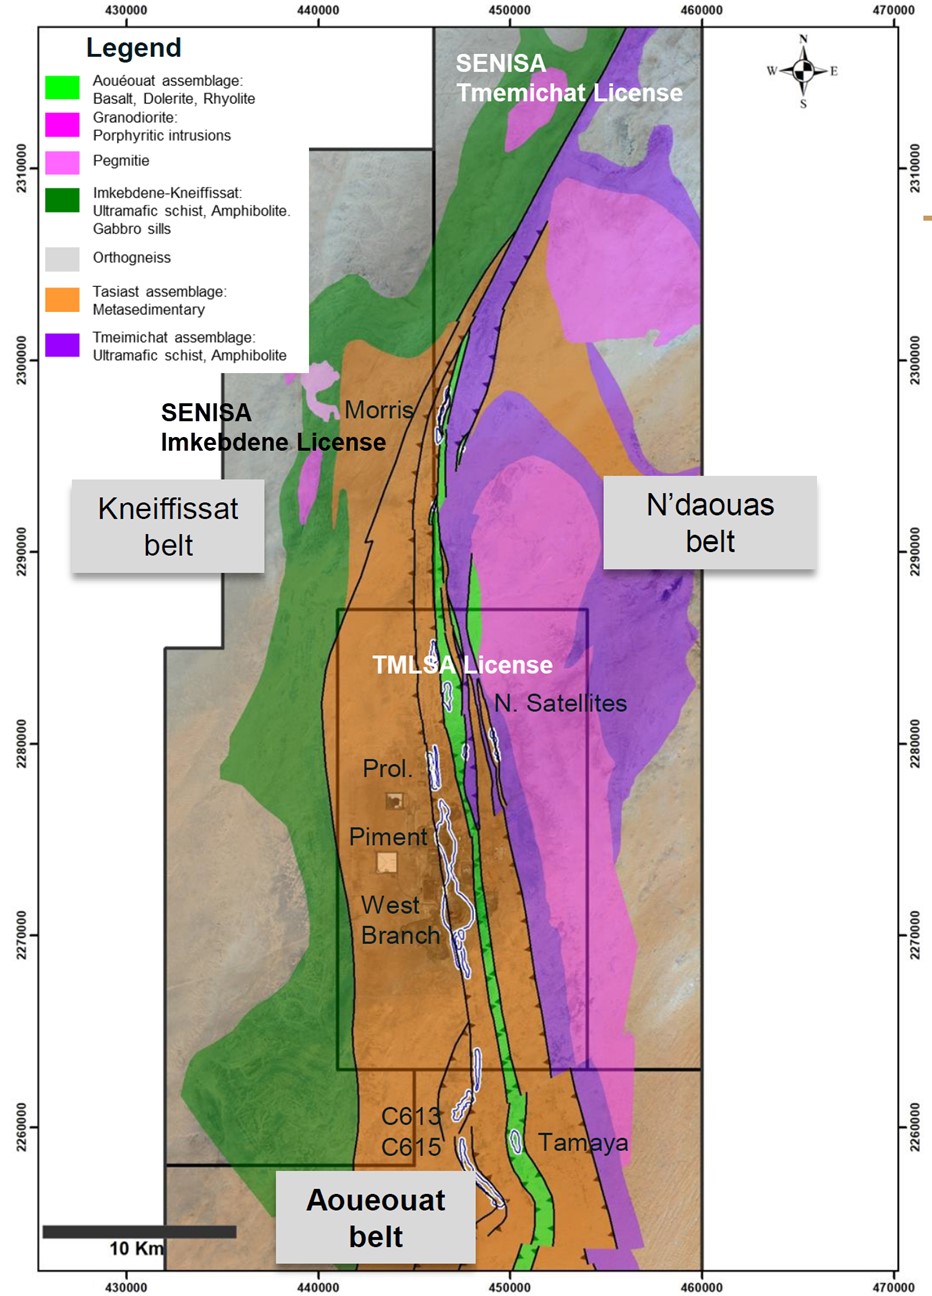
An infographic is available at https://www.globenewswire.com/NewsRoom/AttachmentNg/d0089af9-dce8-499a-a1a5-7ddaf8f2eb17
Figure 4: SENISA Main Target Areas
The radius circle denotes the distance from the mill at the
Tasiast mine.
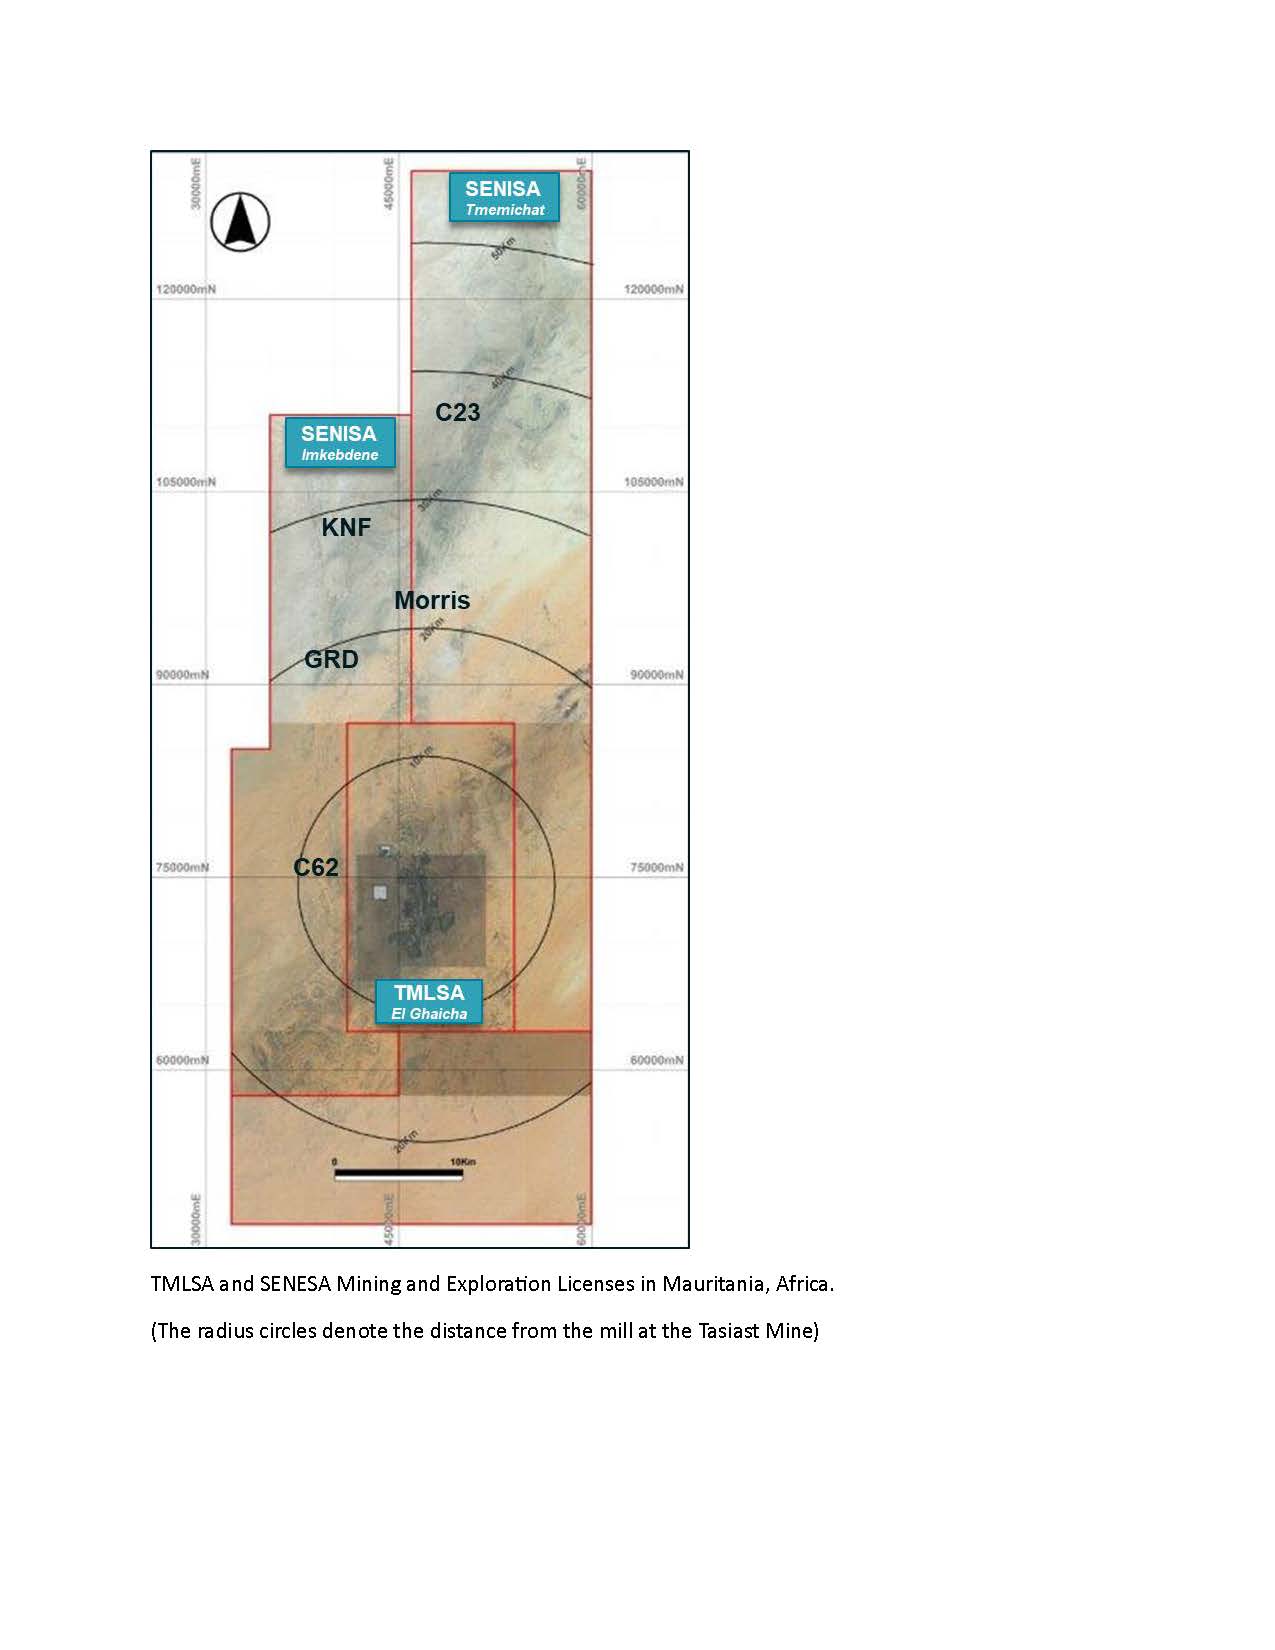
An infographic is available at https://www.globenewswire.com/NewsRoom/AttachmentNg/959233eb-ef8c-4cba-816c-7d3cd0c3518b
Figure 5: Cerros Bravos Location Map
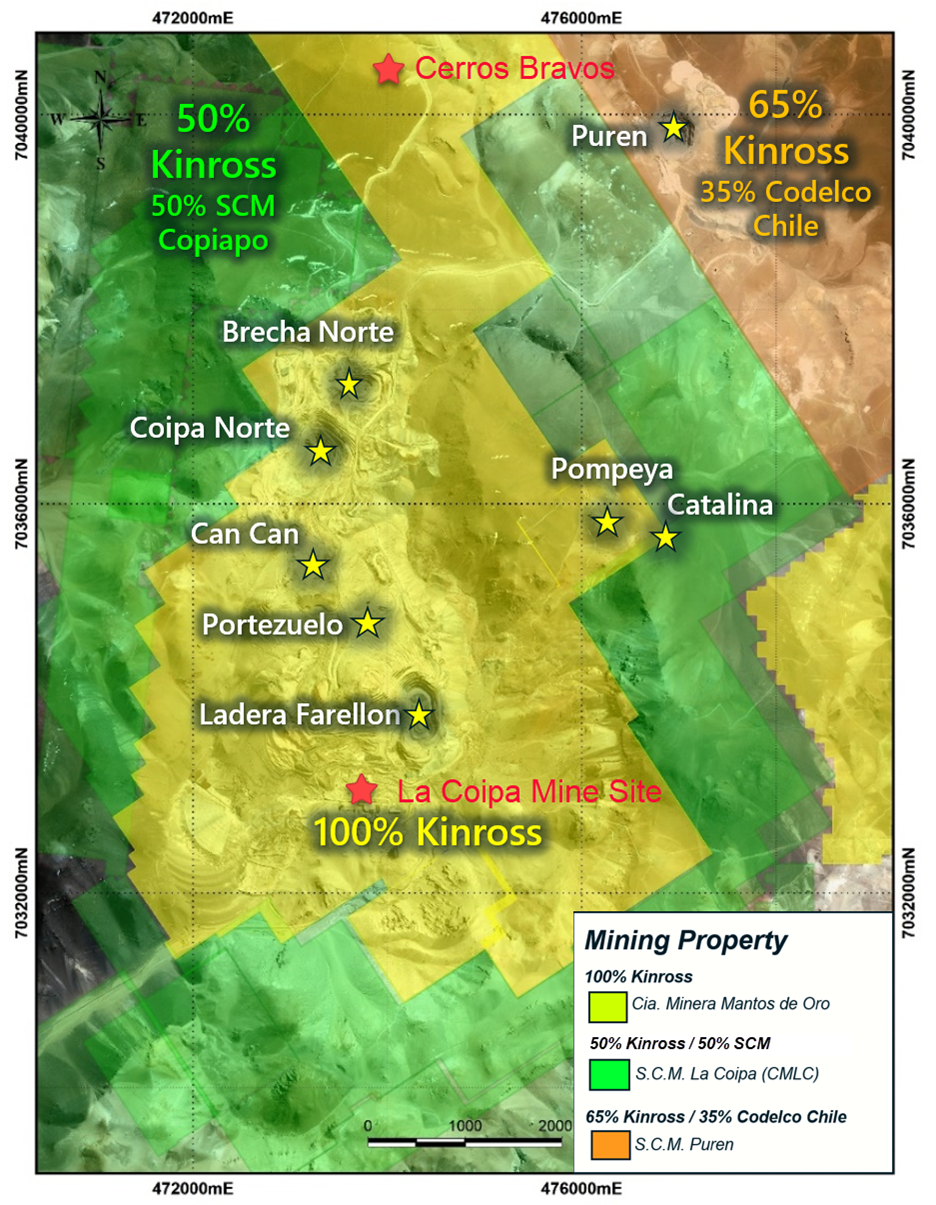
An infographic is available at https://www.globenewswire.com/NewsRoom/AttachmentNg/60b758b7-5daa-4147-a505-3dd0f538380d
Figure 6: Snow Lake, Manitoba, Property Location
Map
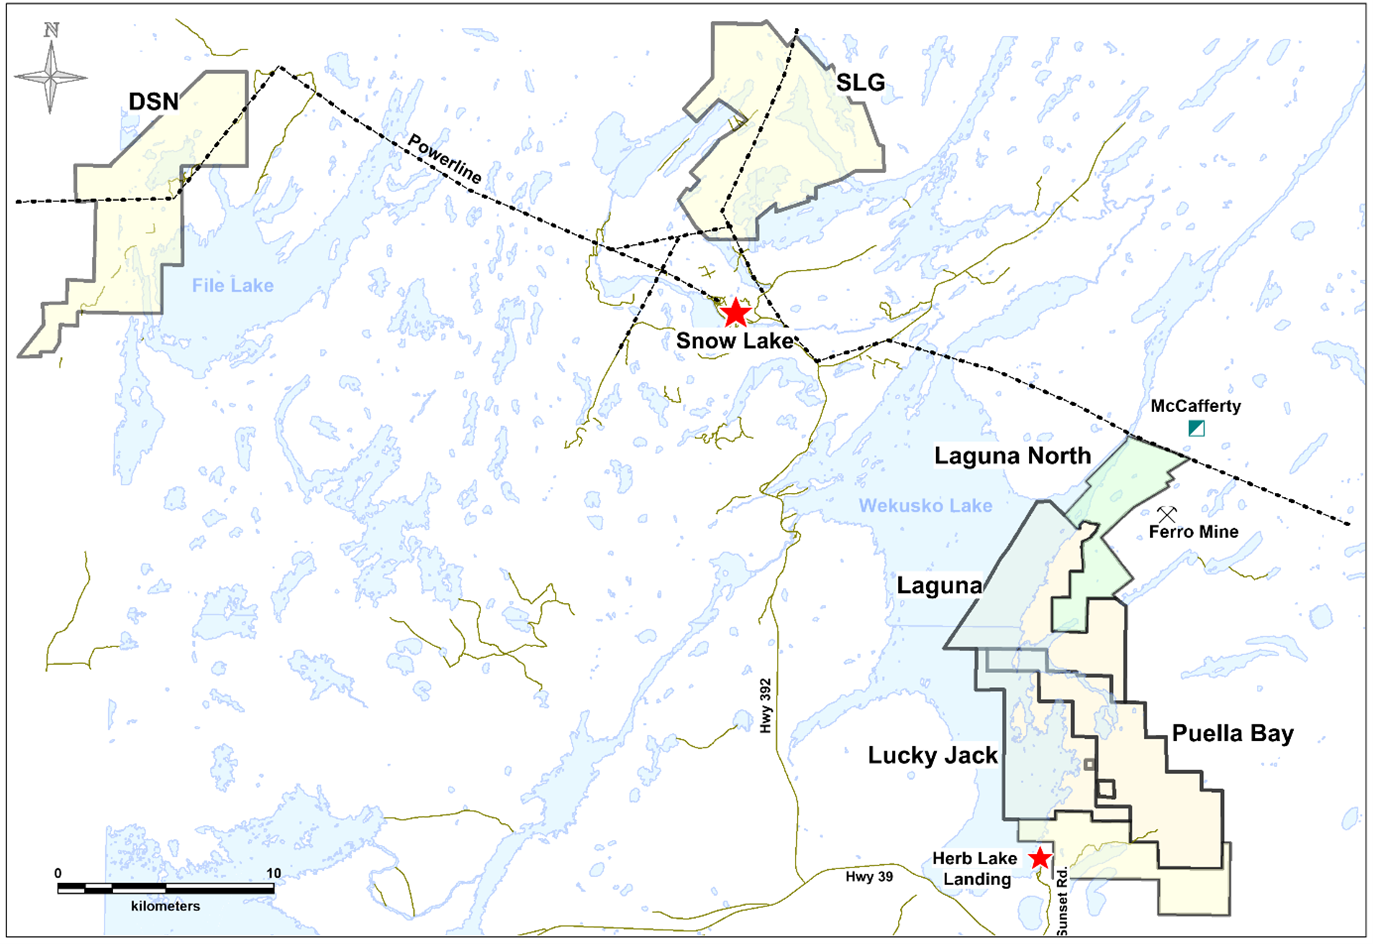
An infographic is available at https://www.globenewswire.com/NewsRoom/AttachmentNg/b98f3b66-ef2a-4d28-938a-605610bf6023
Cautionary statement on forward-looking
information
All statements, other than statements of
historical fact, contained or incorporated by reference in this
news release including, but not limited to, any information as to
the future financial or operating performance of Kinross,
constitute “forward-looking information” or “forward-looking
statements” within the meaning of certain securities laws,
including the provisions of the Securities Act (Ontario) and the
provisions for “safe harbor” under the United States Private
Securities Litigation Reform Act of 1995 and are based on
expectations, estimates and projections as of the date of this news
release. Forward-looking statements contained in this news release,
include, but are not limited to, those under the headings (or
headings that include) “2023 full year results and 2024 guidance”,
“Operational, development project and exploration highlights”, “CEO
commentary”, “Return of capital”, “Development projects”, “Company
Guidance”, and “Environment, Social and Governance” as well as
statements with respect to our guidance for production, cost
guidance, including production costs of sales, all-in sustaining
cost of sales, and capital expenditures; statements with respect to
our guidance for cash flow and attributable free cash flow;
the declaration, payment and sustainability of the Company’s
dividends; identification of additional resources and reserves or
the conversion of resources to reserves; the Company’s
liquidity; greenhouse gas reduction initiatives and
targets; the implementation and effectiveness of the Company’s ESG
or Climate Change strategy; the schedules budgets, and forecast
economics for the Company’s development projects; budgets for and
future prospects for exploration, development and operation at the
Company’s operations and projects, including the Great Bear
project; potential mine life extensions at the Company’s
operations; the Company’s balance sheet and liquidity outlook, as
well as references to other possible events including, the future
price of gold and silver, costs of production, operating costs;
price inflation; capital expenditures, costs and timing of the
development of projects and new deposits, estimates and the
realization of such estimates (such as mineral or gold reserves and
resources or mine life), success of exploration, development and
mining, currency fluctuations, capital requirements, project
studies, government regulation, permit applications, environmental
risks and proceedings, and resolution of pending litigation. The
words “advance”, “continue”, “estimates”, “expects”, “focus”,
“forecast”, “guidance”, “on plan”, “on schedule”, “on track”,
“opportunity” “outlook”, “plan”, “potential”, “priority”,
“prospect”, “target”, “upside”, or variations of or similar such
words and phrases or statements that certain actions, events or
results may, could, should or will be achieved, received or taken,
or will occur or result and similar such expressions identify
forward-looking statements. Forward-looking statements are
necessarily based upon a number of estimates and assumptions that,
while considered reasonable by Kinross as of the date of such
statements, are inherently subject to significant business,
economic and competitive uncertainties and contingencies. The
estimates, models and assumptions of Kinross referenced, contained
or incorporated by reference in this news release, which may prove
to be incorrect, include, but are not limited to, the various
assumptions set forth herein and in our Management’s Discussion and
Analysis (“MD&A”) for the year ended December 31, 2023, and the
Annual Information Form dated March 31, 2023 as well as: (1) there
being no significant disruptions affecting the operations of the
Company, whether due to extreme weather events (including, without
limitation, excessive snowfall, excessive or lack of rainfall, in
particular, the potential for further production curtailments at
Paracatu resulting from insufficient rainfall and the operational
challenges at Fort Knox and Bald Mountain resulting from excessive
rainfall or snowfall, which can impact costs and/or production) and
other or related natural disasters, labour disruptions (including
but not limited to strikes or workforce reductions), supply
disruptions, power disruptions, damage to equipment, pit wall
slides or otherwise; (2) permitting, development, operations and
production from the Company’s operations and development projects
being consistent with Kinross’ current expectations including,
without limitation: the maintenance of existing permits and
approvals and the timely receipt of all permits and authorizations
necessary for the operation of Tasiast; water and power supply and
continued operation of the tailings reprocessing facility at
Paracatu; permitting of the Great Bear project (including the
consultation process with Indigenous groups), permitting and
development of the Lobo-Marte project; in each case in a manner
consistent with the Company’s expectations; and the successful
completion of exploration consistent with the Company’s
expectations at the Company’s projects; (3) political and legal
developments in any jurisdiction in which the Company operates
being consistent with its current expectations including, without
limitation, restrictions or penalties imposed, or actions taken, by
any government, including but not limited to amendments to the
mining laws, and potential power rationing and tailings facility
regulations in Brazil (including those related to financial
assurance requirements), potential amendments to water laws and/or
other water use restrictions and regulatory actions in Chile, new
dam safety regulations, potential amendments to minerals and mining
laws and energy levies laws, new regulations relating to work
permits, potential amendments to customs and mining laws (including
but not limited to amendments to the VAT) and the potential
application of the tax code in Mauritania, potential amendments to
and enforcement of tax laws in Mauritania (including, but not
limited to, the interpretation, implementation, application and
enforcement of any such laws and amendments thereto), potential
third party legal challenges to existing permits, and the impact of
any trade tariffs being consistent with Kinross’ current
expectations; (4) the completion of studies, including scoping
studies, preliminary economic assessments, pre-feasibility or
feasibility studies, on the timelines currently expected and the
results of those studies being consistent with Kinross’ current
expectations; (5) the exchange rate between the Canadian dollar,
Brazilian real, Chilean peso, Mauritanian ouguiya and the U.S.
dollar being approximately consistent with current levels; (6)
certain price assumptions for gold and silver; (7) prices for
diesel, natural gas, fuel oil, electricity and other key supplies
being approximately consistent with the Company’s expectations; (8)
attributable production and cost of sales forecasts for the Company
meeting expectations; (9) the accuracy of the current mineral
reserve and mineral resource estimates of the Company and Kinross’
analysis thereof being consistent with expectations (including but
not limited to ore tonnage and ore grade estimates), future mineral
resource and mineral reserve estimates being consistent with
preliminary work undertaken by the Company, mine plans for the
Company’s current and future mining operations, and the Company’s
internal models; (10) labour and materials costs increasing on a
basis consistent with Kinross’ current expectations; (11) the terms
and conditions of the legal and fiscal stability agreements for
Tasiast being interpreted and applied in a manner consistent with
their intent and Kinross’ expectations and without material
amendment or formal dispute (including without limitation the
application of tax, customs and duties exemptions and royalties);
(12) asset impairment potential; (13) the regulatory and
legislative regime regarding mining, electricity production and
transmission (including rules related to power tariffs) in Brazil
being consistent with Kinross’ current expectations; (14) access to
capital markets, including but not limited to maintaining our
current credit ratings consistent with the Company’s current
expectations; (15) potential direct or indirect operational impacts
resulting from infectious diseases or pandemics; (16) changes in
national and local government legislation or other government
actions, including the Canadian federal impact assessment regime;
(17) litigation, regulatory proceedings and audits, and the
potential ramifications thereof, being concluded in a manner
consistent with the Corporation’s expectations (including without
limitation litigation in Chile relating to the alleged damage of
wetlands and the scope of any remediation plan or other
environmental obligations arising therefrom); (18) the Company’s
financial results, cash flows and future prospects being consistent
with Company expectations in amounts sufficient to permit sustained
dividend payments; and (19) the impacts of detected pit wall
instability at Round Mountain and Bald Mountain being consistent
with the Company’s expectations. Known and unknown factors could
cause actual results to differ materially from those projected in
the forward-looking statements. Such factors include, but are not
limited to: the inaccuracy of any of the foregoing assumptions;
fluctuations in the currency markets; fluctuations in the spot and
forward price of gold or certain other commodities (such as fuel
and electricity); price inflation of goods and services; changes in
the discount rates applied to calculate the present value of net
future cash flows based on country-specific real weighted average
cost of capital; changes in the market valuations of peer group
gold producers and the Company, and the resulting impact on market
price to net asset value multiples; changes in various market
variables, such as interest rates, foreign exchange rates, gold or
silver prices and lease rates, or global fuel prices, that could
impact the mark-to-market value of outstanding derivative
instruments and ongoing payments/receipts under any financial
obligations; risks arising from holding derivative instruments
(such as credit risk, market liquidity risk and mark-to-market
risk); changes in national and local government legislation,
taxation (including but not limited to income tax, advance income
tax, stamp tax, withholding tax, capital tax, tariffs, value-added
or sales tax, capital outflow tax, capital gains tax, windfall or
windfall profits tax, production royalties, excise tax,
customs/import or export taxes/duties, asset taxes, asset transfer
tax, property use or other real estate tax, together with any
related fine, penalty, surcharge, or interest imposed in connection
with such taxes), controls, policies and regulations; the security
of personnel and assets; political or economic developments in
Canada, the United States, Chile, Brazil, Mauritania or other
countries in which Kinross does business or may carry on business;
business opportunities that may be presented to, or pursued by, us;
our ability to successfully integrate acquisitions and complete
divestitures; operating or technical difficulties in connection
with mining, development or refining activities; employee
relations; litigation or other claims against, or regulatory
investigations and/or any enforcement actions, administrative
orders or sanctions in respect of the Company (and/or its
directors, officers, or employees) including, but not limited to,
securities class action litigation in Canada and/or the United
States, environmental litigation or regulatory proceedings or any
investigations, enforcement actions and/or sanctions under any
applicable anti-corruption, international sanctions and/or
anti-money laundering laws and regulations in Canada, the United
States or any other applicable jurisdiction; the speculative nature
of gold exploration and development including, but not limited to,
the risks of obtaining and maintaining necessary licenses and
permits; diminishing quantities or grades of reserves; adverse
changes in our credit ratings; and contests over title to
properties, particularly title to undeveloped properties. In
addition, there are risks and hazards associated with the business
of gold exploration, development and mining, including
environmental hazards, industrial accidents, unusual or unexpected
formations, pressures, cave-ins, flooding and gold bullion losses
(and the risk of inadequate insurance, or the inability to obtain
insurance, to cover these risks). Many of these uncertainties and
contingencies can directly or indirectly affect, and could cause,
Kinross’ actual results to differ materially from those expressed
or implied in any forward-looking statements made by, or on behalf
of, Kinross, including but not limited to resulting in an
impairment charge on goodwill and/or assets. There can be no
assurance that forward-looking statements will prove to be
accurate, as actual results and future events could differ
materially from those anticipated in such statements.
Forward-looking statements are provided for the purpose of
providing information about management’s expectations and plans
relating to the future. All of the forward-looking statements made
in this news release are qualified by this cautionary statement and
those made in our other filings with the securities regulators of
Canada and the United States including, but not limited to, the
cautionary statements made in the “Risk Analysis” section of our
MD&A for the year ended December 31, 2023, and the “Risk
Factors” set forth in the Company’s Annual Information Form dated
March 31, 2023. These factors are not intended to represent a
complete list of the factors that could affect Kinross. Kinross
disclaims any intention or obligation to update or revise any
forward-looking statements or to explain any material difference
between subsequent actual events and such forward-looking
statements, except to the extent required by applicable
law.
Key Sensitivities
Approximately 70%-80% of the Company's costs
are denominated in U.S. dollars.
A 10% change in foreign currency exchange
rates would be expected to result in an approximate $20 impact on
production cost of sales per equivalent ounce
sold20.
Specific to the Brazilian real, a 10% change
in the exchange rate would be expected to result in an approximate
$40 impact on Brazilian production cost of sales per equivalent
ounce sold.
Specific to the Chilean peso, a 10% change
in the exchange rate would be expected to result in an approximate
$30 impact on Chilean production cost of sales per equivalent ounce
sold.
A $10 per barrel change in the price of oil
would be expected to result in an approximate $3 impact on
production cost of sales per equivalent ounce sold.
A $100 change in the price of gold would be
expected to result in an approximate $4 impact on production cost
of sales per equivalent ounce sold as a result of a change in
royalties.
Other information
Where we say "we", "us", "our", the
"Company", or "Kinross" in this news release, we mean Kinross Gold
Corporation and/or one or more or all of its subsidiaries, as may
be applicable.
The technical information about the
Company’s mineral properties contained in this news release has
been prepared under the supervision of Mr. Nicos Pfeiffer, an
officer of the Company who is a “qualified person” within the
meaning of National Instrument 43-101.
Source: Kinross Gold Corporation
___________________________________
1 “Attributable” includes Kinross’ 70% share of
Manh Choh production, costs and capital expenditures. Attributable
guidance figures are non-GAAP financial measures and ratios. Refer
to footnote 3.
2 “Production cost of sales from continuing
operations per equivalent ounce sold” is defined as production cost
of sales, as reported on the consolidated statements of operations,
divided by total gold equivalent ounces sold from continuing
operations.
3 These figures are non-GAAP financial measures and
ratios, as applicable. They are defined and actual results are
reconciled on pages 26 to 30 of this news release. Non-GAAP
financial measures and ratios have no standardized meaning under
IFRS and therefore, may not be comparable to similar measures
presented by other issuers.
4 Capital expenditures is reported as
"Additions to property, plant and equipment" on the consolidated
statements of cash flows.
5 “Margins” from continuing operations per
equivalent ounce sold is defined as average realized gold price per
ounce from continuing operations less production cost of sales from
continuing operations per equivalent ounce sold.
6 Operating cash flow figures in this release
represent “Net cash flow of continuing operations provided from
operating activities,” as reported on the consolidated statements
of cash flows.
7 Earnings, net earnings, and reported net
earnings (loss) figures in this release represent “Net earnings
(loss) from continuing operations attributable to common
shareholders,” as reported on the consolidated statements of
operations.
8 Adjusted net earnings figures in this news release
represent “Adjusted net earnings from continuing operations
attributable to common shareholders.”
9 “Total liquidity” is defined as the sum
of cash and cash equivalents, as reported on the consolidated
balance sheets, and available credit under the Company’s credit
facilities (as calculated in Section 6 Liquidity and Capital
Resources of Kinross’ MD&A for the year ended December 31,
2023).
10 “Available credit” is defined as available credit
under the Company’s credit facilities and is calculated in Section
6 Liquidity and Capital Resources of Kinross’ MD&A for the year
ended December 31, 2023.
11 2024 Gold equivalent ounce production guidance
includes approximately 6.5 million ounces of silver.
12 The percentages are calculated based on the
mid-point of country 2024 forecast production.
13 Refers to all of the currencies in the countries
where the Company has mining operations, fluctuating simultaneously
by 10% in the same direction, either appreciating or depreciating,
taking into consideration the impact of hedging and the weighting
of each currency within our consolidated cost structure.
14 Forecast 2024 sustaining, non-sustaining
and total forecast capital expenditures are attributable and
include Kinross’ share of Manh Choh (70%) capital expenditures.
Actual results as reported for the year ended December 31, 2023,
for sustaining, non-sustaining and total capital expenditures are
on a total basis and include 100% of Manh Choh capital
expenditures. Sustaining and non-sustaining capital expenditures
are non-GAAP financial measures and are defined and reconciled on
page 31 of this news release.
15 Canada’s forecast for non-sustaining capital
expenditures includes approximately $85 million of AEX decline and
study costs at the Great Bear project.
16 Manh Choh non-sustaining capital at 100%
is estimated to be approximately $85 million.
17 The forecast ETR range for 2024 assumes gold
price, foreign exchange and tax rates in the jurisdictions in which
the Company operates remain stable and within 2024 guidance
assumptions. The ETR does not include the impact of items which the
Company believes are not reflective of the Company’s underlying
performance, such as the impact of net foreign currency
translations on tax deductions and taxes related to prior periods.
Management believes that the ETR range provides investors with the
ability to better evaluate the Company’s underlying performance.
However, the ETR range is not necessarily an indicator of tax
expense recognized under IFRS. The rate is sensitive to the
relative proportion of sales between the Company’s various tax
jurisdictions and realized gold prices.
18 DD&A ($/oz) is defined as
depreciation, depletion and amortization, as reported on the
consolidated statements of operations, divided by total gold
equivalent ounces sold from continuing operations.
19 Please see page 35 for Mineral Reserve and
Mineral Resource Statement Notes
20 Rounding of values to the 000s may result in apparent
discrepancies.
21 Refers to all of the
currencies in the countries where the Company has mining
operations, fluctuating simultaneously by 10% in the same
direction, either appreciating or depreciating, taking into
consideration the impact of hedging and the weighting of each
currency within our consolidated cost structure.


Kinross Gold (TSX:K)
Historical Stock Chart
From Mar 2024 to Apr 2024

Kinross Gold (TSX:K)
Historical Stock Chart
From Apr 2023 to Apr 2024
