Oxford Metrics PLC Trading Update (1686R)
October 25 2023 - 1:00AM
UK Regulatory
TIDMOMG
RNS Number : 1686R
Oxford Metrics PLC
25 October 2023
25 October 2023
Oxford Metrics plc
("Oxford Metrics", or the "Group")
Trading Update
- Record Revenue and Adjusted Profit outturn for FY23
Oxford Metrics (LSE: OMG), the smart sensing software company,
servicing life sciences, entertainment and engineering markets,
today provides the following update on trading for the financial
year ended 30 September 2023.
The Group expects to report revenues of GBP44.0m and an Adjusted
PBT* of GBP6.3m, both ahead of current market expectations* for the
financial year. The Group finished the year with a robust cash
position of GBP64.8m and no debt.
Following the Group's strongest-ever first half performance,
momentum continued into the second half driven by a particularly
strong contribution from the Engineering and Life Sciences
segments. Vicon continues to see ongoing demand for smart sensing
into yet more applications from new and existing customers alike
and the new Vicon Valkyrie system launched late last year continues
to stimulate demand.
The Group as a whole remains in a strong financial position
which enables the business to pursue its organic growth and M&A
objectives in the year ahead.
The Group starts a new financial year with a solid order book.
More detail will be provided when Oxford Metrics announces its
Preliminary Results for the financial year ended 30 September 2023
which is expected on Tuesday, 5 December 2023.
*Oxford Metrics' compiled market consensus as at 24 October 2023
is as follows: FY23 Revenue GBP39.00m / FY Adjusted PBT
GBP5.83m.
For further information please contact:
Oxford Metrics                           +44 (0)1865 261860
Imogen Moorhouse, CEO
David Deacon, CFO

Numis Securities Limited                 +44 (0)20 7260 1000
Simon Willis / Hugo Rubinstein / Tejas
 Padalkar

FTI Consulting                           +44 (0)20 3727 1000
Matt Dixon / Emma Hall / Jamille Smith
 / Jemima Gurney
About Oxford Metrics
Oxford Metrics develops software that enables the interface
between the real world and its virtual twin. Our smart sensing
software helps over 10,000 customers in more than 70 countries,
including all of the world's top 10 games companies and all of the
top 20 universities worldwide. Founded in 1984, we started our
journey in healthcare, expanded into entertainment, winning an
OSCAR(R) and an Emmy(R), then moved into defence and engineering.
We have a track record of creating value by incubating, growing and
then augmenting through acquisition, unique technology
businesses.
The Group trades through its market-leading division: Vicon.
Vicon is a world leader in motion measurement analysis to thousands
of customers worldwide, including Guy's Hospital, Industrial Light
& Magic, MIT and NASA.
The Group is headquartered in Oxford with offices in California,
Colorado, and Auckland. Since 2001, Oxford Metrics (LSE: OMG), has
been a quoted company listed on AIM, a market operated by the
London Stock Exchange. For more information about Oxford Metrics,
visit www.oxfordmetrics.com
This information is provided by RNS, the news service of the
London Stock Exchange. RNS is approved by the Financial Conduct
Authority to act as a Primary Information Provider in the United
Kingdom. Terms and conditions relating to the use and distribution
of this information may apply. For further information, please
contact rns@lseg.com or visit www.rns.com.
RNS may use your IP address to confirm compliance with the terms
and conditions, to analyse how you engage with the information
contained in this communication, and to share such analysis on an
anonymised basis with others as part of our commercial services.
For further information about how RNS and the London Stock Exchange
use the personal data you provide us, please see our Privacy
Policy.
END
TSTNKQBKOBDDFKB
(END) Dow Jones Newswires
October 25, 2023 02:00 ET (06:00 GMT)
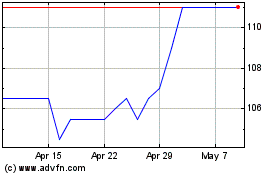
Oxford Metrics (LSE:OMG)
Historical Stock Chart
From Apr 2024 to May 2024

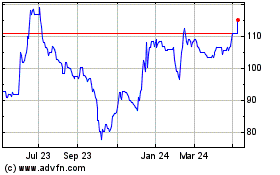
Oxford Metrics (LSE:OMG)
Historical Stock Chart
From May 2023 to May 2024
