Polar Capital Technology Trust PLC Top Fifteen Equity Holdings and Exposures (8660G)
March 06 2018 - 7:46AM
UK Regulatory
TIDMPCT
RNS Number : 8660G
Polar Capital Technology Trust PLC
06 March 2018
6(th) March 2018
Polar Capital Technology Trust plc (the "Company")
Top Fifteen Equity Holdings and Sector and Geographic Exposures
as at 28(th) February 2018 and full Portfolio listing as at 31(st)
January 2018 available from company's website
Polar Capital Technology Trust plc is pleased to announce that
as at 28(th) February 2018 the top fifteen equity holdings and the
sector and geographic breakdown were as follows:
 Top 15 Longs                  %
------------------------  ------
 Alphabet                   8.2%
 Microsoft                  7.4%
 Apple                      6.7%
 Facebook                   5.2%
 Tencent                    3.6%
 Amazon                     2.9%
 Samsung Electronics        2.6%
 Alibaba Group Holding      2.6%
 TSMC                       1.8%
 Salesforce.com             1.7%
 Adobe Systems              1.5%
 ServiceNow                 1.5%
 NVIDIA                     1.4%
 Advanced Micro Devices     1.4%
 ASML Holding               1.3%
------------------------  ------
 Total                     49.8%
------------------------  ------


Sector Exposure                              Total %
-------------------------------------------  -------
Internet Software & Services                   28.3%
Software                                       26.8%
Semiconductors & Semiconductor Equipment       15.1%
Technology Hardware, Storage & Peripherals      9.4%
Electronic Equipment, Instruments
 & Components                                   4.0%
Internet & Direct Marketing Retail              3.5%
IT Services                                     2.3%
Machinery                                       2.1%
Communications Equipment                        1.1%
Chemicals                                       1.0%
Aerospace & Defense                             0.6%
Healthcare Technology                           0.6%
Automobiles                                     0.5%
Auto Components                                 0.5%
Professional Services                           0.3%
Electrical Equipment                            0.2%
Household Durables                              0.1%
Index                                           0.1%
Cash                                            3.4%
Total                                         100.0%
-------------------------------------------  -------


Geographic Exposure    Total %
---------------------  -------
US & Canada              68.8%
Asia Pac (ex-Japan)      13.7%
Japan                     6.5%
Europe (ex UK)            5.1%
UK                        1.9%
Middle East & Africa      0.5%
Latin America             0.1%
Cash                      3.4%
Total                   100.0%
---------------------  -------
A copy of the entire portfolio is published in the annual and
half year reports as well as being published to the Company website
on a quarterly basis.
The monthly factsheet will usually be available on the Company's
website on the 10(th) working day after the month end and includes
a commentary by the investment manager.
www.Polarcapitaltechnologytrust.co.uk
Neither the contents of the Company's website nor the contents
of any website accessible from the hyperlinks on the Company's
website (or any other website) is incorporated into or forms part
of this announcement.
This information is provided by RNS
The company news service from the London Stock Exchange
END
PFUEADDKELDPEFF
(END) Dow Jones Newswires
March 06, 2018 08:46 ET (13:46 GMT)
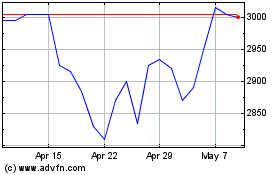
Polar Capital Technology (LSE:PCT)
Historical Stock Chart
From Apr 2024 to May 2024

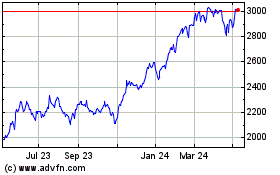
Polar Capital Technology (LSE:PCT)
Historical Stock Chart
From May 2023 to May 2024
