Is Apecoin On Your Radar? APE Soars By 30% In 48 Hours, Signaling A Potential Bull Run
November 26 2023 - 4:43AM
NEWSBTC
In a month marked by heightened volatility, Apecoin (APE) has been
a battleground for bulls striving to prevent a dip below the
crucial $1 mark. This tug-of-war between bulls and potential
downward pressure underscores the intense market dynamics
surrounding Apecoin, leaving investors on the edge as they monitor
the crypto’s price movements in this volatile November landscape.
The latest data from the spot market reveals a resolute stance from
bullish traders, as orders for more than 11 million APE tokens have
beern strategically placed around the current price. Related
Reading: Bitcoin Price Rockets Past $38,000, Hits Highest Peak
Since May 2022 – Details APE has increased by 30% to surpass $1.70
following a decline to a weekly low of $1.30 on November 21.
On-chain data projects long-term Apecoin investors’ resilience
might reenergize APE price possibilities. APE Total Order Books.
Source: IntoTheBlock Apecoin Price Rebounds From All-Time Low
On October 9, the price of Apecoin plunged to an all-time low and
narrowly avoided breaking below the $1 support level. However, the
APE token has now increased by 40%, and as of November 24, the meme
coin was trading at about $1.45. The market situation that APE is
now operating in is difficult. The recent price increases of the
token are at risk due to bearish on-chain indicators. Over the last
few months, the amount of APE coins available on exchanges has
almost doubled to a little over 50 million, which may signal an
increase in buyer demand. The combination of a decrease in active
addresses and an increase in supply on exchanges indicates a
pessimistic deviation, which may indicate an impending decline in
the price of the meme currency. Two notable corrections have
occurred in APE during its current surge. The 61.8% Fibonacci level
marked the first retracement, and 50% marked the second corrective.
Total crypto market cap is currently at $1.4 trillion. Chart:
TradingView.com These retracements are getting thinner, which is a
bullish indication of increasing momentum and more buyer
conviction. Taking this into consideration, investors may use the
38.2% and 50% Fibonacci levels as a helpful guide when placing
stop-loss orders, acting as a buffer against any market volatility.
Apecoin’s price is now bouncing between $1.063 and $1.506,
indicating that it is in a volatile market. There are some
indications of stability from the 10-Days Moving Average at $1.410
and the 100-Days Moving Average at $1.303. Nonetheless, it’s
important to keep an eye on the resistance levels at $1.695 and
$2.139 and the support levels at $0.365 and $0.808. These levels
will be crucial in influencing the short-term price movements of
APE. APE addresses by time held. Source: IntoTheBlock Shift In
Address Dynamics Meanwhile, as reported by IntoTheBlock, a positive
trend divergence is evident between the long-term and short-term
holder addresses for APE. Illustrated in the Addresses by Time Held
chart, the count of long-term addresses has surged by 6,060 wallets
since the beginning of November. Concurrently, the Apecoin network
has experienced a decrease of 3,800 in the number of
trader/short-term wallets over the same period, highlighting a
noteworthy shift in address dynamics. Related Reading: Coinbase
COIN Hits 18-Month High To Rally Near $117 – Is $150 On The Cards?
The forthcoming week holds significant importance for investors in
APE, as it will serve as a crucial assessment of the durability of
this meme coin and its prospects for more upward movements. (This
site’s content should not be construed as investment advice.
Investing involves risk. When you invest, your capital is subject
to risk). Featured image from Pexels
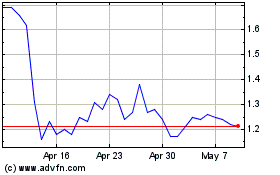
ApeCoin (COIN:APEUSD)
Historical Stock Chart
From Oct 2024 to Nov 2024

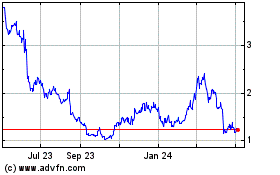
ApeCoin (COIN:APEUSD)
Historical Stock Chart
From Nov 2023 to Nov 2024


