false
0000926326
0000926326
2025-02-06
2025-02-06
iso4217:USD
xbrli:shares
iso4217:USD
xbrli:shares
UNITED STATES
SECURITIES AND EXCHANGE COMMISSION
Washington, D.
C. 20549
FORM 8-K
CURRENT
REPORT
PURSUANT TO SECTION 13
OR 15(d) OF THE
SECURITIES EXCHANGE ACT OF 1934
Date of Report
(Date of earliest event reported): February 6, 2025
OMNICELL, INC.
(Exact name of registrant
as specified in its charter)
| Delaware |
|
000-33043 |
|
94-3166458 |
(State or other jurisdiction of
incorporation) |
|
(Commission File Number) |
|
(IRS Employer Identification Number) |
4220 North Freeway
Fort Worth, TX 76137
(Address of principal
executive offices, including zip code)
(877) 415-9990
(Registrant’s
telephone number, including area code)
Check the appropriate
box below if the Form 8-K filing is intended to simultaneously satisfy the filing obligation of the registrant under any of
the following provisions:
| ¨ |
Written communications pursuant to Rule 425 under the Securities Act (17 CFR 230.425) |
| ¨ |
Soliciting material pursuant to Rule 14a-12 under the Exchange Act (17 CFR 240.14a-12) |
| ¨ |
Pre-commencement communications pursuant to Rule 14d-2(b) under the Exchange Act (17 CFR 240.14d-2(b)) |
| ¨ |
Pre-commencement communications pursuant to Rule 13e-4(c) under the Exchange Act (17 CFR 240.13e-4(c)) |
Securities registered pursuant to Section 12(b) of the Act:
| Title of each class | |
Trading Symbol | |
Name of each exchange on which
registered |
| Common Stock, $0.001 par value | |
OMCL | |
NASDAQ Global Select Market |
Indicate by check mark whether the registrant is an emerging growth
company as defined in Rule 405 of the Securities Act of 1933 (§230.405 of this chapter) or Rule 12b-2 of the Securities Exchange
Act of 1934 (§240.12b-2 of this chapter).
Emerging
growth company ¨
If
an emerging growth company, indicate by check mark if the registrant has elected not to use the extended transition period for
complying with any new or revised financial accounting standards provided pursuant to Section 13(a) of the Exchange Act. ¨
Item 2.02 Results of Operations and Financial Condition.
On February 6, 2025, Omnicell, Inc. (the “Company”)
issued a press release announcing its financial results for the quarter and year ended December 31, 2024. The full text of the press
release issued in connection with the announcement is attached as Exhibit 99.1 to this Current Report on Form 8-K and is incorporated
herein by reference. A slide presentation, dated February 6, 2025, is attached as Exhibit 99.2 to this Current Report on Form 8-K
and is incorporated herein by reference. The slide presentation provides information that may be referred to by the Company on its conference
call with investors scheduled to occur on February 6, 2025, in connection with the Company’s release of results for the fiscal
year and fourth quarter 2024.
The information contained in Item 2.02 of this Current Report on Form 8-K
and Exhibits 99.1 and 99.2 attached hereto are being furnished and shall not be deemed “filed” for purposes of Section 18
of the Securities Exchange Act of 1934, as amended (the “Exchange Act”), or otherwise subject to the liabilities of that section,
nor shall they be deemed incorporated by reference in any filing under the Securities Act of 1933, as amended, or the Exchange Act, except
as expressly set forth by specific reference in such a filing.
Item 9.01 Financial Statements and Exhibits.
(d) Exhibits
SIGNATURE
Pursuant to the requirements of the Securities
Exchange Act of 1934, as amended, the Registrant has duly caused this report to be signed on its behalf by the undersigned, hereunto duly
authorized.
| |
OMNICELL, INC. |
| |
|
| Date: February 6, 2025 |
/s/ Nchacha E. Etta |
| |
Nchacha E. Etta, |
| |
Executive Vice President and Chief Financial Officer |
Exhibit 99.1

| Contact: |
|
|
| Kathleen Nemeth |
|
Omnicell, Inc. |
| Senior Vice President, Investor Relations |
|
4220 North Freeway |
| 650-435-3318 |
|
Fort Worth, TX 76137 |
| Kathleen.Nemeth@Omnicell.com |
|
|
Omnicell Announces Fiscal Year and Fourth Quarter
2024 Results
Omnicell delivers strong fourth quarter financial
results
Results exceed previously issued full year guidance
for bookings, total revenues, and non-GAAP EBITDA
FORT
WORTH, Texas. -- February 6, 2025 -- Omnicell, Inc. (NASDAQ:OMCL) (“Omnicell,” “we,” “our,”
“us,” “management,” or the “Company”), a leader in transforming the pharmacy and nursing care delivery
model, today announced results for its fiscal year and fourth quarter ended December 31, 2024.
“We delivered solid financial results for the fourth quarter
of 2024, including returning to year-over-year revenue growth. We are pleased with the improved execution of the business throughout 2024,
including strong free cash flows achieved in the year,” stated Randall Lipps, chairman, president, chief executive officer, and
founder of Omnicell. “As we progress through 2025, we remain focused on successfully executing on our strategic priorities, which
include driving long-term revenue growth, achieving consistent GAAP profitability, and continuing to raise the bar in medication management
and adherence through innovation and bringing new products and services to market.”
Financial Results
Total revenues for the fourth quarter of 2024 were $307 million, up
$48 million, or 19%, from the fourth quarter of 2023. The quarter-over-quarter increase in total revenues reflects the improvement of
the macroeconomic environment and the timing of implementation of XT Series systems, as well as continued growth in our SaaS and
Expert Services (formerly known as Advanced Services), including an increase in revenues from our Specialty Pharmacy Services offering.
Total revenues for the year ended December 31, 2024 were $1.112 billion, down $35 million, or 3%, from the year ended December 31,
2023. The year-over-year decrease in total revenues reflects the impact of a challenging environment through a significant portion of
2024 for some of our health system customers and the timing of our XT Series systems lifecycle, as we are largely through the replacement
cycle.
Total GAAP net income for the fourth quarter of 2024 was $16 million,
or $0.34 per diluted share. This compares to GAAP net loss of $14 million, or $0.32 per diluted share, for the fourth quarter of
2023. Total GAAP net income for the year ended December 31, 2024 was $13 million, or $0.27 per diluted share. This compares to GAAP
net loss of $20 million, or $0.45 per diluted share, for the year ended December 31, 2023.
Total non-GAAP net income for the fourth quarter of 2024 was $28 million,
or $0.60 per diluted share. This compares to non-GAAP net income of $15 million, or $0.33 per diluted share, for the fourth quarter of
2023. Total non-GAAP net income for the year ended December 31, 2024 was $79 million, or $1.71 per diluted share. This compares to
non-GAAP net income of $87 million, or $1.91 per diluted share, for the year ended December 31, 2023.
Total non-GAAP EBITDA for the fourth quarter of 2024 was $46 million.
This compares to non-GAAP EBITDA of $24 million for the fourth quarter of 2023. Total non-GAAP EBITDA for the year ended December 31,
2024 was $136 million. This compares to non-GAAP EBITDA of $138 million for the year ended December 31, 2023.
Bookings and Backlog - Historical Metric
Total bookings(1) for the year ended December 31,
2024 were $923 million compared to $854 million for the year ended December 31, 2023, or an increase of 8% year-over-year,
primarily driven by XT Series upgrades as we complete the XT Series upgrade cycle, as well as better than expected bookings
of XTExtend, a core component of the multi-year XT Amplify innovation program.
The chart below summarizes our total backlog (2) under
the definition of bookings in use for the years ended December 31, 2024 and 2023:
| | |
December 31, | |
| | |
2024 | | |
2023 | |
| | |
| | |
| |
| | |
| |
| | |
(In thousands) | |
| Total backlog | |
$ | 1,201,296 | | |
$ | 1,142,686 | |
| By type: | |
| | | |
| | |
| Product backlog | |
$ | 646,508 | | |
$ | 610,832 | |
| SaaS and Expert Services backlog (3) | |
$ | 554,788 | | |
$ | 531,854 | |
| By duration and type: | |
| | | |
| | |
| Short-term product backlog | |
$ | 447,412 | | |
$ | 377,936 | |
| Long-term product backlog | |
$ | 199,096 | | |
$ | 232,896 | |
| Short-term SaaS and Expert Services backlog (3) | |
$ | 93,113 | | |
$ | 72,455 | |
| Long-term SaaS and Expert Services backlog (3) | |
$ | 461,675 | | |
$ | 459,399 | |
| (1) | We utilize bookings as an indicator of the success of our business. During 2024, we defined bookings generally as: (i) the value
of non-cancelable contracts for our connected devices, software products, and SaaS and Expert Services (although, for those SaaS and Expert
Services contracts without a minimum commitment, bookings only include the amount of revenue that has been recognized once the services
have been provided); and (ii) for our consumables, the value of orders placed through our Omnicell Storefront online platform or
through written or telephonic orders. We typically exclude technical services and other less significant items ancillary to our products
and services, such as freight revenue, from bookings. In addition, dependent upon counterparty or credit risk, which is evaluated at the
time of contract signing, for a given multi-year subscription contract we may reduce the portion of the contractual commitment booked
at a given time. Connected devices and software license bookings are recorded as revenue upon customer acceptance of the installation
or receipt of goods. Revenues from SaaS and Expert Services bookings are recorded over the contractual term. |
| | |
| (2) | Backlog is the dollar amount of bookings that have not yet been recognized as revenue. Bookings for those SaaS and Expert Services
contracts without a minimum commitment are not included in backlog. In addition, dependent upon counterparty or credit risk, which is
evaluated at the time of contract signing, for a given multi-year subscription contract we may reduce the portion of the contractual commitment
booked at a given time, and these excluded amounts are not included in backlog. A majority of our connected devices and software license
products are installable and recognized as revenues within twelve months of booking, while service revenues from SaaS and Expert Services
are recorded over the contractual term. Larger or more complex implementations such as software-enabled connected devices for Central
Pharmacy, including but not limited to our Central Pharmacy Dispensing Service and IV Compounding Service, are often installed and recognized
as revenue between 12 and 24 months after booking. We consider backlog that is expected to be converted to revenues in more than twelve
months to be long-term backlog. We believe a majority of long-term product backlog will be convertible into revenues in 12 to 24 months.
Long-term SaaS and Expert Services backlog typically represents multi-year subscription agreements (usually with contractual terms of
2 to 7 years, some of which have not yet been implemented) that will be converted to revenue over the contractual term. Due to industry
practice that allows customers to change order configurations with limited advance notice prior to shipment and as customer installation
schedules may change, backlog as of any particular date may not necessarily indicate the timing of future revenue. However, we do believe
that backlog is an indication of a customer’s willingness to install our solutions and revenue we expect to generate over time. |
| (3) | Includes only the value of SaaS and Expert Services non-cancelable contracts with minimum commitments. |
Product Bookings, Product Backlog
and Annual Recurring Revenue - New Metrics
Starting in 2025, we will utilize product bookings(1) as
a key performance metric for our business. Under the new definition, product bookings as of December 31, 2024 were $558 million.
In addition, going forward, we will no longer be reporting SaaS and Expert Services backlog information, as these revenue streams will
be captured by the new Annual Recurring Revenue (“ARR”) metric, which we will begin utilizing as a key performance metric
for our business. For comparative purposes, the table below summarizes our product backlog and ARR for December 31, 2024 under the
new definitions of product bookings and ARR:
| | |
December 31, | |
| | |
2024 | |
| | |
| (In thousands) | |
| Total product backlog (2) | |
$ | 646,440 | |
| By duration: | |
| | |
| Short-term product backlog | |
$ | 447,344 | |
| Long-term product backlog | |
| 199,096 | |
| | |
| | |
| Annual Recurring Revenue(3) | |
$ | 580,025 | |
| (1) | We define product bookings generally as the value of non-cancelable contracts for our connected devices and software licenses. We
typically exclude freight revenue and other less significant items ancillary to our products from product bookings. In addition, dependent
upon counterparty or credit risk, which is evaluated at the time of contract signing, for a given multi-year subscription contract we
may reduce the value of the contractual commitment booked at a given time. Connected devices and software license bookings are recorded
as revenue upon customer acceptance of the installation or receipt of goods. We utilize product bookings as an indicator of the success
of certain portions of our business that generate non-recurring revenue. |
| (2) | Product backlog is the dollar amount of product bookings that have not yet been recognized as revenue. A majority of our connected
devices and software license products are installable and recognized as revenues within twelve months of booking. Larger or more complex
implementations such as software-enabled connected devices for Central Pharmacy, including, but not limited to, our Central Pharmacy Dispensing
Service and IV Compounding Service, are often installed and recognized as revenue between 12 and 24 months after booking. Due to industry
practice that allows customers to change order configurations with limited advance notice prior to shipment and as customer installation
schedules may change, backlog as of any particular date may not necessarily indicate the timing of future revenue. However, we do believe
that backlog is an indication of a customer’s willingness to install our solutions and revenue we expect to generate over time.
We consider backlog that is expected to be converted to revenues in more than twelve months to be long-term backlog. We believe a majority
of long-term product backlog will be convertible into revenues in 12-24 months. |
| (3) | We consider revenues generated from our consumables, technical services, and SaaS and Expert Services to be recurring revenues. For
the portions of our business which generate recurring revenues, we utilize ARR as a key metric to measure our progress in growing our
recurring revenue business. We define ARR at a measurement date as the revenue we expect to receive from our customers over the course
of the following year for providing them with products or services. ARR includes expected revenue from all customers who are using our
products or services at the reported date. For technical services and SaaS and Expert Services, solutions are generally on a contractual
basis, typically with contracts for a period of 12 months or more, with a high probability of renewal. Probability of renewal is based
on historic renewal experience of the individual revenue streams or management’s best estimates if historical renewal experience
is not available. Consumables orders are placed by customers through our Omnicell Storefront online platform or through written or telephonic
orders and are sold to a customer base who utilize the consumable product and place recurring orders when customer inventory is depleted.
ARR is generally calculated based on revenues received in the most recent quarter and changes to expected revenues where solutions were
added to or removed from the install or customer base in the quarter. Revenues from technical services and SaaS and Expert Services are
recorded ratably over the service term. Revenue from consumables are recorded when the product has shipped and title has passed. Our measure
of ARR may be different than that used by other companies. Because ARR is based on expected future revenue, it does not represent revenue
recognized during a particular reporting period or revenue to be recognized in future reporting periods. ARR should not be viewed as a
substitute for GAAP revenues. |
Balance Sheet
As of December 31, 2024, Omnicell’s balance sheet reflected
cash and cash equivalents of $369 million, total debt (net of unamortized debt issuance costs) of $341 million, and total assets of $2.12
billion. Cash flows provided by operating activities in the fourth quarter of 2024 totaled $56 million. This compares to cash flows provided
by operating activities totaling $38 million in the fourth quarter of 2023.
As of December 31, 2024, the Company had $350 million of availability
under its revolving credit facility with no outstanding balance.
Business Highlights
OmniSphere
The Company announced OmniSphere, a next-generation, cloud native,
software workflow engine and data platform that is intended to seamlessly integrate enterprise-wide robotics and smart devices to support
more secure, data-driven, medication management across the continuum of care. OmniSphere is designed to provide customers state-of-the-art
security, improved productivity, enterprise-wide visibility, and streamlined upgrades, that is meant to deliver optimal end-to-end medication
management.
ASHP Midyear
More than 1,600 pharmacy and industry leaders had the opportunity to
explore Omnicell’s portfolio of outcomes-centric solutions and learn best practices from peers as part of the American Society of
Health System Pharmacists (ASHP) Midyear 2024 Clinical Meeting and Exhibition. This annual event is the largest gathering of pharmacy
professionals in the world.
HITRUST Data Security Certification
Omnicell’s medication management solutions powered by the OmniCenter
platform once again received HITRUST Common Security Framework (CSF) certification, which we believe demonstrates the Company’s
ongoing commitment to high standards for cybersecurity and data protection within the organization and for business partners and customers.
Omnicell Issues New Convertible Senior Notes
In late November, Omnicell issued $172.5 million aggregate principal
amount of 1.00% convertible senior notes due 2029. In addition, Omnicell completed a partial repurchase of $400.0 million aggregate principal
amount of 0.25% convertible senior notes due 2025 for approximately $391.2 million in cash.
2025
Guidance
The
table below summarizes Omnicell’s first quarter and full year 2025 guidance:
| |
Q1 2025 |
|
2025 |
| Product Bookings (2025 Definition) |
Not provided |
|
$500 million - $550 million |
| ARR |
Not Provided |
|
$610 million - $630 million |
| Total Revenues |
$255 million - $265 million |
|
$1.105 billion - $1.155 billion |
| Product Revenues |
$137 million - $142 million |
|
$610 million - $640 million |
| Service Revenues |
$118 million - $123 million |
|
$495 million - $515 million |
| Technical Services Revenues |
Not provided |
|
$235 million - $245 million |
| SaaS and Expert Service Revenue (formerly Advanced Services) |
Not provided |
|
$260 million - $270 million |
| Non-GAAP EBITDA |
$19 million - $25 million |
|
$140 million - $155 million |
| Non-GAAP Earnings Per Share |
$0.15 - $0.25 |
|
$1.65 - $1.85 |
The Company does not provide guidance for GAAP net income or GAAP earnings
per share, nor a reconciliation of any forward-looking non-GAAP financial measures to the most directly comparable GAAP financial measures
on a forward-looking basis because it is unable to predict certain items contained in the GAAP measures without unreasonable efforts.
These forward-looking non-GAAP financial measures do not include certain items, which may be significant, including, but not limited to,
unusual gains and losses, costs associated with future restructurings, acquisition-related expenses, and certain tax and litigation outcomes.
Omnicell Conference Call Information
Omnicell will hold a conference call today, Thursday, February 6,
2025 at 8:30 a.m. ET to discuss fourth quarter and year end 2024 financial results. The conference call can be monitored by dialing
(800) 715-9871 in the U.S. or (646) 307-1963 in international locations. The Conference ID is 2515873. A link to the live and archived
webcast will also be available on the Investor Relations section of Omnicell’s website at https://ir.omnicell.com/events-and-presentations/.
About Omnicell
Since 1992, Omnicell has been committed to transforming pharmacy and
nursing care through outcomes-centric solutions designed to deliver clinical and business outcomes across all settings of care. Through
a comprehensive portfolio of robotics and smart devices, intelligent software workflows, and data and analytics, all optimized by expert
services, Omnicell solutions are helping healthcare facilities worldwide to uncover cost savings, improve labor efficiency, establish
new revenue streams, enhance supply chain control, support compliance, and move closer to the industry-defined vision of the Autonomous
Pharmacy. To learn more, visit omnicell.com.
From time to time, Omnicell may use the Company’s investor relations
website and other online social media channels, including its LinkedIn page www.linkedin.com/company/omnicell, and Facebook page www.facebook.com/omnicellinc,
to disclose material non-public information and comply with its disclosure obligations under Regulation Fair Disclosure (“Reg FD”).
OMNICELL, the Omnicell logo, and ENLIVENHEALTH are registered trademarks
of Omnicell, Inc. or one of its subsidiaries. This press release may also include the trademarks and service marks of other companies.
Such trademarks and service marks are the marks of their respective owners.
Forward-Looking Statements
To the extent any statements contained in this press release deal with
information that is not historical, these statements are “forward-looking statements” within the meaning of the Private Securities
Litigation Reform Act of 1995. Without limiting the foregoing, statements including the words “expect,” “intend,”
“may,” “will,” “should,” “would,” “could,” “plan,” “potential,”
“anticipate,” “believe,” “forecast,” “guidance,” “outlook,” “goals,”
“target,” “estimate,” “seek,” “predict,” “project,” and similar expressions
are intended to identify forward-looking statements. Forward-looking statements are subject to the occurrence of many events outside Omnicell’s
control. Such statements include, but are not limited to, Omnicell’s projected product bookings, revenues, including product, service,
technical services and SaaS and Expert Services revenues, annual recurring revenue, non-GAAP EBITDA, and non-GAAP earnings per share;
expectations regarding our products and services and developing new or enhancing existing products and solutions and the related objectives
and expected benefits (and any implied financial impact); our ability to drive long-term growth and consistent GAAP profitability; and
statements about Omnicell’s strategy, plans, objectives, promise and purpose, goals, opportunities, and market or Company outlook.
Actual results and other events may differ significantly from those contemplated by forward-looking statements due to numerous factors
that involve substantial known and unknown risks and uncertainties. These risks and uncertainties include, among other things, (i) unfavorable
general economic and market conditions, including the impact and duration of inflationary pressures, (ii) Omnicell’s ability
to take advantage of growth opportunities and develop and commercialize new solutions and enhance existing solutions, (iii) reduction
in demand in the capital equipment market or reduction in the demand for or adoption of our solutions, systems, or services, (iv) delays
in installations of our medication management solutions or our more complex medication packaging systems, (v) risks related to Omnicell’s
investments in new business strategies or initiatives, including its transition to selling more products and services on a subscription
basis, and its ability to acquire companies, businesses, or technologies and successfully integrate such acquisitions, (vi) ability
to realize the benefits of our expense containment initiatives, (vii) risks related to failing to maintain expected service levels
when providing our SaaS and Expert Services or retaining our SaaS and Expert Services customers, (viii) Omnicell’s ability
to meet the demands of, or maintain relationships with, its institutional, retail, and specialty pharmacy customers, (ix) risks related
to climate change, legal, regulatory or market measures to address climate change and related emphasis on ESG matters by various stakeholders,
(x) changes to the 340B Program, (xi) risks related to the incorporation of artificial intelligence technologies into our products,
services and processes or our vendors offerings, (xii) Omnicell’s substantial debt, which could impair its financial flexibility
and access to capital, (xiii) covenants in our credit agreement could restrict our business and operations, (xiv) continued
and increased competition from current and future competitors in the medication management automation solutions market and the medication
adherence solutions market, (xv) risks presented by government regulations, legislative changes, fraud and anti-kickback statues,
products liability claims, the outcome of legal proceedings, and other legal obligations related to healthcare, privacy, data protection,
and information security, and the costs of compliance with, and potential liability associated with, our actual or perceived failure to
comply with such obligations, including any potential governmental investigations and enforcement actions, litigation, fines and penalties,
exposure to indemnification obligations or other liabilities, and adverse publicity related to the same; (xvi) any disruption in
Omnicell’s information technology systems and breaches of data security or cyber-attacks on its systems or solutions, including
the previously disclosed ransomware incident and any potential adverse legal, reputational, and financial effects that may result from
it and/or additional cybersecurity incidents, as well as the effectiveness of business continuity plans during any future cybersecurity
incidents, (xvii) risks associated with operating in foreign countries, (xviii) Omnicell’s ability to recruit and retain
skilled and motivated personnel, (xix) Omnicell’s ability to protect its intellectual property, (xx) risks related to
the availability and sources of raw materials and components or price fluctuations, shortages, or interruptions of supply, (xxi) Omnicell’s
dependence on a limited number of suppliers for certain components, equipment, and raw materials, as well as technologies provided by
third-party vendors, (xxii) fluctuations in quarterly and annual operating results may make our future operating results difficult
to predict, (xxiii) failing to meet (or significantly exceeding) our publicly announced financial guidance, and (xxiv) other
risks and uncertainties further described in the “Risk Factors” section of Omnicell’s most recent Annual Report on Form 10-K,
as well as in Omnicell’s other reports filed with or furnished to the United States Securities and Exchange Commission (“SEC”),
available at www.sec.gov. Forward-looking statements should be considered in light of these risks and uncertainties. Investors and others
are cautioned not to place undue reliance on forward-looking statements. All forward-looking statements contained in this press release
speak only as of the date of this press release. Omnicell assumes no obligation to update any such statements publicly, or to update the
reasons actual results could differ materially from those expressed or implied in any forward-looking statements, whether as a result
of changed circumstances, new information, future events, or otherwise, except as required by law.
Use of Non-GAAP Financial Information
This press release contains financial measures that are not calculated
in accordance with U.S. Generally Accepted Accounting Principles (“GAAP”). Management evaluates and makes operating decisions
using various performance measures. In addition to Omnicell’s GAAP results, we also consider non-GAAP gross profit, non-GAAP gross
margin, non-GAAP operating expenses, non-GAAP income from operations, non-GAAP operating margin, non-GAAP net income, non-GAAP net income
per diluted share, non-GAAP diluted shares, non-GAAP EBITDA, non-GAAP EBITDA margin, and non-GAAP free cash flow. These non-GAAP results
and metrics should not be considered as an alternative to revenues, gross profit, operating expenses, income from operations, net income,
net income per diluted share, diluted shares, net cash provided by operating activities, or any other performance measure derived in accordance
with GAAP. We present these non-GAAP results and metrics because management considers them to be important supplemental measures of Omnicell’s
performance and refers to such measures when analyzing Omnicell’s strategy and operations.
Our non-GAAP gross profit, non-GAAP gross margin, non-GAAP operating
expenses, non-GAAP income from operations, non-GAAP operating margin, non-GAAP net income, non-GAAP net income per diluted share, non-GAAP
EBITDA, and non-GAAP EBITDA margin are exclusive of certain items to facilitate management’s review of the comparability of Omnicell’s
core operating results on a period-to-period basis because such items are not related to Omnicell’s ongoing core operating results
as viewed by management. We define our “core operating results” as those revenues recorded in a particular period and the
expenses incurred within such period that directly drive operating income in such period. Management uses these non-GAAP financial measures
in making operating decisions because, in addition to meaningful supplemental information regarding operating performance, the measures
give us a better understanding of how we believe we should invest in research and development, fund infrastructure growth, and evaluate
the effectiveness of marketing strategies. In calculating the above non-GAAP results: non-GAAP gross profit and non-GAAP gross margin
exclude from their GAAP equivalents items a), b), e), and g) below; non-GAAP operating expenses excludes from its GAAP equivalents items
a), b), c), d), e), g), h), i), j) and k) below; non-GAAP income from operations and non-GAAP operating margin exclude from their GAAP
equivalents items a), b), c), d), e), g), h),i), j) and k) below; and non-GAAP net income and non-GAAP net income per diluted share exclude
from their GAAP equivalents items a) through l) below. Non-GAAP EBITDA is defined as earnings before interest income and expense, taxes,
depreciation, amortization, and share-based compensation, as well as excluding certain other non-GAAP adjustments. Non-GAAP EBITDA and
non-GAAP EBITDA margin exclude from their GAAP equivalents items a), c), d), e), f), g), h), i), j), k) and l) below:
| a) | Share-based compensation expense. We excluded from our non-GAAP results the expense related to equity-based compensation
plans as it represents expenses that do not require cash settlement from Omnicell. |
| b) | Amortization of acquired intangible assets. We excluded from our non-GAAP results the intangible assets amortization expense
resulting from our past acquisitions. These non-cash charges are not considered by management to reflect the core cash-generating performance
of the business and therefore are excluded from our non-GAAP results. |
| c) | Acquisition-related expenses. We excluded from our non-GAAP results the expenses related to recent acquisitions, including
amortization of representations and warranties insurance. These expenses are unrelated to our ongoing operations, vary in size and frequency,
and are subject to significant fluctuations from period to period due to varying levels of acquisition activity. We believe that excluding
these expenses provides more meaningful comparisons of the financial results to our historical operations and forward-looking guidance,
and to the financial results of peer companies. |
| d) | Impairment and abandonment of operating lease right-of-use and other assets related to facilities. We excluded from our non-GAAP
results the impairment and abandonment of certain operating lease right-of-use assets, as well as property and equipment, incurred in
connection with restructuring activities for optimization of certain leased facilities. These non-cash charges are not considered by management
to reflect the core cash-generating performance of the business and therefore are excluded from our non-GAAP results. |
| e) | Severance-related expenses. We excluded from our non-GAAP results the expenses related to restructuring events, partially offset
by reversals of previously recognized severance expenses in subsequent periods. These expenses are unrelated to our ongoing operations,
vary in size and frequency, and are subject to significant fluctuations from period to period due to varying levels of restructuring activity.
We believe that excluding these expenses provides more meaningful comparisons of the financial results to our historical operations and
forward-looking guidance, and to the financial results of peer companies. |
| f) | Amortization of debt issuance costs. Debt issuance costs represent costs associated with the issuance of revolving credit
facilities and convertible senior notes. The costs include underwriting fees, original issue discount, ticking fees, and legal fees. These
non-cash expenses are not considered by management to reflect the core cash-generating performance of the business and therefore are excluded
from our non-GAAP results. |
| g) | RDS restructuring. We excluded from our non-GAAP results the nonrecurring restructuring charges related to the wind down of
the Company’s Medimat Robotic Dispensing System (“RDS”) product line, partially offset by reversals of previously recognized
expenses in subsequent periods. For the period ended December 31, 2024, those charges consisted primarily of inventory write-down,
severance and other related expenses. These expenses are unrelated to our ongoing operations and we believe that excluding these expenses
provides more meaningful comparisons of the financial results to our historical operations and forward-looking guidance, and to the financial
results of peer companies. |
| h) | Executives transition costs. We excluded from our non-GAAP results the executives transition costs associated with the departure
of certain executive officers, primarily consisting of severance expenses. These expenses are unrelated to our ongoing operations and
we do not expect them to occur in the ordinary course of business. We believe that excluding these expenses provides more meaningful comparisons
of the financial results to our historical operations and forward-looking guidance, and to the financial results of peer companies. |
| i) | Ransomware-related insurance recoveries. We excluded from our non-GAAP results the insurance recoveries related to the previously
disclosed ransomware incident identified by the Company on May 4, 2022. These recoveries are unrelated to our ongoing operations
and would not have otherwise been received by us in the normal course of business. We believe that excluding these recoveries provides
more meaningful comparisons of the financial results to our historical operations and forward-looking guidance, and to the financial results
of peer companies. |
| j) | Legal and regulatory expenses. We excluded from our non-GAAP results certain non-recurring legal and regulatory expenses, representing
potential settlement amounts, related to certain claims of non-compliance with our government contracts that are outside of the ordinary
course of our business. We believe that excluding these amounts provides more meaningful comparisons of the financial results to our historical
operations and forward-looking guidance, and to the financial results of peer companies. |
| k) | Management severance costs. We excluded from our non-GAAP results the severance expense of certain senior management associated
with the restructuring of our senior leadership team. We believe that excluding these expenses provides more meaningful comparisons of
the financial results to our historical operations and forward-looking guidance, and to the financial results of peer companies. |
| l) | Gain on extinguishment of convertible senior notes, net. We excluded from our non-GAAP results the gain on the partial repurchase
of the Company’s Senior Convertible Notes due 2025 as well as the related unwinding of the convertible note hedge and warrants.
We believe that excluding this gain provides more meaningful comparisons of the financial results to our historical operations and forward-looking
guidance, and to the financial results of peer companies. |
Management adjusts for the above items because management believes
that, in general, these items possess one or more of the following characteristics: their magnitude and timing is largely outside of Omnicell’s
control; they are unrelated to the ongoing operation of the business in the ordinary course; they are unusual and we do not expect them
to occur in the ordinary course of business; or they are non-operational or non-cash expenses involving stock compensation plans or other
items.
We believe that the presentation of non-GAAP gross profit, non-GAAP
gross margin, non-GAAP operating expenses, non-GAAP income from operations, non-GAAP operating margin, non-GAAP net income, non-GAAP net
income per diluted share, non-GAAP EBITDA, and non-GAAP EBITDA margin is warranted for several reasons:
| a) | Such non-GAAP financial measures provide an additional analytical tool for understanding Omnicell’s financial performance by
excluding the impact of items which may obscure trends in the core operating results of the business. |
| b) | Since we have historically reported non-GAAP results to the investment community, we believe the inclusion of non-GAAP numbers provides
consistency and enhances investors’ ability to compare our performance across financial reporting periods. |
| c) | These non-GAAP financial measures are employed by management in its own evaluation of performance and are utilized in financial and
operational decision-making processes, such as budget planning and forecasting. |
| d) | These non-GAAP financial measures facilitate comparisons to the operating results of other companies in our industry, which also use
non-GAAP financial measures to supplement their GAAP results (although these companies may calculate non-GAAP financial measures differently
than Omnicell does), thus enhancing the perspective of investors who wish to utilize such comparisons in their analysis of our performance. |
Set forth below are additional reasons why share-based compensation
expense is excluded from our non-GAAP financial measures:
| i) | While share-based compensation calculated in accordance with Accounting Standards Codification (“ASC”) 718 constitutes
an ongoing and recurring expense of Omnicell, it is not an expense that requires cash settlement by Omnicell. We therefore exclude these
charges for purposes of evaluating core operating results. Thus, our non-GAAP measurements are presented exclusive of share-based compensation
expense to assist management and investors in evaluating our core operating results. |
| ii) | We present ASC 718 share-based payment compensation expense in our reconciliation of non-GAAP financial measures on a pre-tax basis
because the exact tax differences related to the timing and deductibility of share-based compensation under ASC 718 are dependent
upon the trading price of Omnicell’s common stock and the timing and exercise by employees of their stock options. As a result
of these timing and market uncertainties, the tax effect related to share-based compensation expense would be inconsistent in amount and
frequency and is therefore excluded from our non-GAAP results. |
Non-GAAP diluted shares is defined as our GAAP diluted shares, excluding
the impact of dilutive convertible senior notes for which the Company is economically hedged through its anti-dilutive convertible note
hedge transaction. We believe non-GAAP diluted shares is a useful non-GAAP metric because it provides insight into the offsetting economic
effect of the hedge transaction against potential conversion of the convertible senior notes.
Non-GAAP free cash flow is defined as net cash provided by operating
activities less cash used for software development for external use and purchases of property and equipment. We believe free cash flow
is important to enable investors to better understand and evaluate our ongoing operating results and allows for greater transparency in
the review and understanding of our overall financial, operational, and economic performance, because free cash flow takes into account
certain capital expenditures and cash used for software development necessary to operate our business.
As stated above, we present non-GAAP financial measures because we
consider them to be important supplemental measures of performance. However, non-GAAP financial measures have limitations as an analytical
tool and should not be considered in isolation or as a substitute for Omnicell’s GAAP results. In the future, we expect to incur
expenses similar to certain of the non-GAAP adjustments described above and expect to continue reporting non-GAAP financial measures excluding
such items. Some of the limitations in relying on non-GAAP financial measures are:
| a) | Omnicell’s equity incentive plans and stock purchase plans are important components of incentive compensation arrangements and
will be reflected as expenses in Omnicell’s GAAP results for the foreseeable future under ASC 718. |
| b) | Other companies, including companies in Omnicell’s industry, may calculate non-GAAP financial measures differently than Omnicell,
limiting their usefulness as a comparative measure. |
| c) | A limitation of the utility of free cash flow as a measure of financial performance is that it does not represent the total increase
or decrease in Omnicell’s cash balance for the period. |
A detailed reconciliation between Omnicell’s non-GAAP and GAAP
financial results is set forth in the financial tables at the end of this press release. Investors are advised to carefully review and
consider this information strictly as a supplement to the GAAP results that are contained in this press release as well as in Omnicell’s
other reports filed with or furnished to the SEC.
Omnicell, Inc.
Condensed Consolidated Statements of Operations
(Unaudited, in thousands, except per share data)
| | |
Three Months Ended
December 31, | | |
Year Ended December 31, | |
| | |
2024 | | |
2023 | | |
2024 | | |
2023 | |
| Revenues: | |
| | | |
| | | |
| | | |
| | |
| Product revenues | |
$ | 182,271 | | |
$ | 145,655 | | |
$ | 630,507 | | |
$ | 708,561 | |
| Service revenues | |
| 124,608 | | |
| 113,192 | | |
| 481,731 | | |
| 438,551 | |
| Total revenues | |
| 306,879 | | |
| 258,847 | | |
| 1,112,238 | | |
| 1,147,112 | |
| Cost of revenues: | |
| | | |
| | | |
| | | |
| | |
| Cost of product revenues | |
| 96,755 | | |
| 90,306 | | |
| 383,025 | | |
| 414,106 | |
| Cost of service revenues | |
| 68,363 | | |
| 63,137 | | |
| 258,210 | | |
| 236,166 | |
| Total cost of revenues | |
| 165,118 | | |
| 153,443 | | |
| 641,235 | | |
| 650,272 | |
| Gross profit | |
| 141,761 | | |
| 105,404 | | |
| 471,003 | | |
| 496,840 | |
| Operating expenses: | |
| | | |
| | | |
| | | |
| | |
| Research and development | |
| 26,040 | | |
| 26,819 | | |
| 90,412 | | |
| 97,115 | |
| Selling, general, and administrative | |
| 103,325 | | |
| 101,950 | | |
| 380,254 | | |
| 434,593 | |
| Total operating expenses | |
| 129,365 | | |
| 128,769 | | |
| 470,666 | | |
| 531,708 | |
| Income (loss) from operations | |
| 12,396 | | |
| (23,365 | ) | |
| 337 | | |
| (34,868 | ) |
| Interest and other income (expense), net | |
| 11,204 | | |
| 4,848 | | |
| 25,256 | | |
| 14,760 | |
| Income (loss) before income taxes | |
| 23,600 | | |
| (18,517 | ) | |
| 25,593 | | |
| (20,108 | ) |
| Provision for (benefit from) income taxes | |
| 7,758 | | |
| (4,142 | ) | |
| 13,062 | | |
| 263 | |
| Net income (loss) | |
$ | 15,842 | | |
$ | (14,375 | ) | |
$ | 12,531 | | |
$ | (20,371 | ) |
| Net income (loss) per share: | |
| | | |
| | | |
| | | |
| | |
| Basic | |
$ | 0.34 | | |
$ | (0.32 | ) | |
$ | 0.27 | | |
$ | (0.45 | ) |
| Diluted | |
$ | 0.34 | | |
$ | (0.32 | ) | |
$ | 0.27 | | |
$ | (0.45 | ) |
| Weighted-average shares outstanding: | |
| | | |
| | | |
| | | |
| | |
| Basic | |
| 46,345 | | |
| 45,495 | | |
| 46,047 | | |
| 45,212 | |
| Diluted | |
| 46,854 | | |
| 45,495 | | |
| 46,255 | | |
| 45,212 | |
Omnicell, Inc.
Condensed Consolidated Balance Sheets
(Unaudited, in thousands)
| | |
December 31, | |
| | |
2024 | | |
2023 | |
| ASSETS |
| Current assets: | |
| | | |
| | |
| Cash and cash equivalents | |
$ | 369,201 | | |
$ | 467,972 | |
| Accounts receivable and unbilled receivables, net | |
| 256,398 | | |
| 252,025 | |
| Inventories | |
| 88,659 | | |
| 110,099 | |
| Prepaid expenses | |
| 25,942 | | |
| 25,966 | |
| Other current assets | |
| 75,293 | | |
| 71,509 | |
| Total current assets | |
| 815,493 | | |
| 927,571 | |
| Property and equipment, net | |
| 112,692 | | |
| 108,601 | |
| Long-term investment in sales-type leases, net | |
| 52,744 | | |
| 42,954 | |
| Operating lease right-of-use assets | |
| 25,607 | | |
| 24,988 | |
| Goodwill | |
| 734,727 | | |
| 735,810 | |
| Intangible assets, net | |
| 188,266 | | |
| 211,173 | |
| Long-term deferred tax assets | |
| 57,469 | | |
| 32,901 | |
| Prepaid commissions | |
| 54,656 | | |
| 52,414 | |
| Other long-term assets | |
| 79,306 | | |
| 90,466 | |
| Total assets | |
$ | 2,120,960 | | |
$ | 2,226,878 | |
| | |
| | | |
| | |
| LIABILITIES AND STOCKHOLDERS’ EQUITY | |
| | | |
| | |
| Current liabilities: | |
| | | |
| | |
| Accounts payable | |
$ | 51,782 | | |
$ | 45,028 | |
| Accrued compensation | |
| 60,307 | | |
| 51,754 | |
| Accrued liabilities | |
| 167,895 | | |
| 149,276 | |
| Deferred revenues | |
| 141,370 | | |
| 121,734 | |
| Convertible senior notes, net | |
| 174,324 | | |
| — | |
| Total current liabilities | |
| 595,678 | | |
| 367,792 | |
| Long-term deferred revenues | |
| 76,123 | | |
| 58,622 | |
| Long-term deferred tax liabilities | |
| 1,108 | | |
| 1,620 | |
| Long-term operating lease liabilities | |
| 31,123 | | |
| 33,910 | |
| Other long-term liabilities | |
| 7,218 | | |
| 6,318 | |
| Convertible senior notes, net | |
| 166,397 | | |
| 569,662 | |
| Total liabilities | |
| 877,647 | | |
| 1,037,924 | |
| Total stockholders’ equity | |
| 1,243,313 | | |
| 1,188,954 | |
| Total liabilities and stockholders’ equity | |
$ | 2,120,960 | | |
$ | 2,226,878 | |
Omnicell, Inc.
Condensed Consolidated Statements of Cash Flows
(Unaudited, in thousands)
| | |
Year Ended December 31, | |
| | |
2024 | | |
2023 | |
| Operating Activities | |
| | | |
| | |
| Net income (loss) | |
$ | 12,531 | | |
$ | (20,371 | ) |
| Adjustments to reconcile net income (loss) to net cash provided by operating activities: | |
| | | |
| | |
| Depreciation and amortization | |
| 82,232 | | |
| 87,319 | |
| Loss on disposal of assets | |
| 978 | | |
| 2,572 | |
| Share-based compensation expense | |
| 39,316 | | |
| 55,300 | |
| Deferred income taxes | |
| (14,855 | ) | |
| (11,047 | ) |
| Amortization of operating lease right-of-use assets | |
| 7,523 | | |
| 8,239 | |
| Impairment and abandonment of operating lease right-of-use assets related to facilities | |
| — | | |
| 9,998 | |
| Inventory write-down | |
| 5,393 | | |
| — | |
| Impairment of certain long-lived assets | |
| — | | |
| 1,014 | |
| Amortization of debt issuance costs | |
| 3,788 | | |
| 4,397 | |
| Gain on extinguishment of convertible senior notes, net | |
| (7,517 | ) | |
| — | |
| Changes in operating assets and liabilities: | |
| | | |
| | |
| Accounts receivable and unbilled receivables | |
| (5,002 | ) | |
| 49,150 | |
| Inventories | |
| 15,633 | | |
| 38,016 | |
| Prepaid expenses | |
| 24 | | |
| 1,149 | |
| Other current assets | |
| 9,337 | | |
| (6,821 | ) |
| Investment in sales-type leases | |
| (10,398 | ) | |
| (10,411 | ) |
| Prepaid commissions | |
| (2,242 | ) | |
| 7,069 | |
| Other long-term assets | |
| 2,161 | | |
| 2,111 | |
| Accounts payable | |
| 7,210 | | |
| (17,525 | ) |
| Accrued compensation | |
| 8,553 | | |
| (21,461 | ) |
| Accrued liabilities | |
| 13,942 | | |
| (10,343 | ) |
| Deferred revenues | |
| 28,952 | | |
| 24,058 | |
| Operating lease liabilities | |
| (10,737 | ) | |
| (10,918 | ) |
| Other long-term liabilities | |
| 900 | | |
| (401 | ) |
| Net cash provided by operating activities | |
| 187,722 | | |
| 181,094 | |
| Investing Activities | |
| | | |
| | |
| External-use software development costs | |
| (16,330 | ) | |
| (13,542 | ) |
| Purchases of property and equipment | |
| (36,463 | ) | |
| (41,474 | ) |
| Net cash used in investing activities | |
| (52,793 | ) | |
| (55,016 | ) |
| Financing Activities | |
| | | |
| | |
| Payments for debt issuance costs for revolving credit facility | |
| — | | |
| (2,967 | ) |
| Proceeds from issuance of convertible senior notes, net of issuance costs | |
| 166,272 | | |
| — | |
| Partial repurchase of convertible senior notes | |
| (391,000 | ) | |
| — | |
| Purchase of convertible note hedge | |
| (40,279 | ) | |
| — | |
| Proceeds from sale of warrants | |
| 25,168 | | |
| — | |
| Partial unwind of convertible note hedge and warrants | |
| (727 | ) | |
| — | |
| Proceeds from issuances under stock-based compensation plans | |
| 13,411 | | |
| 23,216 | |
| Employees’ taxes paid related to restricted stock units | |
| (4,827 | ) | |
| (7,366 | ) |
| Change in customer funds, net | |
| (3,596 | ) | |
| 10,537 | |
| Net cash provided by (used in) financing activities | |
| (235,578 | ) | |
| 23,420 | |
| Effect of exchange rate changes on cash and cash equivalents | |
| (1,716 | ) | |
| (1,354 | ) |
| Net increase (decrease) in cash, cash equivalents, and restricted cash | |
| (102,365 | ) | |
| 148,144 | |
| Cash, cash equivalents, and restricted cash at beginning of period | |
| 500,979 | | |
| 352,835 | |
| Cash, cash equivalents, and restricted cash at end of period | |
$ | 398,614 | | |
$ | 500,979 | |
| Reconciliation of cash, cash equivalents, and restricted cash to the Condensed Consolidated Balance Sheets: | |
| | | |
| | |
| Cash and cash equivalents | |
$ | 369,201 | | |
$ | 467,972 | |
| Restricted cash included in other current assets | |
| 29,413 | | |
| 33,007 | |
| Cash, cash equivalents, and restricted cash at end of period | |
$ | 398,614 | | |
$ | 500,979 | |
Omnicell, Inc.
Reconciliation of GAAP to Non-GAAP
(Unaudited, in thousands, except per share data
and percentage)
| | |
Three
Months Ended December 31, | | |
Year Ended December 31, | |
| | |
2024 | | |
2023 | | |
2024 | | |
2023 | |
| Reconciliation of GAAP gross profit to non-GAAP gross profit: | |
| | |
| | |
| | |
| |
| GAAP gross profit | |
$ | 141,761 | | |
$ | 105,404 | | |
$ | 471,003 | | |
$ | 496,840 | |
| GAAP gross margin | |
| 46.2 | % | |
| 40.7 | % | |
| 42.3 | % | |
| 43.3 | % |
| Share-based compensation expense | |
| 1,489 | | |
| 1,799 | | |
| 6,373 | | |
| 8,288 | |
| Amortization of acquired intangibles | |
| 1,017 | | |
| 2,607 | | |
| 4,131 | | |
| 11,165 | |
| RDS restructuring, net of reversals | |
| 1,211 | | |
| — | | |
| 9,897 | | |
| — | |
| Severance-related expenses, net of reversals | |
| — | | |
| 2,987 | | |
| — | | |
| 3,089 | |
| Non-GAAP gross profit | |
$ | 145,478 | | |
$ | 112,797 | | |
$ | 491,404 | | |
$ | 519,382 | |
| Non-GAAP gross margin | |
| 47.4 | % | |
| 43.6 | % | |
| 44.2 | % | |
| 45.3 | % |
| | |
| | | |
| | | |
| | | |
| | |
| Reconciliation of GAAP operating expenses to non-GAAP operating expenses: | |
| | | |
| | | |
| | | |
| | |
| GAAP operating expenses | |
$ | 129,365 | | |
$ | 128,769 | | |
$ | 470,666 | | |
$ | 531,708 | |
| GAAP operating expenses % to total revenues | |
| 42.2 | % | |
| 49.7 | % | |
| 42.3 | % | |
| 46.4 | % |
| Share-based compensation expense | |
| (7,550 | ) | |
| (10,388 | ) | |
| (32,943 | ) | |
| (47,012 | ) |
| Amortization of acquired intangibles | |
| (4,480 | ) | |
| (5,007 | ) | |
| (18,578 | ) | |
| (20,409 | ) |
| Acquisition-related expenses | |
| (182 | ) | |
| (244 | ) | |
| (898 | ) | |
| (982 | ) |
| Impairment and abandonment of operating lease right-of-use and other assets related to facilities (a) | |
| — | | |
| (1,587 | ) | |
| — | | |
| (10,007 | ) |
| RDS restructuring, net of reversals | |
| (1,223 | ) | |
| (1,610 | ) | |
| (2,056 | ) | |
| (1,610 | ) |
| Ransomware-related insurance recoveries | |
| — | | |
| 624 | | |
| — | | |
| 808 | |
| Legal and regulatory expenses | |
| (2,000 | ) | |
| — | | |
| (2,000 | ) | |
| — | |
| Management severance costs | |
| (911 | ) | |
| — | | |
| (911 | ) | |
| — | |
| Executives transition costs | |
| — | | |
| — | | |
| — | | |
| (2,189 | ) |
| Severance-related expenses, net of reversals | |
| — | | |
| (7,098 | ) | |
| — | | |
| (12,450 | ) |
| Non-GAAP operating expenses | |
$ | 113,019 | | |
$ | 103,459 | | |
$ | 413,280 | | |
$ | 437,857 | |
| Non-GAAP operating expenses as a % of total revenues | |
| 36.8 | % | |
| 40.0 | % | |
| 37.2 | % | |
| 38.2 | % |
| | |
| | | |
| | | |
| | | |
| | |
| Reconciliation of GAAP income (loss) from operations to non-GAAP income from operations: | |
| | | |
| | | |
| | | |
| | |
| GAAP income (loss) from operations | |
$ | 12,396 | | |
$ | (23,365 | ) | |
$ | 337 | | |
$ | (34,868 | ) |
| GAAP operating income (loss) % to total revenues | |
| 4.0 | % | |
| (9.0 | )% | |
| 0.0 | % | |
| (3.0 | )% |
| Share-based compensation expense | |
| 9,039 | | |
| 12,187 | | |
| 39,316 | | |
| 55,300 | |
| Amortization of acquired intangibles | |
| 5,497 | | |
| 7,614 | | |
| 22,709 | | |
| 31,574 | |
| Acquisition-related expenses | |
| 182 | | |
| 244 | | |
| 898 | | |
| 982 | |
| Impairment and abandonment of operating lease right-of-use and other assets related to facilities (a) | |
| — | | |
| 1,587 | | |
| — | | |
| 10,007 | |
| RDS restructuring, net of reversals | |
| 2,434 | | |
| 1,610 | | |
| 11,953 | | |
| 1,610 | |
| Ransomware-related insurance recoveries | |
| — | | |
| (624 | ) | |
| — | | |
| (808 | ) |
| Legal and regulatory expenses | |
| 2,000 | | |
| — | | |
| 2,000 | | |
| — | |
| Management severance costs | |
| 911 | | |
| — | | |
| 911 | | |
| — | |
| Executives transition costs | |
| — | | |
| — | | |
| — | | |
| 2,189 | |
| Severance-related expenses, net of reversals | |
| — | | |
| 10,085 | | |
| — | | |
| 15,539 | |
| Non-GAAP income from operations | |
$ | 32,459 | | |
$ | 9,338 | | |
$ | 78,124 | | |
$ | 81,525 | |
| Non-GAAP operating margin (non-GAAP operating income as a % of total revenues) | |
| 10.6 | % | |
| 3.6 | % | |
| 7.0 | % | |
| 7.1 | % |
Omnicell, Inc.
Reconciliation of GAAP to Non-GAAP
(Unaudited, in thousands, except per share data
and percentage)
| | |
Three Months Ended December 31, | | |
Year Ended December 31, | |
| | |
2024 | | |
2023 | | |
2024 | | |
2023 | |
| Reconciliation of GAAP net income (loss) to non-GAAP net income: | |
| | |
| | |
| |
| GAAP net income (loss) | |
$ | 15,842 | | |
$ | (14,375 | ) | |
$ | 12,531 | | |
$ | (20,371 | ) |
| Share-based compensation expense | |
| 9,039 | | |
| 12,187 | | |
| 39,316 | | |
| 55,300 | |
| Amortization of acquired intangibles | |
| 5,497 | | |
| 7,614 | | |
| 22,709 | | |
| 31,574 | |
| Acquisition-related expenses | |
| 182 | | |
| 244 | | |
| 898 | | |
| 982 | |
| Impairment and abandonment of operating lease right-of-use and other assets related to facilities (a) | |
| — | | |
| 1,587 | | |
| — | | |
| 10,007 | |
| RDS restructuring, net of reversals | |
| 2,434 | | |
| 1,610 | | |
| 11,953 | | |
| 1,610 | |
| Ransomware-related insurance recoveries | |
| — | | |
| (624 | ) | |
| — | | |
| (808 | ) |
| Legal and regulatory expenses | |
| 2,000 | | |
| — | | |
| 2,000 | | |
| — | |
| Management severance costs | |
| 911 | | |
| — | | |
| 911 | | |
| — | |
| Executives transition costs | |
| — | | |
| — | | |
| — | | |
| 2,189 | |
| Severance-related expenses, net of reversals | |
| — | | |
| 10,085 | | |
| — | | |
| 15,539 | |
| Amortization of debt issuance costs | |
| 871 | | |
| 1,258 | | |
| 3,788 | | |
| 4,397 | |
| Gain on extinguishment of convertible senior notes, net | |
| (7,517 | ) | |
| — | | |
| (7,517 | ) | |
| — | |
| Tax effect of the adjustments above (b) | |
| (919 | ) | |
| (4,573 | ) | |
| (7,295 | ) | |
| (13,754 | ) |
| Non-GAAP net income | |
$ | 28,340 | | |
$ | 15,013 | | |
$ | 79,294 | | |
$ | 86,665 | |
| | |
| | | |
| | | |
| | | |
| | |
| Reconciliation of GAAP net income (loss) per share - diluted to non-GAAP net income per share - diluted: | |
| | | |
| | | |
| | | |
| | |
| Shares - diluted GAAP | |
| 46,854 | | |
| 45,495 | | |
| 46,255 | | |
| 45,212 | |
| Shares - diluted non-GAAP | |
| 46,854 | | |
| 45,532 | | |
| 46,255 | | |
| 45,439 | |
| | |
| | | |
| | | |
| | | |
| | |
| GAAP net income (loss) per share - diluted | |
$ | 0.34 | | |
$ | (0.32 | ) | |
$ | 0.27 | | |
$ | (0.45 | ) |
| Share-based compensation expense | |
| 0.19 | | |
| 0.26 | | |
| 0.85 | | |
| 1.22 | |
| Amortization of acquired intangibles | |
| 0.12 | | |
| 0.17 | | |
| 0.49 | | |
| 0.69 | |
| Acquisition-related expenses | |
| 0.00 | | |
| 0.01 | | |
| 0.02 | | |
| 0.02 | |
| Impairment and abandonment of operating lease right-of-use and other assets related to facilities (a) | |
| — | | |
| 0.03 | | |
| — | | |
| 0.22 | |
| RDS restructuring, net of reversals | |
| 0.05 | | |
| 0.04 | | |
| 0.26 | | |
| 0.04 | |
| Ransomware-related insurance recoveries | |
| — | | |
| (0.01 | ) | |
| — | | |
| (0.02 | ) |
| Legal and regulatory expenses | |
| 0.04 | | |
| — | | |
| 0.04 | | |
| — | |
| Management severance costs | |
| 0.02 | | |
| — | | |
| 0.02 | | |
| — | |
| Executives transition costs | |
| — | | |
| — | | |
| — | | |
| 0.05 | |
| Severance-related expenses, net of reversals | |
| — | | |
| 0.22 | | |
| — | | |
| 0.34 | |
| Amortization of debt issuance costs | |
| 0.02 | | |
| 0.03 | | |
| 0.08 | | |
| 0.10 | |
| Gain on extinguishment of convertible senior notes, net | |
| (0.16 | ) | |
| — | | |
| (0.16 | ) | |
| — | |
| Tax effect of the adjustments above (b) | |
| (0.02 | ) | |
| (0.10 | ) | |
| (0.16 | ) | |
| (0.30 | ) |
| Non-GAAP net income per share - diluted | |
$ | 0.60 | | |
$ | 0.33 | | |
$ | 1.71 | | |
$ | 1.91 | |
Omnicell, Inc.
Reconciliation of GAAP to Non-GAAP
(Unaudited, in thousands, except per share data
and percentage)
| | |
Three
Months Ended December 31, | | |
Year Ended December 31, | |
| | |
2024 | | |
2023 | | |
2024 | | |
2023 | |
| Reconciliation of GAAP net income (loss) to non-GAAP EBITDA (c): | |
| | |
| | |
| |
| GAAP net income (loss) | |
$ | 15,842 | | |
$ | (14,375 | ) | |
$ | 12,531 | | |
$ | (20,371 | ) |
| Share-based compensation expense | |
| 9,039 | | |
| 12,187 | | |
| 39,316 | | |
| 55,300 | |
| Interest (income) and expense, net | |
| (5,062 | ) | |
| (5,811 | ) | |
| (23,399 | ) | |
| (18,542 | ) |
| Depreciation and amortization expense | |
| 19,966 | | |
| 21,723 | | |
| 82,232 | | |
| 87,319 | |
| Acquisition-related expenses | |
| 182 | | |
| 244 | | |
| 898 | | |
| 982 | |
| Impairment and abandonment of operating lease right-of-use and other assets related to facilities (a) | |
| — | | |
| 1,587 | | |
| — | | |
| 10,007 | |
| RDS restructuring, net of reversals | |
| 2,434 | | |
| 1,610 | | |
| 11,953 | | |
| 1,610 | |
| Ransomware-related insurance recoveries | |
| — | | |
| (624 | ) | |
| — | | |
| (808 | ) |
| Legal and regulatory expenses | |
| 2,000 | | |
| — | | |
| 2,000 | | |
| — | |
| Management severance costs | |
| 911 | | |
| — | | |
| 911 | | |
| — | |
| Executives transition costs | |
| — | | |
| — | | |
| — | | |
| 2,189 | |
| Severance-related expenses, net of reversals | |
| — | | |
| 10,085 | | |
| — | | |
| 15,539 | |
| Amortization of debt issuance costs | |
| 871 | | |
| 1,258 | | |
| 3,788 | | |
| 4,397 | |
| Gain on extinguishment of convertible senior notes, net | |
| (7,517 | ) | |
| — | | |
| (7,517 | ) | |
| — | |
| Provision for (benefit from) income taxes | |
| 7,758 | | |
| (4,142 | ) | |
| 13,062 | | |
| 263 | |
| Non-GAAP EBITDA | |
$ | 46,424 | | |
$ | 23,742 | | |
$ | 135,775 | | |
$ | 137,885 | |
| Non-GAAP EBITDA margin (non-GAAP EBITDA as a % of total revenues) | |
| 15.1 | % | |
| 9.2 | % | |
| 12.2 | % | |
| 12.0 | % |
| | |
| | | |
| | | |
| | | |
| | |
| Reconciliation of GAAP net cash provided by operating activities to non-GAAP free cash flow: | |
| | | |
| | | |
| | | |
| | |
| GAAP net cash provided by operating activities | |
$ | 56,315 | | |
$ | 38,414 | | |
$ | 187,722 | | |
$ | 181,094 | |
| External-use software development costs | |
| (4,481 | ) | |
| (3,302 | ) | |
| (16,330 | ) | |
| (13,542 | ) |
| Purchases of property and equipment | |
| (9,087 | ) | |
| (9,070 | ) | |
| (36,463 | ) | |
| (41,474 | ) |
| Non-GAAP free cash flow | |
$ | 42,747 | | |
$ | 26,042 | | |
$ | 134,929 | | |
$ | 126,078 | |
| (a) | For the year ended December 31, 2023, impairment charges of other assets were approximately $0.6 million related to property
and equipment in connection with restructuring activities for optimization of certain leased facilities. |
| (b) | Tax effects calculated for all adjustments except share-based compensation expense, using an estimated annual effective tax rate of
21% for both fiscal years 2024 and 2023. |
| (c) | Defined as earnings before interest income and expense, taxes, depreciation, amortization, and share-based compensation, as well as
excluding certain other non-GAAP adjustments. |
Exhibit 99.2

Investor Presentation February 6, 2025
This presentation contains “forward - looking statements” within the meaning of federal securities laws. These forward - looking sta tements include statements with respect to 2025 guidance, strategic and growth opportunities, other expectations and other non - historical information. Without limiting the foregoing, statements including the words “expect,” “intend,” “may,” “will,” “should,” “would,” “could,” “p lan,” “potential,” “anticipate,” “believe,” “forecast,” “guidance,” “outlook,” “goals,” “target,” “estimate,” “seek,” “predict,” “project,” and similar expressions are intended to i den tify forward - looking statements. Forward - looking statements are subject to the occurrence of many events outside Omnicell’s control and are subject to various risks and uncertainties, including those described below. Among other t hin gs, there can be no assurance that Omnicell’s actual results will not differ, perhaps substantially, from the targets and expectations contained in this presentation. Such statements also include, but are not limited to, Omnicell’s projected product bookings, annual recurring revenues, reven ues , including product, service, technical services and SaaS and Expert Services revenues, respectively, non - GAAP EBITDA, and non - GAAP earnings per share; expectations regarding our planned and existing products and services, developing new or enhancing existing products and solutions, and the related objectives and expected benefits (and any implied financial impact); our ability to deliver long - term growth, value and consistent GAAP profitability; and statem ents about Omnicell’s strategy, plans, objectives, vision, promise, purpose and guiding principles, goals, including its innovation, environment, social and governance goals and strategies, transitioning to selling more products and se rvices on a subscription basis, market or Company outlook, planned investments, and growth opportunities. Actual results and other events may differ significantly from those contemplated by forward - looking statements due to numerous f actors that involve substantial known and unknown risks and uncertainties. These risks and uncertainties include, among other things, ( i ) unfavorable general economic and market conditions, including the impact and duration of inflationary pressures, (ii) Omnic ell ’s ability to take advantage of growth opportunities and develop and commercialize new solutions and enhance existing solutions, (iii) reduction in demand in the capital equipment market or redu cti on in the demand for or adoption of our solutions, systems, or services, (iv) delays in installations of our medication management solutions or our more complex medication packaging systems, (v) risks related to Omnicell’s investments in new business strategies or initiatives, including its transition to selling more products and services on a subscription basis, and its ability to acquire companies, businesses, or technologies and successfully integrate such acquisi tio ns, (vi) ability to realize the benefits of our expense containment initiatives, (vii) risks related to failing to maintain expected service levels when providing our SaaS and Expert Services or retaining our SaaS and Expert Services custom ers , (viii) Omnicell’s ability to meet the demands of, or maintain relationships with, its institutional, retail, and specialty pharmacy customers, (ix) risks related to climate change, legal, regulatory or market measures to address clima te change and related emphasis on ESG matters by various stakeholders, (x) changes to the 340B Program, (xi) risks related to the incorporation of artificial intelligence technologies into our products, services and processes or our v end ors offerings, (xii) Omnicell’s substantial debt, which could impair its financial flexibility and access to capital, (xiii) covenants in our credit agreement could restrict our business and operations, (xiv) continued and increased competitio n f rom current and future competitors in the medication management automation solutions market and the medication adherence solutions market, (xv) risks presented by government regulations, legislative changes, fraud and anti - kickb ack statues, products liability claims, the outcome of legal proceedings, and other legal obligations related to healthcare, privacy, data protection, and information security, and the costs of compliance with, and potential liability ass ociated with, our actual or perceived failure to comply with such obligations, including any potential governmental investigations and enforcement actions, litigation, fines and penalties, exposure to indemnification obligations or other liabilities, and adverse publicity related to the same; (xvi) any disruption in Omnicell’s information technology systems and breaches of data security or cyber - attacks on its systems or solutions, including the previously disclose d ransomware incident and any potential adverse legal, reputational, and financial effects that may result from it and/or additional cybersecurity incidents, as well as the effectiveness of business continuity plans during any futur e c ybersecurity incidents, (xvii) risks associated with operating in foreign countries, (xviii) Omnicell’s ability to recruit and retain skilled and motivated personnel, (xix) Omnicell’s ability to protect its intellectual property, (xx) risks re lated to the availability and sources of raw materials and components or price fluctuations, shortages, or interruptions of supply, (xxi) Omnicell’s dependence on a limited number of suppliers for certain components, equipment, and raw materials, as well as technologies provided by third - party vendors, (xxii) fluctuations in quarterly and annual operating results may make our future operating results difficult to predict, (xxiii) failing to meet (or significantl y e xceeding) our publicly announced financial guidance, and (xxiv) other risks and uncertainties further described in the “Risk Factors” section of Omnicell’s most recent Annual Report on Form 10 - K, as well as in Omnicell’s other reports filed wi th or furnished to the United States Securities and Exchange Commission (“SEC”), available at www.sec.gov . Forward - looking statements should be considered in light of these risks and uncertainties. Investors and others are cautioned no t to place undue reliance on forward - looking statements. All forward - looking statements contained in this presentation speak only as of the date of this presentation. Omnicell assumes no obligation to update any such statements pub lic ly, or to update the reasons actual results could differ materially from those expressed or implied in any forward - looking statements, whether as a result of changed circumstances, new information, future events, or otherwise, except a s required by law. Non - GAAP Financial Information This presentation contains financial measures that are not calculated in accordance with U.S. generally accepted accounting p rin ciples (“GAAP”), including Q4’24 and FY’24 non - GAAP gross margin, non - GAAP operating expenses, non - GAAP EBITDA, and non - GAAP diluted earnings per share, guidance with respect to 2025 non - GAAP EBITDA and non - GAAP earnings per sh are. Reconciliations of the Q4’24 and FY’24 non - GAAP financial measures to the most directly comparable GAAP measures are included in the Appendix to this presentation. Our 2025 guidance for non - GAAP EBITDA and non - GAAP e arnings per share, exclude certain items, which include, but are not limited to, unusual gains and losses, costs associated with future restructurings, acquisition - related expenses, and certain tax and litigation outcomes. Thes e excluded items may be significant. We do not provide a reconciliation of forward - looking non - GAAP guidance or targets to the comparable GAAP measures as these items are inherently uncertain and difficult to estimate and cannot be pr edi cted without unreasonable effort. We believe such a reconciliation would imply a degree of precision that could be confusing or misleading to investors. These items may also have a material impact on GAAP earnings per share and GAA P n et income in future periods. As such, these forward - looking non - GAAP financial measures are limited in their utility for evaluating our future operating results in accordance with GAAP. OMNICELL, the Omnicell logo, and ENLIVENHEALTH are registered trademarks of Omnicell, Inc. or one its subsidiaries. © 2025 Omnicell, Inc. 2 Forward - Looking Statements
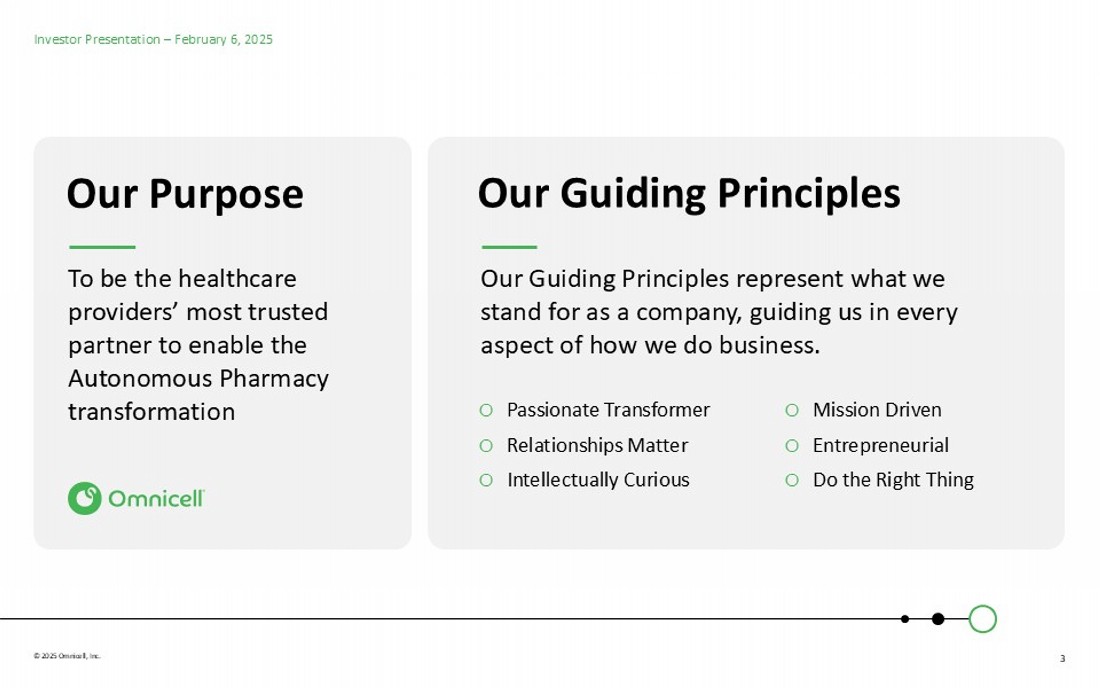
© 2025 Omnicell, Inc. 3 Investor Presentation – February 6, 2025 Our Guiding Principles Our Purpose To be the healthcare providers’ most trusted partner to enable the Autonomous Pharmacy transformation Our Guiding Principles represent what we stand for as a company, guiding us in every aspect of how we do business. o Passionate Transformer o Relationships Matter o Intellectually Curious o Mission Driven o Entrepreneurial o Do the Right Thing
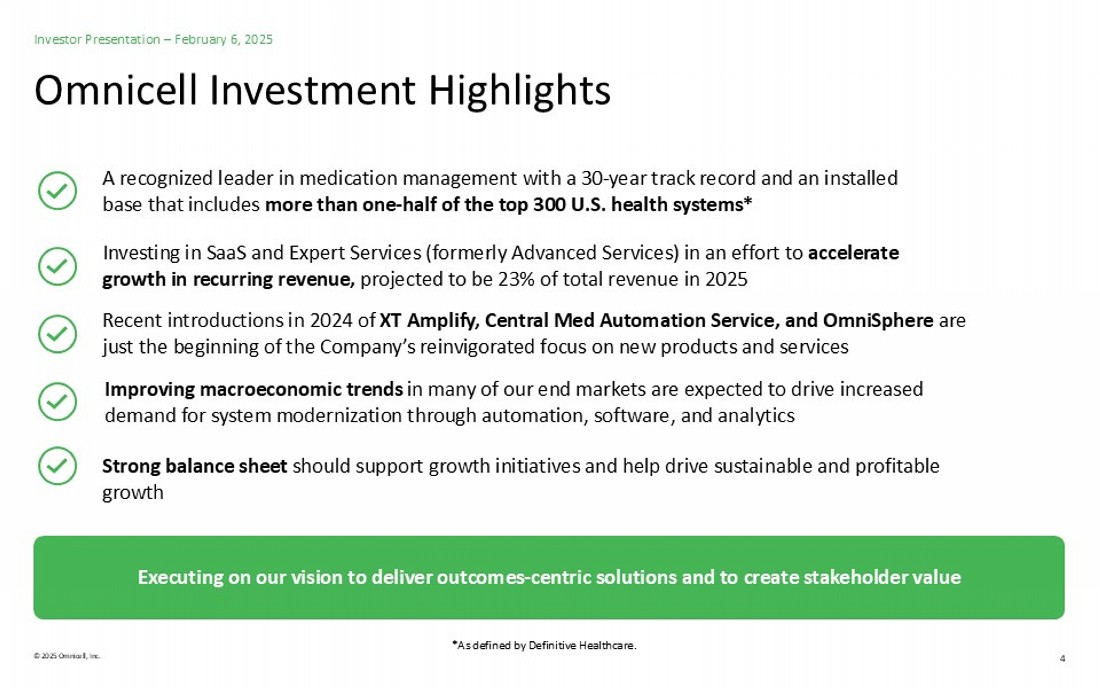
© 2025 Omnicell, Inc. 4 Omnicell Investment Highlights Investor Presentation – February 6, 2025 A recognized leader in medication management with a 30 - year track record and an installed base that includes more than one - half of the top 300 U.S. health systems * Investing in SaaS and Expert Services (formerly Advanced Services) in an effort to accelerate growth in recurring revenue, projected to be 23% of total revenue in 2025 Improving macroeconomic trends in many of our end markets are expected to drive increased demand for system modernization through automation, software, and analytics Strong balance sheet should support growth initiatives and help drive sustainable and profitable growth Executing on our vision to deliver outcomes - centric solutions and to create stakeholder value Recent introductions in 2024 of XT Amplify, Central Med Automation Service, and OmniSphere are just the beginning of the Company’s reinvigorated focus on new products and services *As defined by Definitive Healthcare.
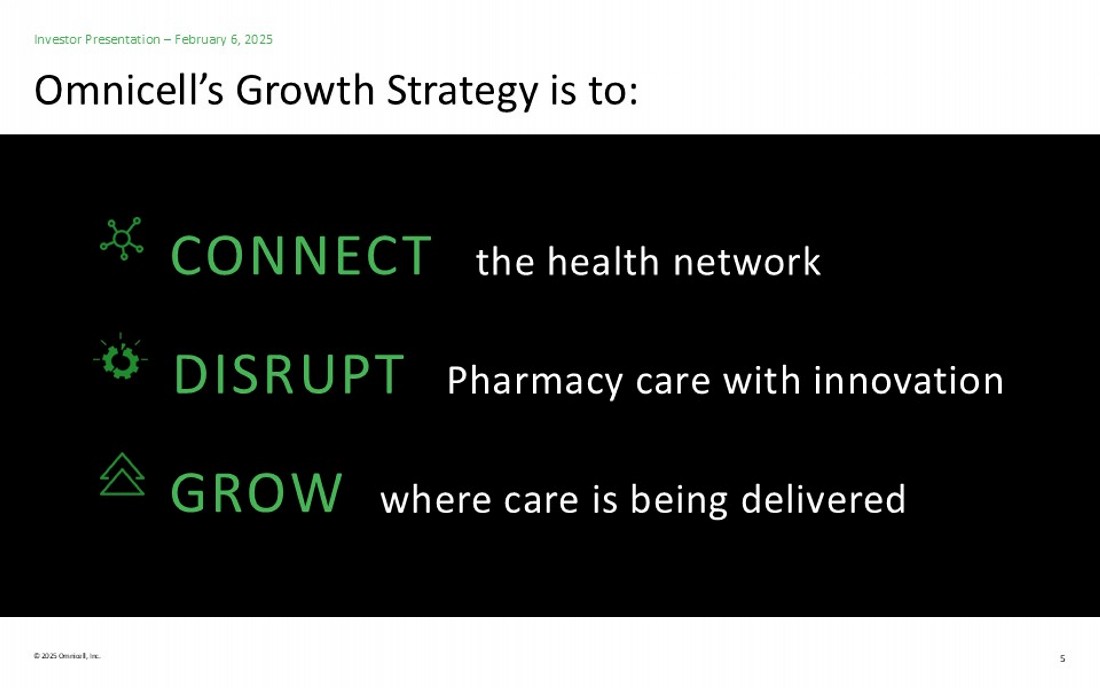
© 2025 Omnicell, Inc. 5 Omnicell’s Growth Strategy is to: Investor Presentation – February 6, 2025 CONNECT the health network GROW where care is being delivered DISRUPT Pharmacy care with innovation
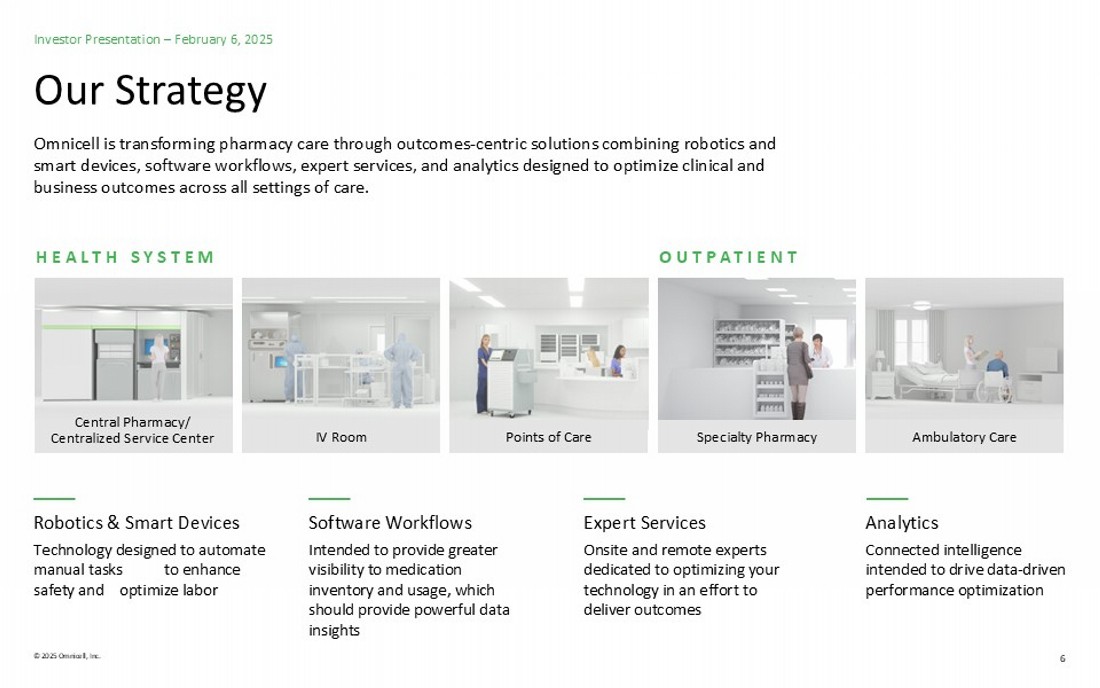
© 2025 Omnicell, Inc. Our Strategy Investor Presentation – February 6, 2025 HEALTH SYSTEM OUTPATIENT Central Pharmacy/ Centralized Service Center IV Room Points of Care Specialty Pharmacy Ambulatory Care Omnicell is transforming pharmacy care through outcomes - centric solutions combining robotics and smart devices, software workflows, expert services, and analytics designed to optimize clinical and business outcomes across all settings of care. Software Workflows Intended to provide greater visibility to medication inventory and usage, which should provide powerful data insights Robotics & Smart Devices Technology designed to automate manual tasks to enhance safety and optimize labor Analytics Connected intelligence intended to drive data - driven performance optimization Expert Services Onsite and remote experts dedicated to optimizing your technolog y in an effort to deliver outcomes 6

The Autonomous Pharmacy Investor Presentation – February 6, 2025 Industry - Defined Vision Replace manual, error - prone activities with automated processes that are designed to be safer and more efficient. o Zero medication errors o Zero medication waste o Zero human touches until delivery to patient o 100% regulatory compliance o 100% data and inventory visibility o 100% pharmacist’s time on clinical activities American Journal of Health - System Pharmacy, Volume 78 Issue 7, April 2021 © 2025 Omnicell, Inc. 7
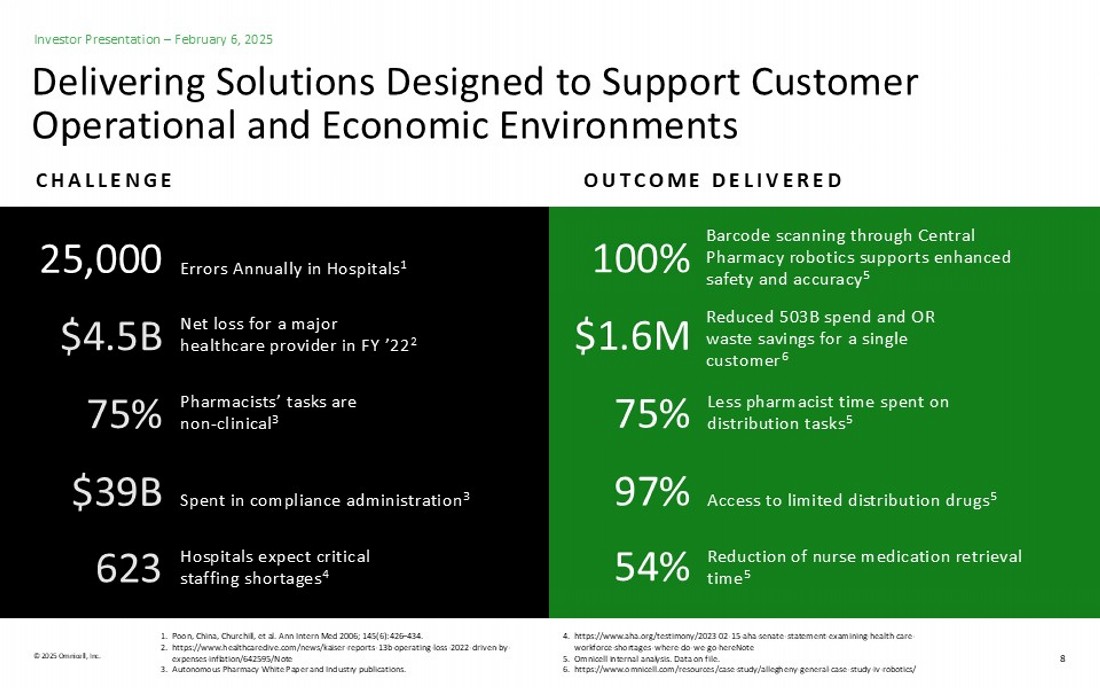
© 2025 Omnicell, Inc. 8 Investor Presentation – February 6, 2025 OUTCOME DELIVERED 25,000 Errors Annually in Hospitals 1 $4.5B Net loss for a major healthcare provider in FY ’22 2 $39B Spent in compliance administration 3 623 Hospitals expect critical staffing shortages 4 75% Pharmacists’ tasks are non - clinical 3 Less pharmacist time spent on distribution tasks 5 Reduced 503B spend and OR waste savings for a single customer 6 Reduction of nurse medication retrieval time 5 Access to limited distribution drugs 5 Barcode scanning through Central Pharmacy robotics supports enhanced safety and accuracy 5 75% $1.6M 54% 97% 100% 1. Poon, China, Churchill, et al. Ann Intern Med 2006; 145(6):426 – 434. 2. https://www.healthcaredive.com/news/kaiser - reports - 13b - operating - loss - 2022 - driven - by - expenses - inflation/642595/Note 3. Autonomous Pharmacy White Paper and Industry publications. 4. https://www.aha.org/testimony/2023 - 02 - 15 - aha - senate - statement - examining - health - care - workforce - shortages - where - do - we - go - hereNote 5. Omnicell internal analysis. Data on file. 6. https://www.omnicell.com/resources/case - study/allegheny - general - case - study - iv - robotics/ CHALLENGE Delivering Solutions Designed to Support Customer Operational and Economic Environments
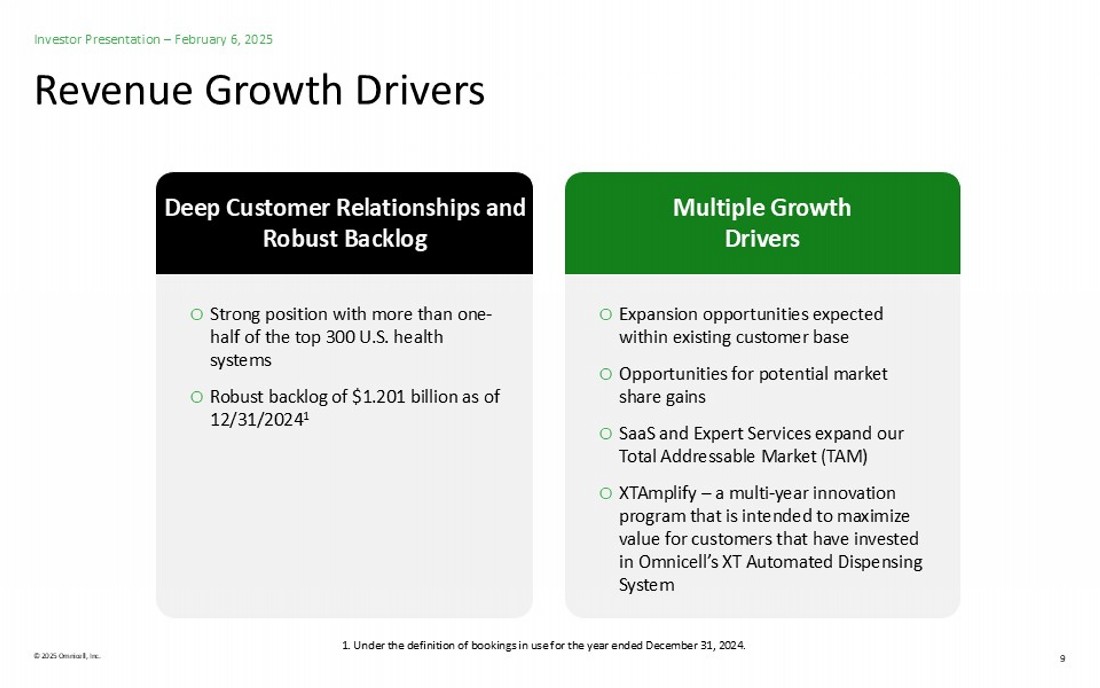
© 2025 Omnicell, Inc. 9 Revenue Growth Drivers Investor Presentation – February 6, 2025 Deep Customer Relationships and Robust Backlog o Strong position with more than one - half of the top 300 U.S. health systems o Robust backlog of $1.201 billion as of 12/31/2024 1 Multiple Growth Drivers o Expansion opportunities expected within existing customer base o Opportunities for potential market share gains o SaaS and Expert Services expand our Total Addressable Market (TAM) o XTAmplify – a multi - year innovation program that is intended to maximize value for customers that have invested in Omnicell’s XT Automated Dispensing System 1. Under the definition of bookings in use for the year ended December 31, 2024.
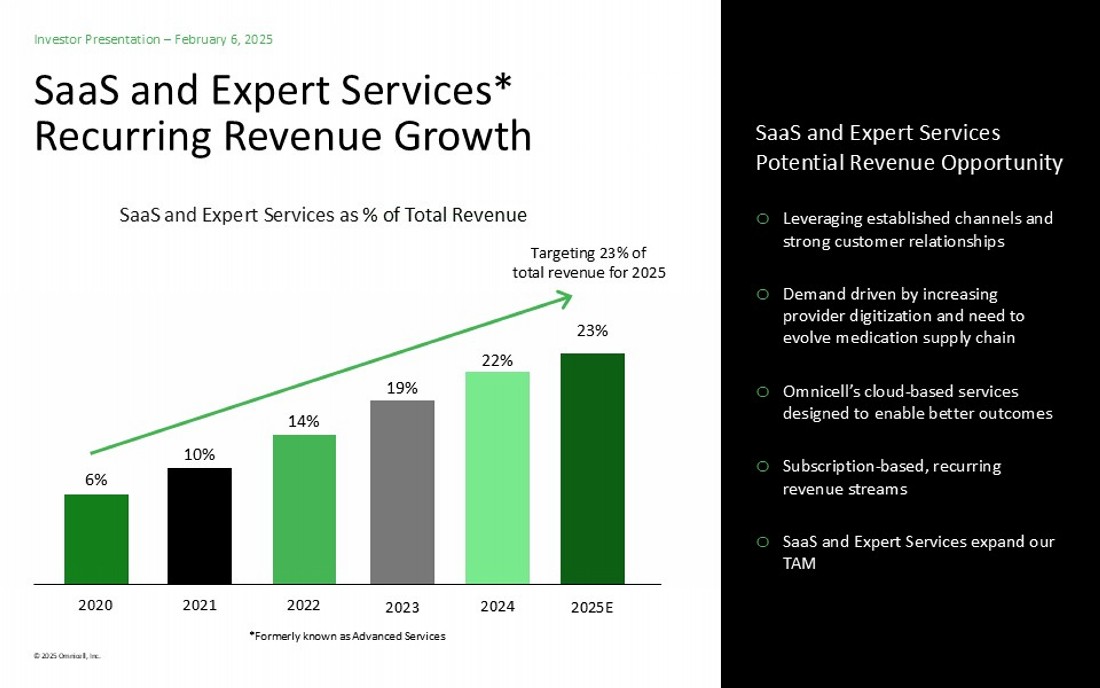
© 2025 Omnicell, Inc. 10 SaaS and Expert Services* Recurring Revenue Growth Investor Presentation – February 6, 2025 SaaS and Expert Services Potential Revenue Opportunity o Leveraging established channels and strong customer relationships o Demand driven by increasing provider digitization and need to evolve medication supply chain o Omnicell’s cloud - based services designed to enable better outcomes o Subscription - based, recurring revenue streams o SaaS and Expert Services expand our TAM SaaS and Expert Services as % of Total Revenue 6% 20 20 14% 202 2 2021 10% 202 4 22% 202 3 19% 23% 202 5E Targeting 23% of total revenue for 2025 *Formerly known as Advanced Services
© 2025 Omnicell, Inc. 11 Why We Believe Omnicell is Positioned to Win Investor Presentation – February 6, 2025 Omnicell has the right solutions and the right business model to solve the medication management problem that the healthcare system is facing Omnicell has a proven track record of innovation as the leading strategic partner to health systems in large and growing market segments Omnicell is scaling SaaS and Expert Services* to capitalize on the many growth opportunities ahead — with SaaS and Expert Services* growth continuing to drive recurring revenue growth Continued investment in new products and solutions to drive long - term sustainable growth. Executing on our goal to advance the industry - defined vision of the Autonomous Pharmacy *Formerly known as Advanced Services

Product Overview
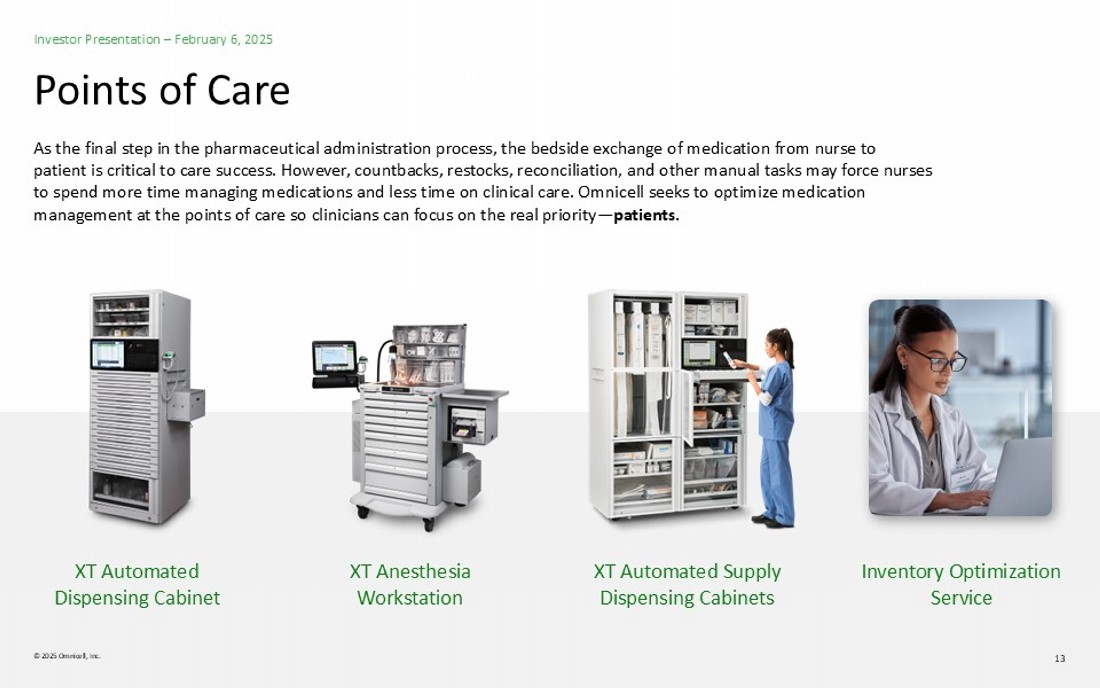
© 2025 Omnicell, Inc. 13 Points of Care XT Automated Supply Dispensing Cabinets XT Anesthesia Workstation Inventory Optimization Service XT Automated Dispensing Cabinet Investor Presentation – February 6, 2025 As the final step in the pharmaceutical administration process, the bedside exchange of medication from nurse to patient is critical to care success. However, countbacks, restocks, reconciliation, and other manual tasks may force nurses to spend more time managing medications and less time on clinical care. Omnicell seeks to optimize medication management at the points of care so clinicians can focus on the real priority — patients .

© 2025 Omnicell, Inc. 14 Central Pharmacy Pharmacy Carousel Inventory Optimization Service Central Pharmacy Dispensing Service Investor Presentation – February 6, 2025 Central pharmacy is the medication dispensing hub of most hospitals. Roadblocks that surface here have the potential to impact patient safety, care, and clinical workflows throughout the health system. Omnicell automates manual dispensing tasks in an effort to reduce errors and waste, improve accuracy, and give valuable human resources more time to focus on the work that matters most — patient care .
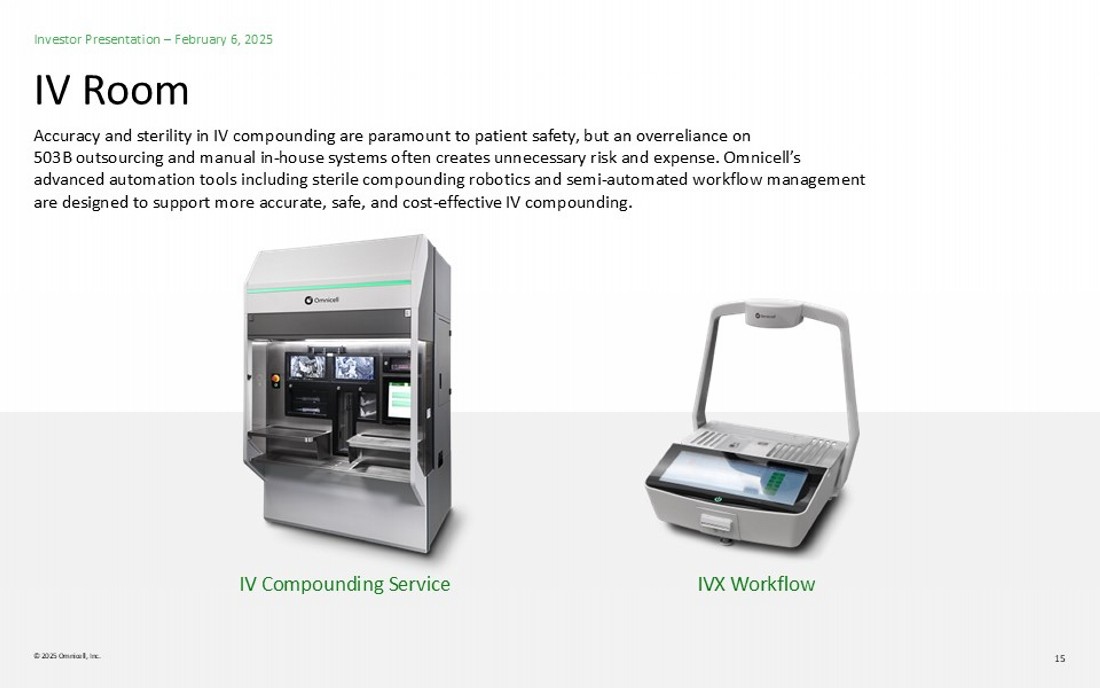
© 2025 Omnicell, Inc. 15 IV Room IVX Workflow IV Compounding Service Investor Presentation – February 6, 2025 Accuracy and sterility in IV compounding are paramount to patient safety, but an overreliance on 503B outsourcing and manual in - house systems often creates unnecessary risk and expense. Omnicell’s advanced automation tools including sterile compounding robotics and semi - automated workflow management are designed to support more accurate, safe, and cost - effective IV compounding.

© 2025 Omnicell, Inc. 16 Specialty Pharmacy Omnicell 340B Specialty Pharmacy Services Investor Presentation – February 6, 2025 As medical innovations create new, more complex drugs, many pharmacies need specialized tools and expertise to help manage the patient’s treatment journey. Opening or optimizing an in - house specialty pharmacy often requires unique capabilities to navigate the demands of high - cost, high - touch medications. Omnicell seeks to deliver the technology and know - how to help customers accelerate and maximize specialty pharmacy outcomes.

© 2025 Omnicell, Inc. 17 Ambulatory Care EnlivenHealth® Investor Presentation – February 6, 2025 Optimizing a patient’s medication journey often means extending care beyond the inpatient setting and enhancing the processes of retail and community pharmacies. Through EnlivenHealth®, Omnicell provides patient engagement software and omnichannel communications that is designed to empower retail pharmacies and health plans to promote optimal health of patient and member communities while improving their performance.
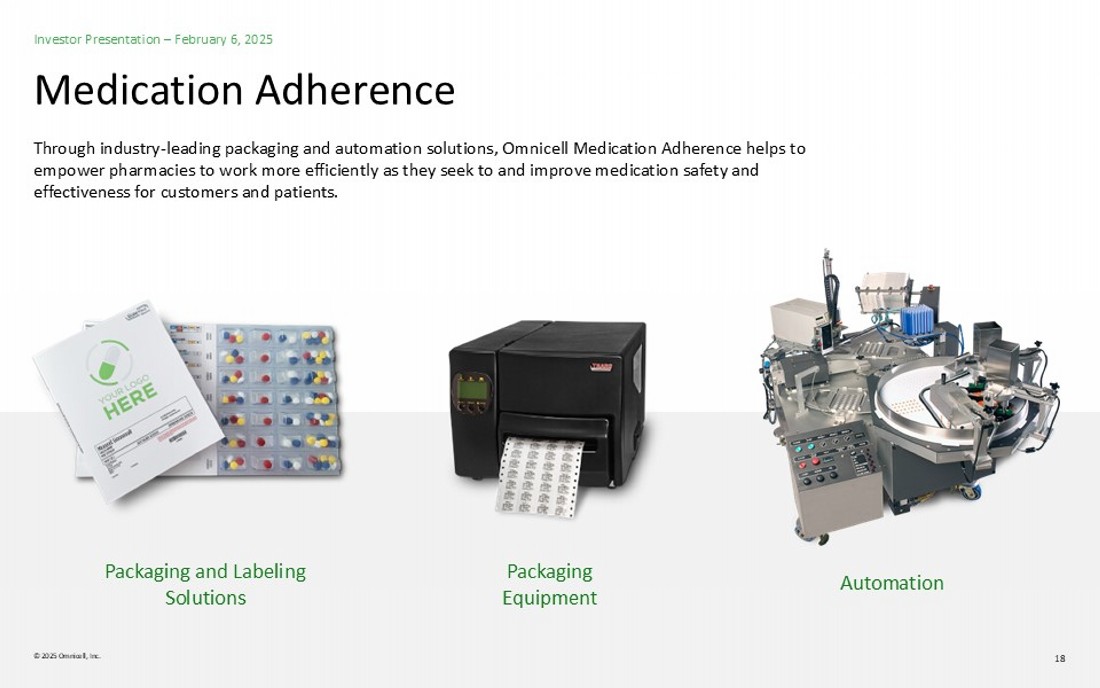
© 2025 Omnicell, Inc. 18 Medication Adherence Packaging Equipment Automation Packaging and Labeling Solutions Investor Presentation – February 6, 2025 Through industry - leading packaging and automation solutions, Omnicell Medication Adherence helps to empower pharmacies to work more efficiently as they seek to and improve medication safety and effectiveness for customers and patients.

© 2025 Omnicell, Inc. 19 Omnicell’s Suite of SaaS and Expert Services* Investor Presentation – February 6, 2025 IV Compounding Central Pharmacy/ Centralized Services Center Points of Care Inventory Optimization Ambulatory Pharmacy Care Specialty Pharmacy Varying combinations of robotics and smart devices, software workflows, expert services, and analytics that are designed to deliver outcomes in each setting of care where medications are managed A Rapidly Growing Source of Recurring Revenue *Formerly known as Advanced Services
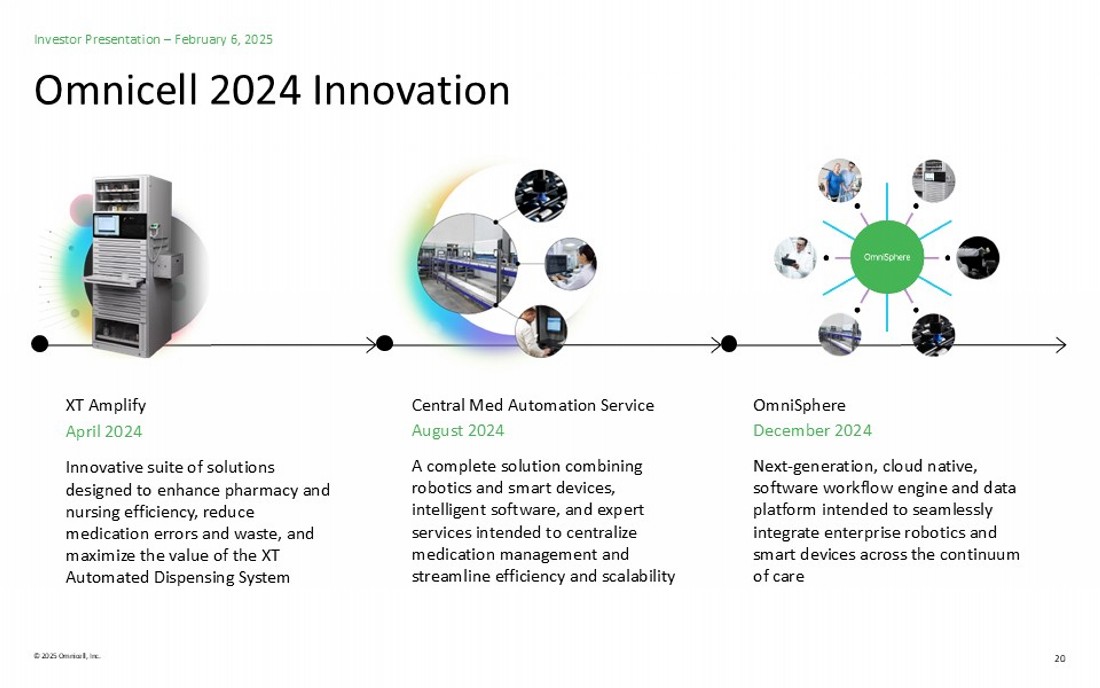
© 2025 Omnicell, Inc. 20 Omnicell 2024 Innovation Investor Presentation – February 6, 2025 XT Amplify April 2024 Innovative suite of solutions designed to enhance pharmacy and nursing efficiency, reduce medication errors and waste, and maximize the value of the XT Automated Dispensing System Central Med Automation Service August 2024 A complete solution combining robotics and smart devices, intelligent software, and expert services intended to centralize medication management and streamline efficiency and scalability OmniSphere December 2024 Next - generation, cloud native, software workflow engine and data platform intended to seamlessly integrate enterprise robotics and smart devices across the continuum of care
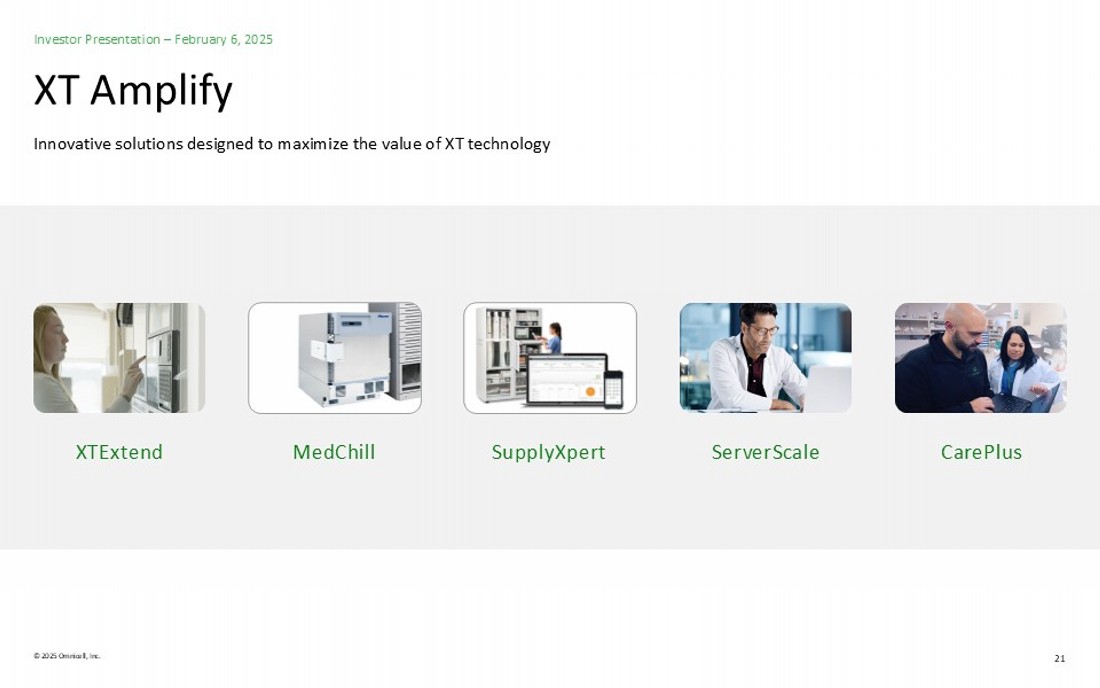
© 2025 Omnicell, Inc. 21 XT Amplify Investor Presentation – February 6, 2025 XTExtend MedChill SupplyXpert ServerScale CarePlus Innovative solutions designed to maximize the value of XT technology
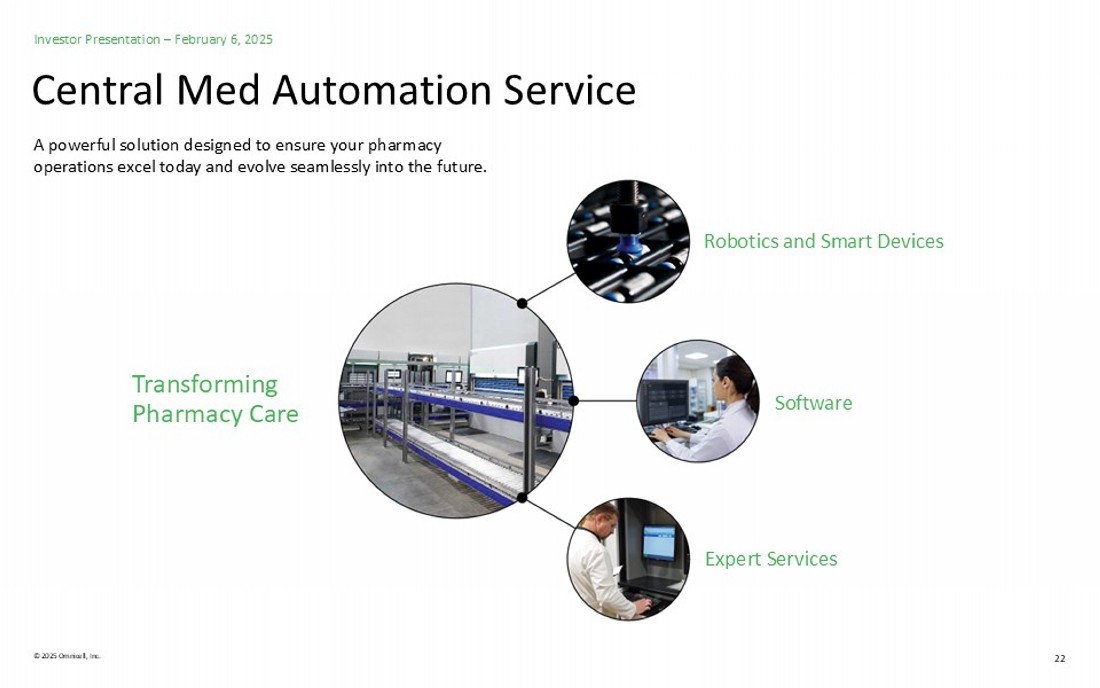
© 2025 Omnicell, Inc. 22 Central Med Automation Service Investor Presentation – February 6, 2025 Robotics and Smart Devices Software Expert Services Transforming Pharmacy Care A powerful solution designed to ensure your pharmacy operations excel today and evolve seamlessly into the future.
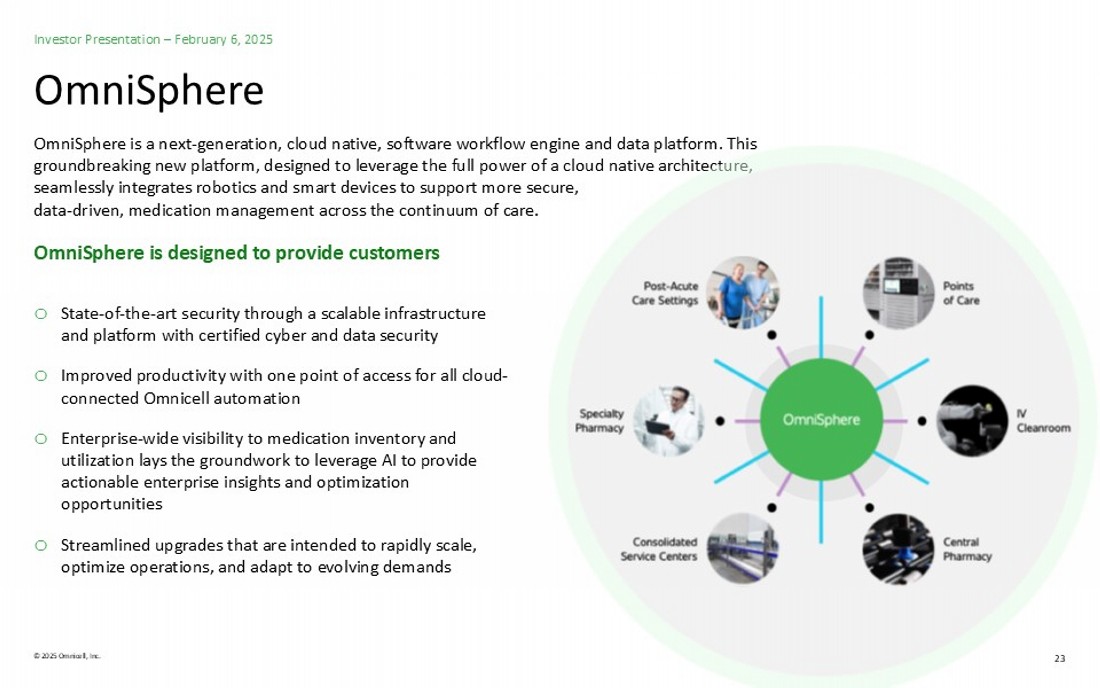
© 2025 Omnicell, Inc. 23 OmniSphere Investor Presentation – February 6, 2025 o State - of - the - art security through a scalable infrastructure and platform with certified cyber and data security o Improved productivity with one point of access for all cloud - connected Omnicell automation o Enterprise - wide visibility to medication inventory and utilization lays the groundwork to leverage AI to provide actionable enterprise insights and optimization opportunities o Streamlined upgrades that are intended to rapidly scale, optimize operations, and adapt to evolving demands OmniSphere is a next - generation, cloud native, software workflow engine and data platform. This groundbreaking new platform, designed to leverage the full power of a cloud native architecture, seamlessly integrates robotics and smart devices to support more secure, data - driven, medication management across the continuum of care. OmniSphere is designed to provide customers

Fourth Quarter and Full Year 2024 Financial Highlights
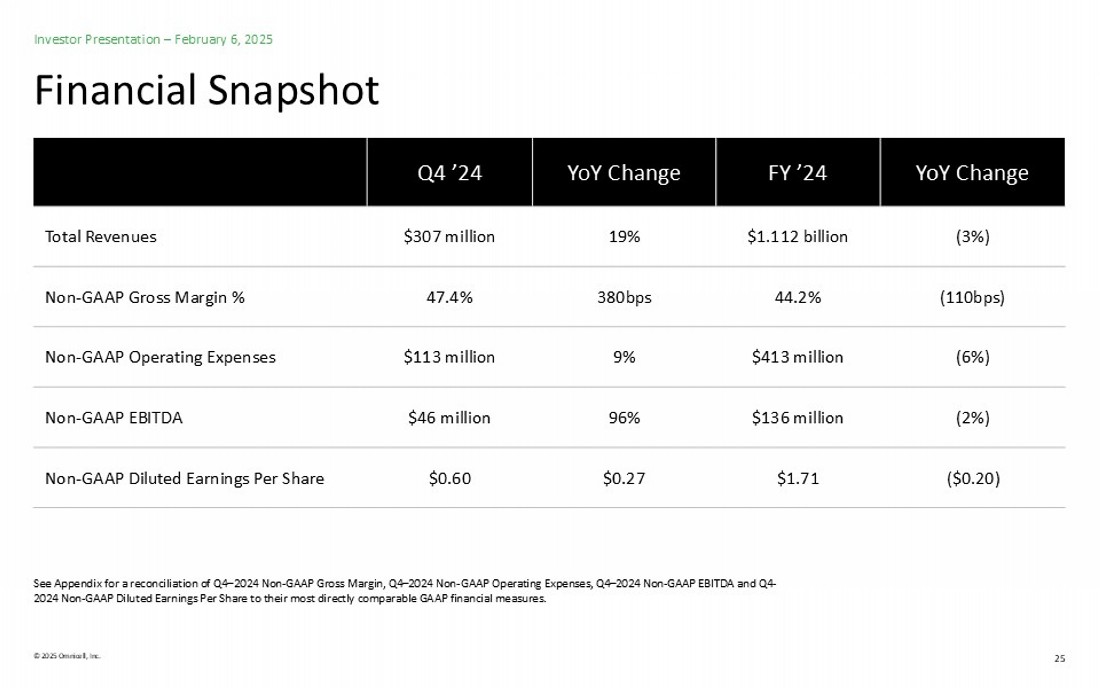
© 2025 Omnicell, Inc. 25 Financial Snapshot Investor Presentation – February 6, 2025 See Appendix for a reconciliation of Q4 – 2024 Non - GAAP Gross Margin, Q4 – 2024 Non - GAAP Operating Expenses, Q4 – 2024 Non - GAAP EBITDA and Q4 - 2024 Non - GAAP Diluted Earnings Per Share to their most directly comparable GAAP financial measures. YoY Change FY ’24 YoY Change Q4 ’24 (3%) $1.112 billion 19% $307 million Total Revenues (110bps) 44.2% 380bps 47.4% Non - GAAP Gross Margin % (6%) $413 million 9% $113 million Non - GAAP Operating Expenses (2%) $136 million 96% $46 million Non - GAAP EBITDA ($0.20) $1.71 $0.27 $0.60 Non - GAAP Diluted Earnings Per Share
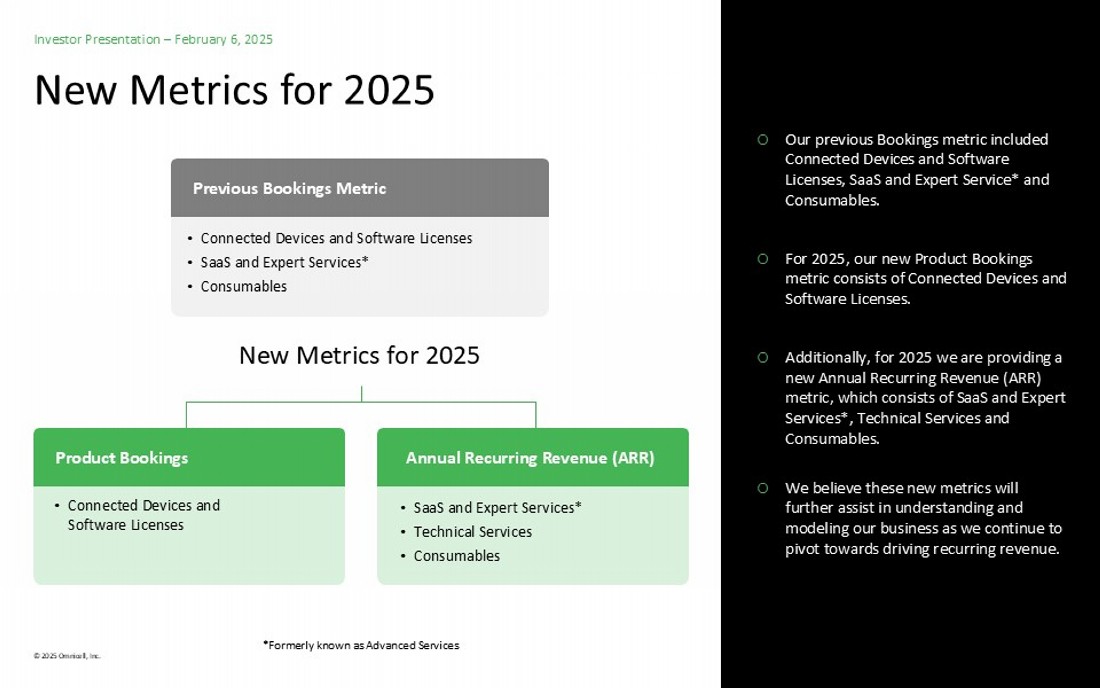
© 2025 Omnicell, Inc. 26 New Metrics for 2025 Investor Presentation – February 6, 2025 o Our previous Bookings metric included Connected Devices and Software Licenses, SaaS and Expert Service* and Consumables. o For 2025, our new Product Bookings metric consists of Connected Devices and Software Licenses. o Additionally, for 2025 we are providing a new Annual Recurring Revenue (ARR) metric, which consists of SaaS and Expert Services*, Technical Services and Consumables. o We believe these new metrics will further assist in understanding and modeling our business as we continue to pivot towards driving recurring revenue. Product Bookings • Connected Devices and Software Licenses New Metrics for 2025 Annual Recurring Revenue (ARR) • SaaS and Expert Services* • Technical Services • Consumables Previous Bookings Metric • Connected Devices and Software Licenses • SaaS and Expert Services* • Consumables *Formerly known as Advanced Services
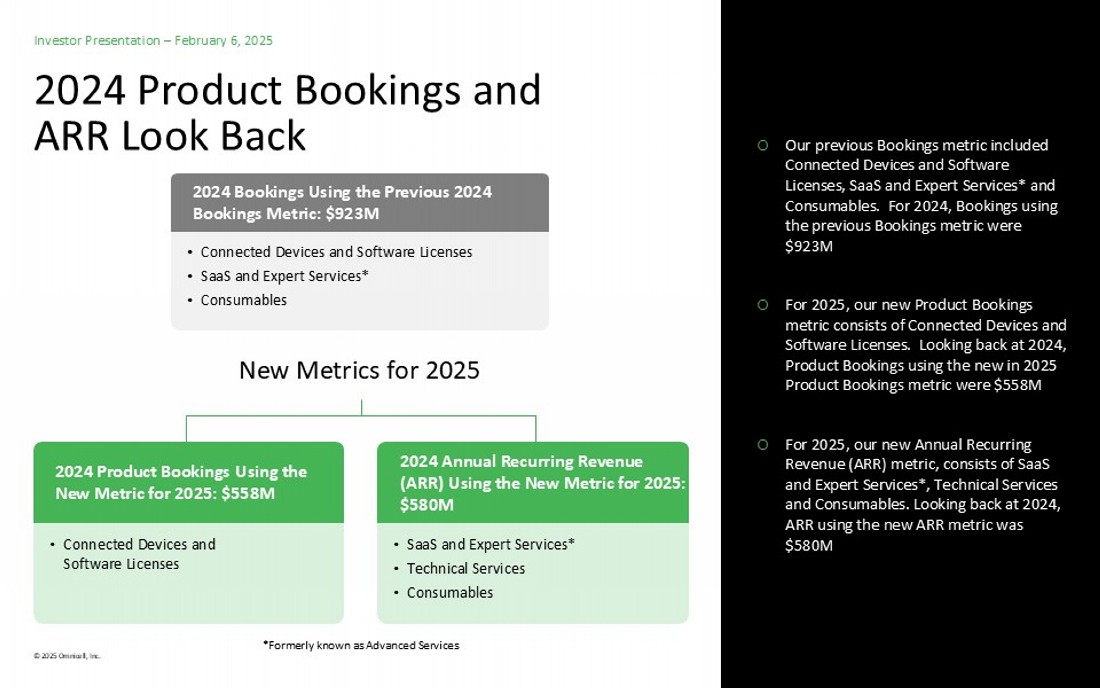
© 2025 Omnicell, Inc. 27 2024 Product Bookings and ARR Look Back Investor Presentation – February 6, 2025 o Our previous Bookings metric included Connected Devices and Software Licenses, SaaS and Expert Services* and Consumables. For 2024, Bookings using the previous Bookings metric were $923M o For 2025, our new Product Bookings metric consists of Connected Devices and Software Licenses. Looking back at 2024, Product Bookings using the new in 2025 Product Bookings metric were $558M o For 2025, our new Annual Recurring Revenue (ARR) metric, consists of SaaS and Expert Services*, Technical Services and Consumables. Looking back at 2024, ARR using the new ARR metric was $580M 2024 Product Bookings Using the New Metric for 2025 : $558M • Connected Devices and Software Licenses New Metrics for 2025 2024 Annual Recurring Revenue (ARR) Using the New Metric for 2025 : $580M • SaaS and Expert Services* • Technical Services • Consumables 2024 Bookings Using the Previous 2024 Bookings Metric: $923M • Connected Devices and Software Licenses • SaaS and Expert Services* • Consumables *Formerly known as Advanced Services
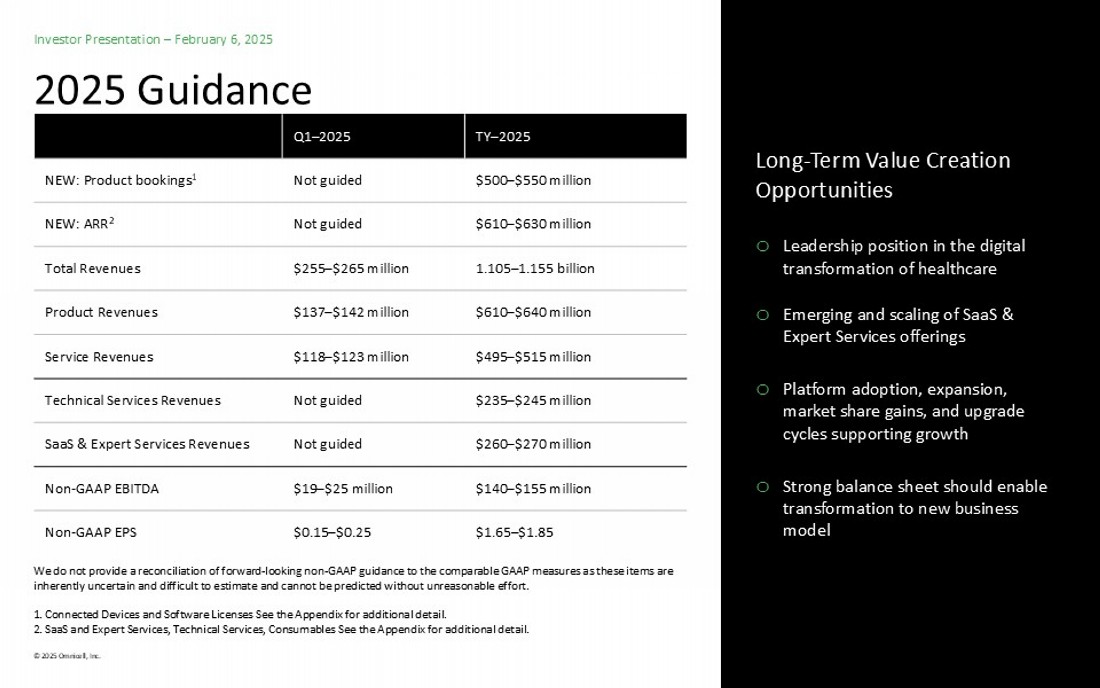
© 2025 Omnicell, Inc. 28 2025 Guidance Investor Presentation – February 6, 2025 Long - Term Value Creation Opportunities o Leadership position in the digital transformation of healthcare o Emerging and scaling of SaaS & Expert Services offerings o Platform adoption, expansion, market share gains, and upgrade cycles supporting growth o Strong balance sheet should enable transformation to new business model TY – 2025 Q1 – 2025 $500 – $550 million Not guided NEW: Product bookings 1 $610 – $630 million Not guided NEW: ARR 2 1.105 – 1.155 billion $255 – $265 million Total Revenues $610 – $640 million $137 – $142 million Product Revenues $495 – $515 million $118 – $123 million Service Revenues $235 – $245 million Not guided Technical Services Revenues $260 – $270 million Not guided SaaS & Expert Services Revenues $140 – $155 million $19 – $25 million Non - GAAP EBITDA $1.65 – $1.85 $0.15 – $0.25 Non - GAAP EPS We do not provide a reconciliation of forward - looking non - GAAP guidance to the comparable GAAP measures as these items are inherently uncertain and difficult to estimate and cannot be predicted without unreasonable effort. 1. Connected Devices and Software Licenses See the Appendix for additional detail. 2. SaaS and Expert Services, Technical Services, Consumables See the Appendix for additional detail.
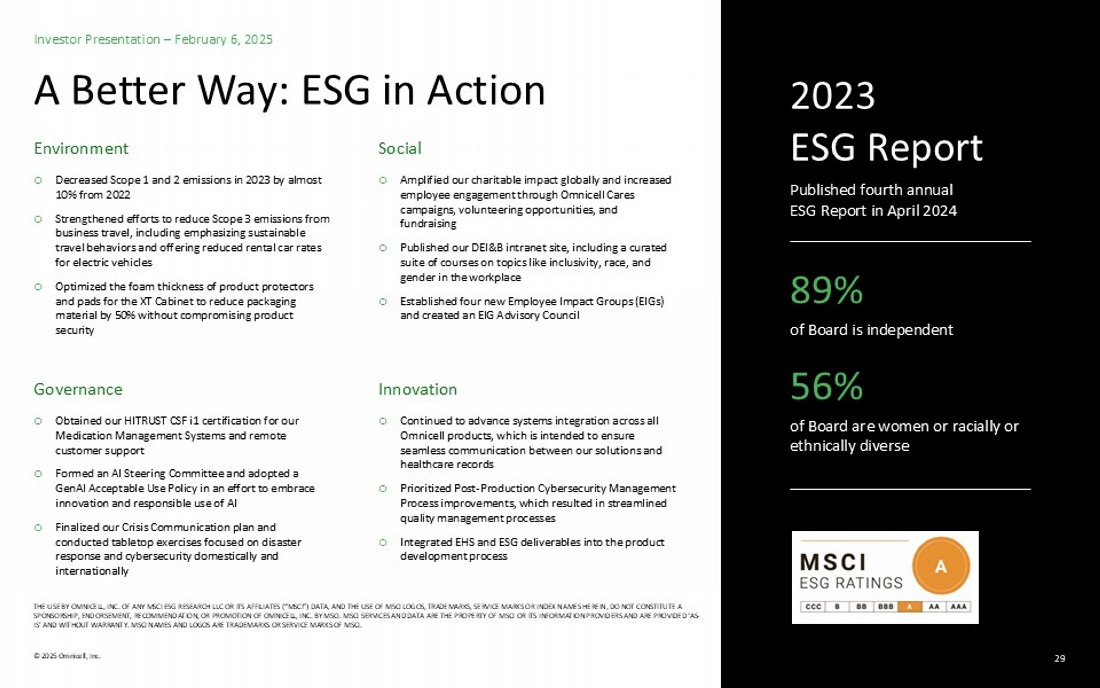
© 2025 Omnicell, Inc. A Better Way: ESG in Action Investor Presentation – February 6, 2025 Environment 89% of Board is independent 56% of Board are women or racially or ethnically diverse 2023 ESG Report Published fourth annual ESG Report in April 2024 o Decreased Scope 1 and 2 emissions in 2023 by almost 10% from 2022 o Strengthened efforts to reduce Scope 3 emissions from business travel, including emphasizing sustainable travel behaviors and offering reduced rental car rates for electric vehicles o Optimized the foam thickness of product protectors and pads for the XT Cabinet to reduce packaging material by 50% without compromising product security Governance o Obtained our HITRUST CSF i1 certification for our Medication Management Systems and remote customer support o Formed an AI Steering Committee and adopted a GenAI Acceptable Use Policy in an effort to embrace innovation and responsible use of AI o Finalized our Crisis Communication plan and conducted tabletop exercises focused on disaster response and cybersecurity domestically and internationally Social o Amplified our charitable impact globally and increased employee engagement through Omnicell Cares campaigns, volunteering opportunities, and fundraising o Published our DEI&B intranet site, including a curated suite of courses on topics like inclusivity, race, and gender in the workplace o Established four new Employee Impact Groups (EIGs) and created an EIG Advisory Council Innovation o Continued to advance systems integration across all Omnicell products, which is intended to ensure seamless communication between our solutions and healthcare records o Prioritized Post - Production Cybersecurity Management Process improvements, which resulted in streamlined quality management processes o Integrated EHS and ESG deliverables into the product development process THE USE BY O MNICELL , INC. OF ANY MSCI ESG RESEARCH LLC OR ITS AFFILIATES (“MSCI”) DATA, AND THE USE OF MSCI LOGOS, TRA DEMARKS, SERVICE MARKS OR INDEX NAMES HEREIN, DO NOT CONSTITUTE A SPONSORSHIP, ENDORSEMENT, RECOMMENDATION, OR PROMOTION OF O MNICELL , INC. BY MSCI. MSCI SERVICES AND DATA ARE THE PROPERTY OF MSCI OR ITS INFORMATION PROVIDERS AND ARE PROVIDED ‘AS - IS’ AND WITHOUT WARRANTY. MSCI NAMES AND LOGOS ARE TRADEMARKS OR SERVICE MARKS OF MSCI. 29

Appendix
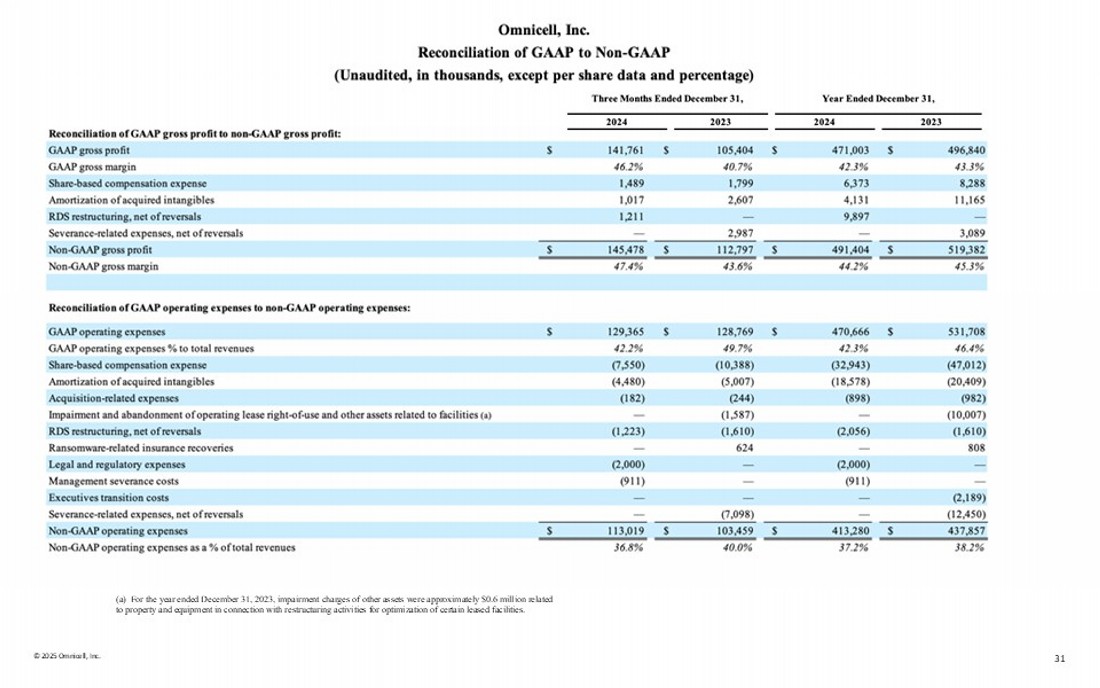
© 2025 Omnicell, Inc. 31 (a) For the year ended December 31, 2023, impairment charges of other assets were approximately $0.6 million related to property and equipment in connection with restructuring activities for optimization of certain leased facilities.

© 2025 Omnicell, Inc. 32 (a) For the year ended December 31, 2023, impairment charges of other assets were approximately $0.6 million related to property and equipment in connection with restructuring activities for optimization of certain leased facilities. (b) Tax effects calculated for all adjustments except share - based compensation expense, using an estimated annual effective tax rate of 21% for both fiscal years 2024 and 2023.
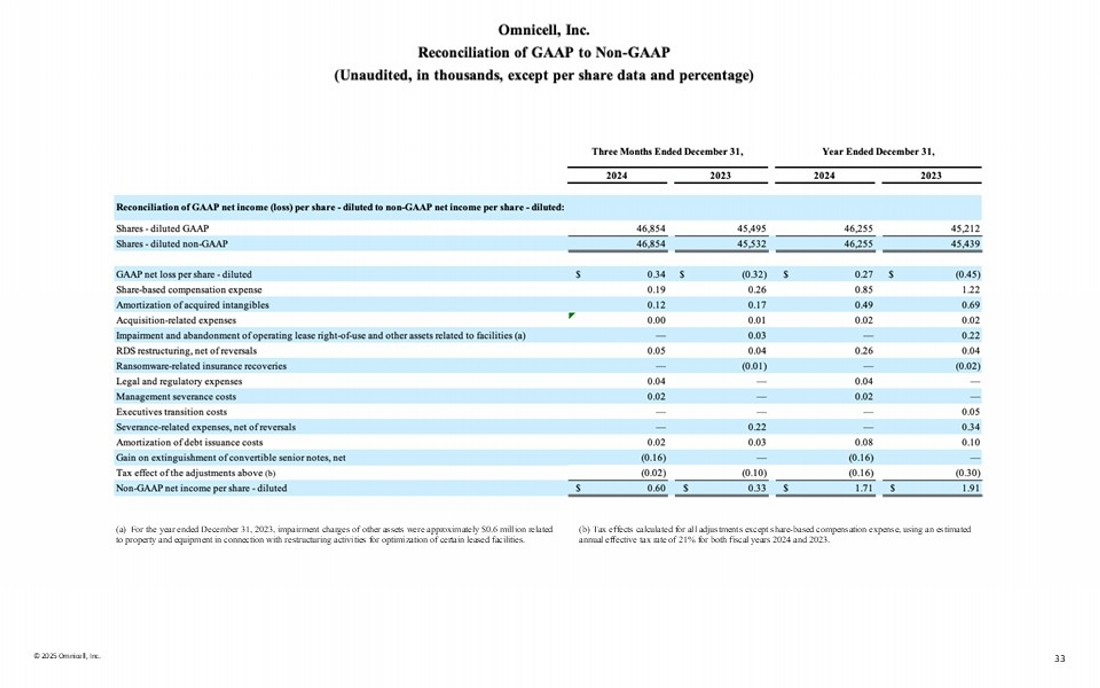
© 2025 Omnicell, Inc. 33 (a) For the year ended December 31, 2023, impairment charges of other assets were approximately $0.6 million related to property and equipment in connection with restructuring activities for optimization of certain leased facilities. (b) Tax effects calculated for all adjustments except share - based compensation expense, using an estimated annual effective tax rate of 21% for both fiscal years 2024 and 2023.
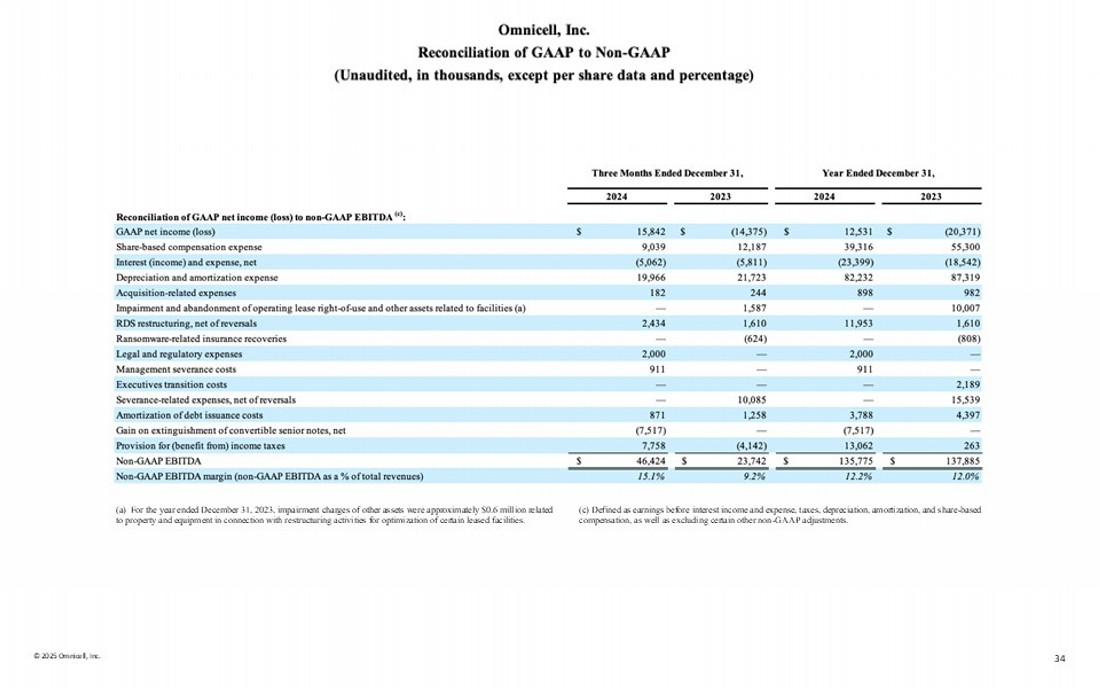
© 2025 Omnicell, Inc. 34 (a) For the year ended December 31, 2023, impairment charges of other assets were approximately $0.6 million related to property and equipment in connection with restructuring activities for optimization of certain leased facilities. (c) Defined as earnings before interest income and expense, taxes, depreciation, amortization, and share - based compensation, as well as excluding certain other non - GAAP adjustments.
© 2025 Omnicell, Inc. 35 Glossary of Terms Investor Presentation – February 6, 2025 Bookings (Historical Metric): We utilize bookings as an indicator of the success of our business. During 2024, we defined bookings generally as: ( i ) the value of non - cancelable contracts for our connected devices, software products, and SaaS and Expert Services (although, for thos e SaaS and Expert Services contracts without a minimum commitment, bookings only include the amount of revenue that has been recognized once th e s ervices have been provided); and (ii) for our consumables, the value of orders placed through our Omnicell Storefront online platform or t hro ugh written or telephonic orders. We typically exclude technical services and other less significant items ancillary to our products and ser vic es, such as freight revenue, from bookings. In addition, dependent upon counterparty or credit risk, which is evaluated at the time of contract s ign ing, for a given multi - year subscription contract we may reduce the portion of the contractual commitment booked at a given time. Connected devices and software license bookings are recorded as revenue upon customer acceptance of the installation or receipt of goods. Revenues from SaaS and Exp ert Services bookings are recorded over the contractual term. Backlog (Historical Metric): Under the definition of bookings in use for the year ended December 31, 2024, Backlog is the dollar amount of bookings that have not yet been recognized as revenue. Bookings for those SaaS and Expert Services contracts without a minimum commitm ent are not included in backlog. In addition, dependent upon counterparty or credit risk, which is evaluated at the time of contract signing, for a g iven multi - year subscription contract we may reduce the portion of the contractual commitment booked at a given time, and these excluded amou nts are not included in backlog. A majority of our connected devices and software license products are installable and recognized as revenues with in twelve months of booking, while service revenues from SaaS and Expert Services are recorded over the contractual term. Larger or more complex imp lementations such as software - enabled connected devices for Central Pharmacy, including but not limited to our Central Pharmacy Dispensing Service and IV Compounding Service, are often installed and recognized as revenue between 12 and 24 months after booking. We consider backlo g t hat is expected to be converted to revenues in more than twelve months to be long - term backlog. We believe a majority of long - term product backl og will be convertible into revenues in 12 to 24 months. Long - term SaaS and Expert Services backlog typically represents multi - year subscri ption agreements (usually with contractual terms of 2 to 7 years, some of which have not yet been implemented) that will be converted to reven ue over the contractual term. Due to industry practice that allows customers to change order configurations with limited advance notice prior to ship men t and as customer installation schedules may change, backlog as of any particular date may not necessarily indicate the timing of future revenu e. However, we do believe that backlog is an indication of a customer’s willingness to install our solutions and revenue we expect to generate over tim e.
© 2025 Omnicell, Inc. 36 Glossary of Terms Continued Investor Presentation – February 6, 2025 Product Bookings: (New Metric for 2025): We define product bookings generally as the value of non - cancelable contracts for our connected devices and software licenses. We typically exclude freight revenue and other less significant items ancillary to our products from p rod uct bookings. In addition, dependent upon counterparty or credit risk, which is evaluated at the time of contract signing, for a given multi - year subscription contract we may reduce the value of the contractual commitment booked at a given time. Connected devices and software license bookings ar e r ecorded as revenue upon customer acceptance of the installation or receipt of goods. We utilize product bookings as an indicator of the suc cess of certain portions of our business that generate non - recurring revenue. Annual Recurring Revenue (ARR) (New Metric for 2025): We consider revenues generated from our consumables, technical services, and SaaS and Expert Services to be recurring revenues. For the portions of our business which generate recurring revenues, we utilize ARR as a key metric to measure our progress in growing our recurring revenue business. We define ARR at a measurement date as the revenue we expect to receive from our customers over the course of the following year for providing them with products or services. ARR includes expected revenue f rom all customers who are using our products or services at the reported date. For technical services and SaaS and Expert Services, solutions are g ene rally on a contractual basis, typically with contracts for a period of 12 months or more, with a high probability of renewal. Probability of renewal is based on historic renewal experience of the individual revenue streams or management’s best estimates if historical renewal experience is not available . C onsumables orders are placed by customers through our Omnicell Storefront online platform or through written or telephonic orders and are sold to a cu stomer base who utilize the consumable product and place recurring orders when customer inventory is depleted. ARR is generally calculated ba sed on revenues received in the most recent quarter and changes to expected revenues where solutions were added to or removed from the instal l o r customer base in the quarter. Revenues from technical services and SaaS and Expert Services are recorded ratably over the service term. Revenu e f rom consumables are recorded when the product has shipped and title has passed. Our measure of ARR may be different than that used by other compa nie s. Because ARR is based on expected future revenue, it does not represent revenue recognized during a particular reporting period or revenue to be recognized in future reporting periods. ARR should not be viewed as a substitute for GAAP revenues.

v3.25.0.1
| X |
- DefinitionBoolean flag that is true when the XBRL content amends previously-filed or accepted submission.
| Name: |
dei_AmendmentFlag |
| Namespace Prefix: |
dei_ |
| Data Type: |
xbrli:booleanItemType |
| Balance Type: |
na |
| Period Type: |
duration |
|
| X |
- DefinitionFor the EDGAR submission types of Form 8-K: the date of the report, the date of the earliest event reported; for the EDGAR submission types of Form N-1A: the filing date; for all other submission types: the end of the reporting or transition period. The format of the date is YYYY-MM-DD.
| Name: |
dei_DocumentPeriodEndDate |
| Namespace Prefix: |
dei_ |
| Data Type: |
xbrli:dateItemType |
| Balance Type: |
na |
| Period Type: |
duration |
|
| X |
- DefinitionThe type of document being provided (such as 10-K, 10-Q, 485BPOS, etc). The document type is limited to the same value as the supporting SEC submission type, or the word 'Other'.
| Name: |
dei_DocumentType |
| Namespace Prefix: |
dei_ |
| Data Type: |
dei:submissionTypeItemType |
| Balance Type: |
na |
| Period Type: |
duration |
|
| X |
- DefinitionAddress Line 1 such as Attn, Building Name, Street Name
| Name: |
dei_EntityAddressAddressLine1 |
| Namespace Prefix: |
dei_ |
| Data Type: |
xbrli:normalizedStringItemType |
| Balance Type: |
na |
| Period Type: |
duration |
|
| X |
- Definition
+ References
+ Details
| Name: |
dei_EntityAddressCityOrTown |
| Namespace Prefix: |
dei_ |
| Data Type: |
xbrli:normalizedStringItemType |
| Balance Type: |
na |
| Period Type: |
duration |
|
| X |
- DefinitionCode for the postal or zip code
| Name: |
dei_EntityAddressPostalZipCode |
| Namespace Prefix: |
dei_ |
| Data Type: |
xbrli:normalizedStringItemType |
| Balance Type: |
na |
| Period Type: |
duration |
|
| X |
- DefinitionName of the state or province.
| Name: |
dei_EntityAddressStateOrProvince |
| Namespace Prefix: |
dei_ |
| Data Type: |
dei:stateOrProvinceItemType |
| Balance Type: |
na |
| Period Type: |
duration |
|
| X |
- DefinitionA unique 10-digit SEC-issued value to identify entities that have filed disclosures with the SEC. It is commonly abbreviated as CIK. Reference 1: http://www.xbrl.org/2003/role/presentationRef
-Publisher SEC
-Name Exchange Act
-Number 240
-Section 12
-Subsection b-2
| Name: |
dei_EntityCentralIndexKey |
| Namespace Prefix: |
dei_ |
| Data Type: |
dei:centralIndexKeyItemType |
| Balance Type: |
na |
| Period Type: |
duration |
|
| X |
- DefinitionIndicate if registrant meets the emerging growth company criteria. Reference 1: http://www.xbrl.org/2003/role/presentationRef
-Publisher SEC
-Name Exchange Act
-Number 240
-Section 12
-Subsection b-2
| Name: |
dei_EntityEmergingGrowthCompany |
| Namespace Prefix: |
dei_ |
| Data Type: |
xbrli:booleanItemType |
| Balance Type: |
na |
| Period Type: |
duration |
|
| X |
- DefinitionCommission file number. The field allows up to 17 characters. The prefix may contain 1-3 digits, the sequence number may contain 1-8 digits, the optional suffix may contain 1-4 characters, and the fields are separated with a hyphen.
| Name: |
dei_EntityFileNumber |
| Namespace Prefix: |
dei_ |
| Data Type: |
dei:fileNumberItemType |
| Balance Type: |
na |
| Period Type: |
duration |
|
| X |
- DefinitionTwo-character EDGAR code representing the state or country of incorporation.
| Name: |
dei_EntityIncorporationStateCountryCode |
| Namespace Prefix: |
dei_ |
| Data Type: |
dei:edgarStateCountryItemType |
| Balance Type: |
na |
| Period Type: |
duration |
|
| X |
- DefinitionThe exact name of the entity filing the report as specified in its charter, which is required by forms filed with the SEC. Reference 1: http://www.xbrl.org/2003/role/presentationRef
-Publisher SEC
-Name Exchange Act
-Number 240
-Section 12
-Subsection b-2
| Name: |
dei_EntityRegistrantName |
| Namespace Prefix: |
dei_ |
| Data Type: |
xbrli:normalizedStringItemType |
| Balance Type: |
na |
| Period Type: |
duration |
|
| X |
- DefinitionThe Tax Identification Number (TIN), also known as an Employer Identification Number (EIN), is a unique 9-digit value assigned by the IRS. Reference 1: http://www.xbrl.org/2003/role/presentationRef
-Publisher SEC
-Name Exchange Act
-Number 240
-Section 12
-Subsection b-2
| Name: |
dei_EntityTaxIdentificationNumber |
| Namespace Prefix: |
dei_ |
| Data Type: |
dei:employerIdItemType |
| Balance Type: |
na |
| Period Type: |
duration |
|
| X |
- DefinitionLocal phone number for entity.
| Name: |
dei_LocalPhoneNumber |
| Namespace Prefix: |
dei_ |
| Data Type: |
xbrli:normalizedStringItemType |
| Balance Type: |
na |
| Period Type: |
duration |
|
| X |
- DefinitionBoolean flag that is true when the Form 8-K filing is intended to satisfy the filing obligation of the registrant as pre-commencement communications pursuant to Rule 13e-4(c) under the Exchange Act. Reference 1: http://www.xbrl.org/2003/role/presentationRef
-Publisher SEC
-Name Exchange Act
-Number 240
-Section 13e
-Subsection 4c
| Name: |
dei_PreCommencementIssuerTenderOffer |
| Namespace Prefix: |
dei_ |
| Data Type: |
xbrli:booleanItemType |
| Balance Type: |
na |
| Period Type: |
duration |
|
| X |
- DefinitionBoolean flag that is true when the Form 8-K filing is intended to satisfy the filing obligation of the registrant as pre-commencement communications pursuant to Rule 14d-2(b) under the Exchange Act. Reference 1: http://www.xbrl.org/2003/role/presentationRef
-Publisher SEC
-Name Exchange Act
-Number 240
-Section 14d
-Subsection 2b
| Name: |
dei_PreCommencementTenderOffer |
| Namespace Prefix: |
dei_ |
| Data Type: |
xbrli:booleanItemType |
| Balance Type: |
na |
| Period Type: |
duration |
|
| X |
- DefinitionTitle of a 12(b) registered security. Reference 1: http://www.xbrl.org/2003/role/presentationRef
-Publisher SEC
-Name Exchange Act
-Number 240
-Section 12
-Subsection b
| Name: |
dei_Security12bTitle |
| Namespace Prefix: |
dei_ |
| Data Type: |
dei:securityTitleItemType |
| Balance Type: |
na |
| Period Type: |
duration |
|
| X |
- DefinitionName of the Exchange on which a security is registered. Reference 1: http://www.xbrl.org/2003/role/presentationRef
-Publisher SEC
-Name Exchange Act
-Number 240
-Section 12
-Subsection d1-1
| Name: |
dei_SecurityExchangeName |
| Namespace Prefix: |
dei_ |
| Data Type: |
dei:edgarExchangeCodeItemType |
| Balance Type: |
na |
| Period Type: |
duration |
|
| X |
- DefinitionBoolean flag that is true when the Form 8-K filing is intended to satisfy the filing obligation of the registrant as soliciting material pursuant to Rule 14a-12 under the Exchange Act. Reference 1: http://www.xbrl.org/2003/role/presentationRef
-Publisher SEC
-Name Exchange Act
-Section 14a
-Number 240
-Subsection 12
| Name: |
dei_SolicitingMaterial |
| Namespace Prefix: |
dei_ |
| Data Type: |
xbrli:booleanItemType |
| Balance Type: |
na |
| Period Type: |
duration |
|
| X |
- DefinitionTrading symbol of an instrument as listed on an exchange.
| Name: |
dei_TradingSymbol |
| Namespace Prefix: |
dei_ |
| Data Type: |
dei:tradingSymbolItemType |
| Balance Type: |
na |
| Period Type: |
duration |
|
| X |
- DefinitionBoolean flag that is true when the Form 8-K filing is intended to satisfy the filing obligation of the registrant as written communications pursuant to Rule 425 under the Securities Act. Reference 1: http://www.xbrl.org/2003/role/presentationRef
-Publisher SEC
-Name Securities Act
-Number 230
-Section 425
| Name: |
dei_WrittenCommunications |
| Namespace Prefix: |
dei_ |
| Data Type: |
xbrli:booleanItemType |
| Balance Type: |
na |
| Period Type: |
duration |
|
Omnicell (NASDAQ:OMCL)
Historical Stock Chart
From Jan 2025 to Feb 2025

Omnicell (NASDAQ:OMCL)
Historical Stock Chart
From Feb 2024 to Feb 2025

