SECURITIES AND EXCHANGE COMMISSION
Washington, D.C. 20549
Form 6-K
REPORT OF
FOREIGN PRIVATE ISSUER
PURSUANT TO RULE 13a-16 OR
15d-16 OF
THE SECURITIES EXCHANGE ACT OF 1934
For the month of May 2024
Commission File Number 1-14926
KT Corporation
(Translation of registrant’s name into English)
90, Buljeong-ro,
Bundang-gu,
Seongnam-si,
Gyeonggi-do,
Korea
(Address of
principal executive offices)
Indicate by check mark whether the registrant files or will file annual reports under cover of Form
20-F or Form 40-F:
Form
20-F ☒ Form 40-F ☐
SIGNATURES
Pursuant to the requirements of the Securities Exchange Act of 1934, the registrant has duly caused this report to be signed on its behalf by
the undersigned, thereunto duly authorized.
|
|
|
| Dated: May 10, 2024 |
| KT Corporation |
|
|
| By: |
|
/s/ Youngkyoon Yun |
| Name: Youngkyoon Yun |
| Title: Vice President |
|
|
| By: |
|
/s/ Sanghyun Cho |
| Name: Sanghyun Cho |
| Title: Director |
1Q24 Earnings Release

Disclaimer This presentation has been prepared by KT Corp.(the
“Company”) in accordance with K-IFRS. This presentation contains forward-looking statements, which are subject to risks, uncertainties, and assumptions. This presentation is being presented solely for your information and is subject to
change without notice. No presentation or warranty, expressed or implied, is made and no reliance should be placed on the accuracy, actuality, fairness, or completeness of the information presented. If you have any questions related to this
material, please contact the IR department. Tel: +82-70-4193-4036 2
2 Financial Highlights 3 Business Overview 4 Appendix 3
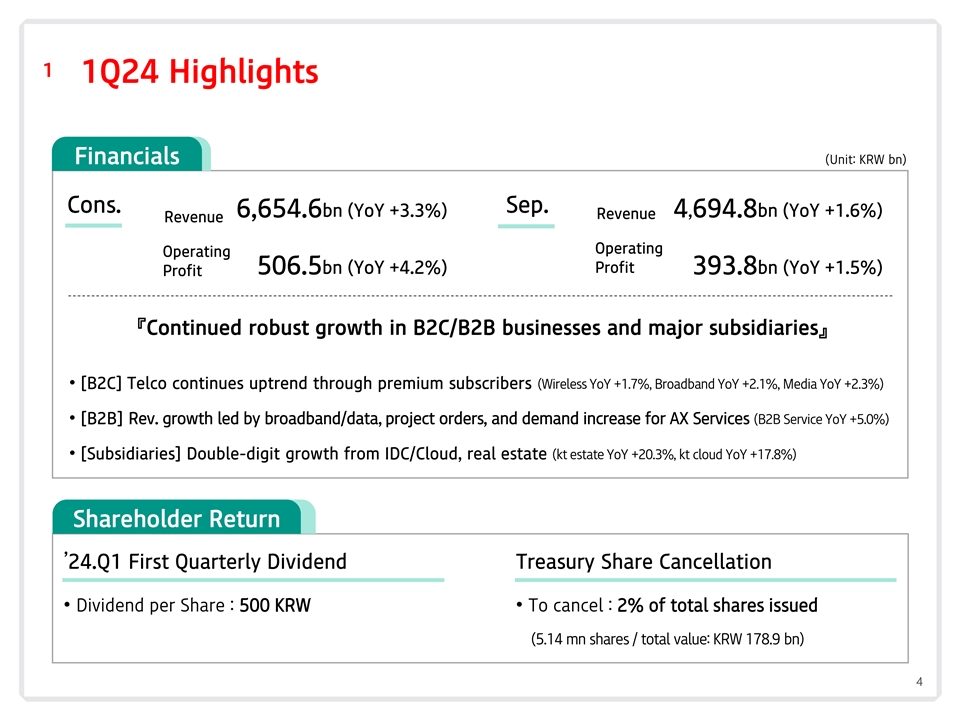
1 1Q24 Highlights Financials (Unit: KRW bn) Cons. Sep. 6,654.6bn (YoY +3.3%)
4,694.8bn (YoY +1.6%) Revenue Revenue Operating Operating 506.5bn (YoY +4.2%) Profit 393.8bn (YoY +1.5%) Profit 『Continued robust growth in B2C/B2B businesses and major subsidiaries』 • [B2C] Telco continues uptrend through
premium subscribers (Wireless YoY +1.7%, Broadband YoY +2.1%, Media YoY +2.3%) • [B2B] Rev. growth led by broadband/data, project orders, and demand increase for AX Services (B2B Service YoY +5.0%) • [Subsidiaries] Double-digit growth
from IDC/Cloud, real estate (kt estate YoY +20.3%, kt cloud YoY +17.8%) Shareholder Return ’24.Q1 First Quarterly Dividend Treasury Share Cancellation • Dividend per Share : 500 KRW• To cancel : 2% of total shares issued (5.14 mn
shares / total value: KRW 178.9 bn) 4
1 1Q24 Highlights 2 Financial Highlights 3 Business Overview 4 Appendix
5

K-IFRS / Consolidated 1 Income Statement • Rev. +3.3% YoY through
growth in both B2C/B2B businesses, Cloud/IDC and real estate • OP +4.2% YoY due to robust fundamentals despite increasing costs due to inflation (Unit: KRW bn) 1Q23 4Q23 1Q24 QoQ YoY Operating Revenue 6,443.7 6,687.6 6,654.6 -0.5% 3.3% 5,597.5
5,720.2 5,722.7 0.0% 2.2% Service Revenue Sale of goods 846.1 967.4 931.9 -3.7% 10.1% Operating Expense 5,957.6 6,422.0 6,148.1 -4.3% 3.2% Operating Income 486.1 265.6 506.5 90.7% 4.2% 7.5% 4.0% 7.6% +3.6%p +0.1%p Margin 1 8.7% 4.6% 8.9% +4.3%p
+0.2%p Margin -48.5 -277.6 22.5 - - Non-op. Income/Loss Income before taxes 437.6 -12.0 529.0 - 20.9% Net Income 309.6 -41.7 393.0 - 26.9% Margin 4.8% -0.6% 5.9% +6.5%p +1.1%p EBITDA 1,415.5 1,279.2 1,480.2 15.7% 4.6% 22.0% 19.1% 22.2% +3.1%p +0.2%p
Margin 1 1) OP Margin = Operating Income/Service Revenue 6

K-IFRS / Consolidated 2 Operating Expenses (Unit: KRW bn) 1Q23 4Q23 1Q24 QoQ
YoY 5,957.6 6,422.0 6,148.1 -4.3% 3.2% Operating Expenses Labor Cost 1,069.1 1,157.8 1,100.9 -4.9% 3.0% General Expense 2,604.0 2,843.7 2,674.2 -6.0% 2.7% 929.4 1,013.6 973.7 -3.9% 4.8% - Depreciation Cost of Service 717.3 725.5 726.5 0.1% 1.3%
Selling Expense 600.9 645.9 599.6 -7.2% -0.2% 966.3 1,049.1 1,046.9 -0.2% 8.3% Cost of Goods sold [Selling Expense (KT Separate) (Unit: KRW bn) ] 1Q23 4Q23 1Q24 QoQ YoY Selling Expense 626.1 644.2 620.6 -3.7% -0.9% 7
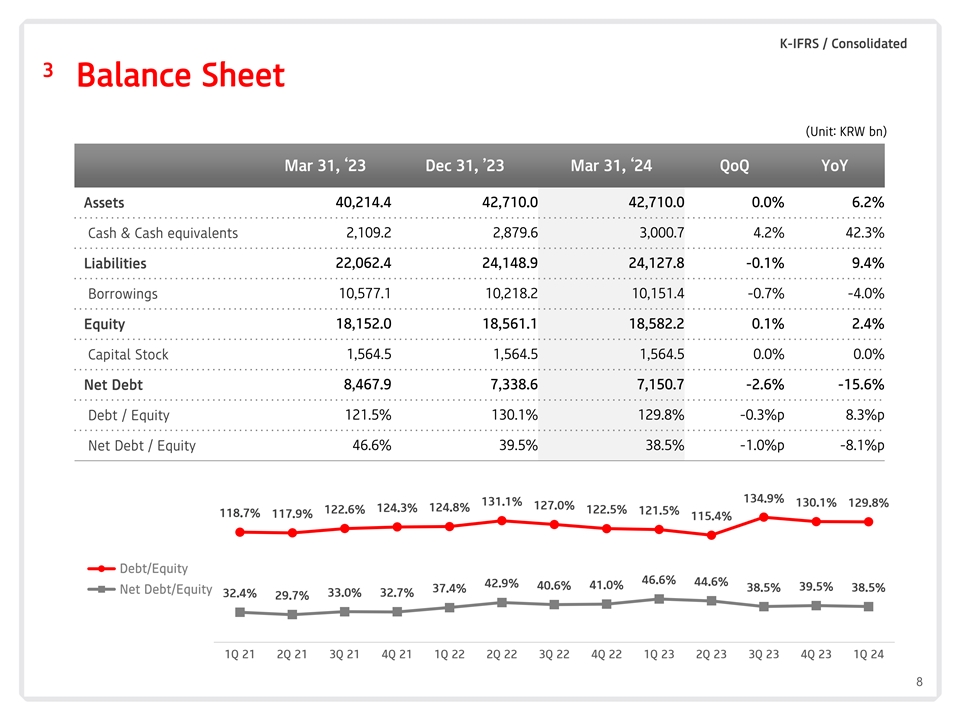
K-IFRS / Consolidated 3 Balance Sheet (Unit: KRW bn) Mar 31, ‘23 Dec
31, ’23 Mar 31, ‘24 QoQ YoY Assets 40,214.4 42,710.0 42,710.0 0.0% 6.2% 2,109.2 2,879.6 3,000.7 4.2% 42.3% Cash & Cash equivalents 22,062.4 24,148.9 24,127.8 -0.1% 9.4% Liabilities Borrowings 10,577.1 10,218.2 10,151.4 -0.7% -4.0%
Equity 18,152.0 18,561.1 18,582.2 0.1% 2.4% Capital Stock 1,564.5 1,564.5 1,564.5 0.0% 0.0% 8,467.9 7,338.6 7,150.7 -2.6% -15.6% Net Debt Debt / Equity 121.5% 130.1% 129.8% -0.3%p 8.3%p Net Debt / Equity 46.6% 39.5% 38.5% -1.0%p -8.1%p 134.9% 131.1%
130.1% 129.8% 127.0% 124.3% 124.8% 122.6% 122.5% 121.5% 118.7% 117.9% 115.4% Debt/ 부채비율 Equity 46.6% 44.6% 42.9% 41.0% 40.6% 39.5% 38.5% 38.5% 순부채비율 37.4% Net Debt/Equity 32.4% 33.0%
32.7% 29.7% 1Q 21 2Q 21 3Q 21 4Q 21 1Q 22 2Q 22 3Q 22 4Q 22 1Q 23 2Q 23 3Q 23 4Q 23 1Q 24 8
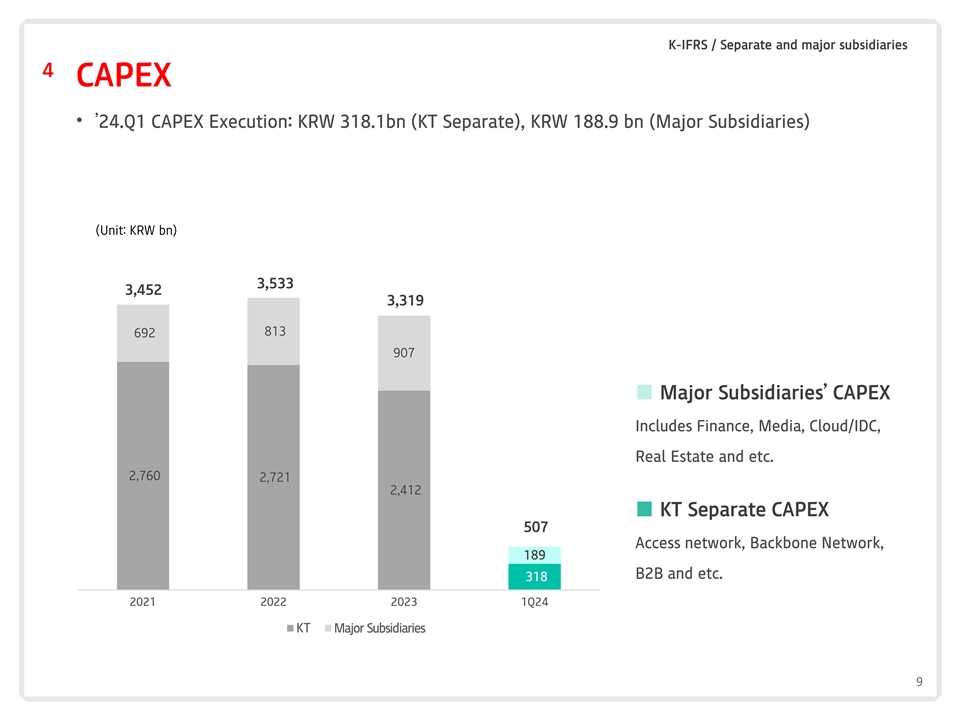
K-IFRS / Separate and major subsidiaries 4 CAPEX • ’24.Q1 CAPEX
Execution: KRW 318.1bn (KT Separate), KRW 188.9 bn (Major Subsidiaries) (Unit: KRW bn) 3,533 3,452 3,319 813 692 907 ■ Major Subsidiaries’ CAPEX Includes Finance, Media, Cloud/IDC, Real Estate and etc. 2,760 2,721 2,412 ■ KT
Separate CAPEX 507 Access network, Backbone Network, 189 B2B and etc. 318 2021 2022 2023 1Q24 KT 주요 Major 그룹사 Subsidiaries 9
1 1Q24 Highlights 2 Financial Highlights 3 Business Overview 4 Appendix
10

K-IFRS / Separate 1 KT - Wireless • Wireless rev. +1.7% YoY, with 5G
penetration reaching 74% and increased roaming revenue • Continued efforts to enhance services through 5G online-only plans, OTT subscription services, etc. (Unit: KRW bn) 1Q23 4Q23 1Q24 QoQ YoY Wireless 1,707.2 1,732.2 1,736.5 0.3% 1.7%
Wireless Service 1,618.6 1,646.4 1,649.8 0.2% 1.9% Interconnection 88.6 85.7 86.7 1.1% -2.1% 24,834 24,897 24,903 24,621 24,332 Wireless Subscribers (Unit: Thousands) 9,408 9,117 9,722 8,796 9,948 Handset(5G) (exc. 5G) Handset(5G외) 4,183
3,795 4,528 3,519 2nd device & IoT 4,921 MVNO 4,144 4,242 4,276 3,998 3,788 7,168 7,138 7,091 6,827 6,978 1Q23 2Q23 3Q23 4Q23 1Q24 11
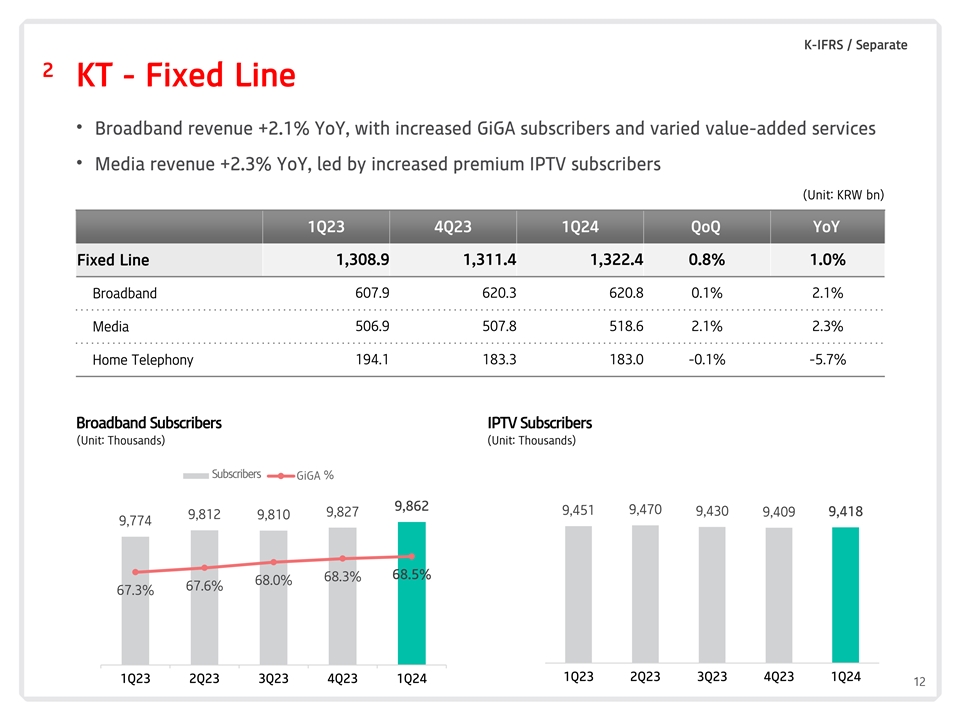
K-IFRS / Separate 2 KT - Fixed Line • Broadband revenue +2.1% YoY,
with increased GiGA subscribers and varied value-added services • Media revenue +2.3% YoY, led by increased premium IPTV subscribers (Unit: KRW bn) 1Q23 4Q23 1Q24 QoQ YoY Fixed Line 1,308.9 1,311.4 1,322.4 0.8% 1.0% Broadband 607.9 620.3 620.8
0.1% 2.1% Media 506.9 507.8 518.6 2.1% 2.3% Home Telephony 194.1 183.3 183.0 -0.1% -5.7% Broadband Subscribers IPTV Subscribers (Unit: Thousands) (Unit: Thousands) Subscribers 가입자수 GiGA % 비중(%) 10,000 9,862
9,470 9,451 9,430 9,418 9,827 9,409 9,812 9,810 9,774 68.5% 68.3% 68.0% 9,500 67.6% 67.3% 9,000 1Q23 2Q23 3Q23 4Q23 1Q24 1Q23 2Q23 3Q23 4Q23 1Q24 12
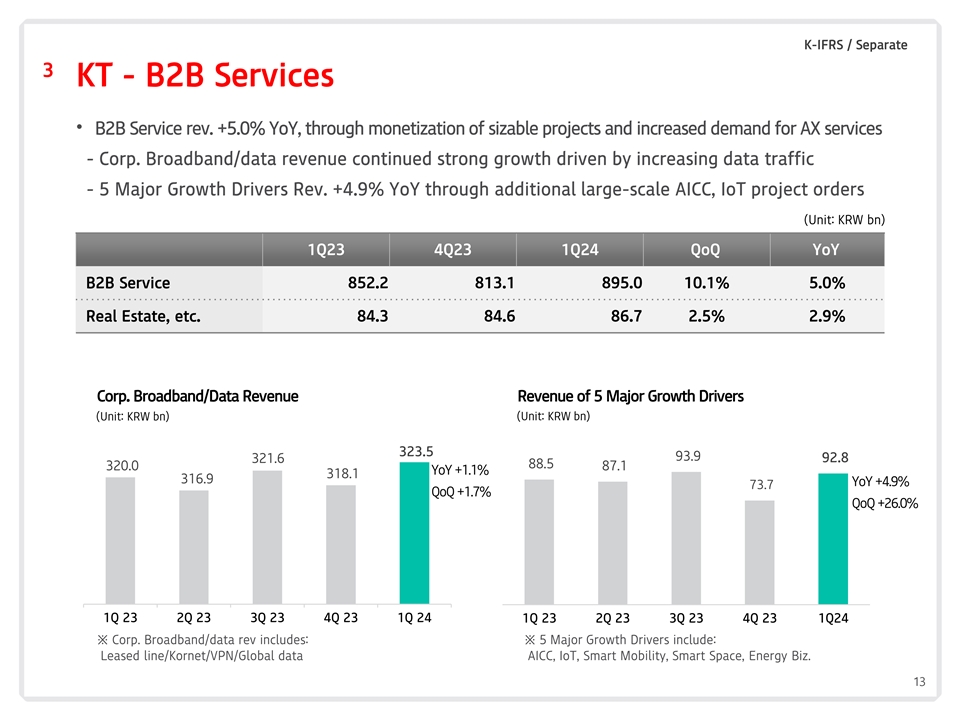
K-IFRS / Separate 3 KT - B2B Services • B2B Service rev. +5.0% YoY,
through monetization of sizable projects and increased demand for AX services - Corp. Broadband/data revenue continued strong growth driven by increasing data traffic - 5 Major Growth Drivers Rev. +4.9% YoY through additional large-scale AICC, IoT
project orders (Unit: KRW bn) 1Q23 4Q23 1Q24 QoQ YoY B2B Service 852.2 813.1 895.0 10.1% 5.0% Real Estate, etc. 84.3 84.6 86.7 2.5% 2.9% Corp. Broadband/Data Revenue Revenue of 5 Major Growth Drivers (Unit: KRW bn) (Unit: KRW bn) 323.5 93.9 92.8
321.6 88.5 320.0 87.1 YoY +1.1% 318.1 316.9 YoY +4.9% 73.7 QoQ +1.7% QoQ +26.0% 1Q 23 2Q 23 3Q 23 4Q 23 1Q 24 1Q 23 2Q 23 3Q 23 4Q 23 1Q24 ※ Corp. Broadband/data rev includes: ※ 5 Major Growth Drivers include: Leased
line/Kornet/VPN/Global data AICC, IoT, Smart Mobility, Smart Space, Energy Biz. 13
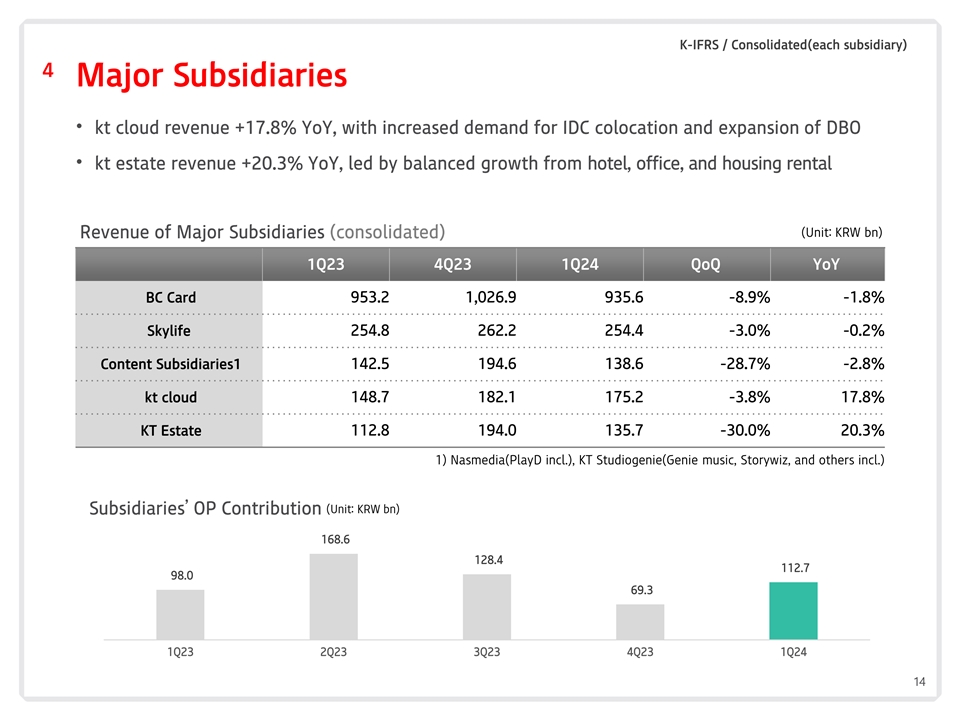
K-IFRS / Consolidated(each subsidiary) 4 Major Subsidiaries • kt
cloud revenue +17.8% YoY, with increased demand for IDC colocation and expansion of DBO • kt estate revenue +20.3% YoY, led by balanced growth from hotel, office, and housing rental (Unit: KRW bn) Revenue of Major Subsidiaries (consolidated)
1Q23 4Q23 1Q24 QoQ YoY BC Card 953.2 1,026.9 935.6 -8.9% -1.8% Skylife 254.8 262.2 254.4 -3.0% -0.2% Content Subsidiaries1 142.5 194.6 138.6 -28.7% -2.8% kt cloud 148.7 182.1 175.2 -3.8% 17.8% KT Estate 112.8 194.0 135.7 -30.0% 20.3% 1)
Nasmedia(PlayD incl.), KT Studiogenie(Genie music, Storywiz, and others incl.) (Unit: KRW bn) Subsidiaries’ OP Contribution 168.6 128.4 112.7 98.0 69.3 1Q23 2Q23 3Q23 4Q23 1Q24 14
1 1Q24 Highlights 2 Financial Highlights 3 Business Overview 4 Appendix
15
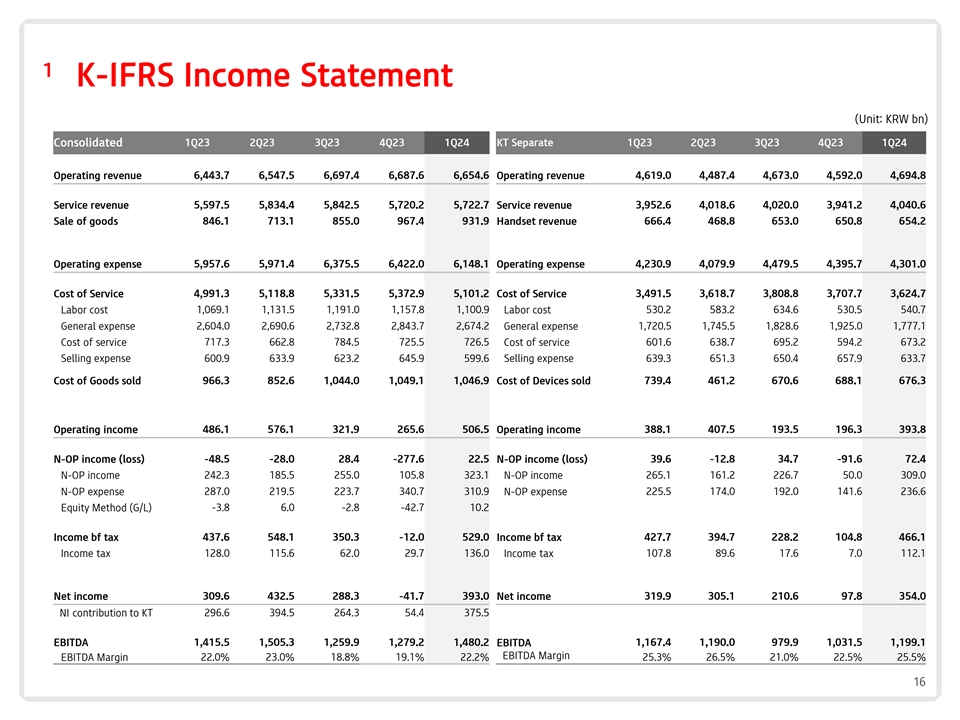
1 K-IFRS Income Statement (Unit: KRW bn) Consolidated 1Q23 2Q23 3Q23 4Q23
1Q24 KT Separate 1Q23 2Q23 3Q23 4Q23 1Q24 Operating revenue 6,443.7 6,547.5 6,697.4 6,687.6 6,654.6 Operating revenue 4,619.0 4,487.4 4,673.0 4,592.0 4,694.8 Service revenue 5,597.5 5,834.4 5,842.5 5,720.2 5,722.7 Service revenue 3,952.6 4,018.6
4,020.0 3,941.2 4,040.6 Sale of goods 846.1 713.1 855.0 967.4 931.9 Handset revenue 666.4 468.8 653.0 650.8 654.2 Operating expense 5,957.6 5,971.4 6,375.5 6,422.0 6,148.1 Operating expense 4,230.9 4,079.9 4,479.5 4,395.7 4,301.0 4,991.3 5,118.8
5,331.5 5,372.9 5,101.2 3,491.5 3,618.7 3,808.8 3,707.7 3,624.7 Cost of Service Cost of Service 1,069.1 1,131.5 1,191.0 1,157.8 1,100.9 530.2 583.2 634.6 530.5 540.7 Labor cost Labor cost General expense 2,604.0 2,690.6 2,732.8 2,843.7 2,674.2
General expense 1,720.5 1,745.5 1,828.6 1,925.0 1,777.1 Cost of service 717.3 662.8 784.5 725.5 726.5 Cost of service 601.6 638.7 695.2 594.2 673.2 Selling expense 600.9 633.9 623.2 645.9 599.6 Selling expense 639.3 651.3 650.4 657.9 633.7 Cost of
Goods sold 966.3 852.6 1,044.0 1,049.1 1,046.9 Cost of Devices sold 739.4 461.2 670.6 688.1 676.3 Operating income 486.1 576.1 321.9 265.6 506.5 Operating income 388.1 407.5 193.5 196.3 393.8 -48.5 -28.0 28.4 -277.6 22.5 39.6 -12.8 34.7 -91.6 72.4
N-OP income (loss) N-OP income (loss) N-OP income 242.3 185.5 255.0 105.8 323.1 N-OP income 265.1 161.2 226.7 50.0 309.0 N-OP expense 287.0 219.5 223.7 340.7 310.9 N-OP expense 225.5 174.0 192.0 141.6 236.6 Equity Method (G/L) -3.8 6.0 -2.8 -42.7
10.2 Income bf tax 437.6 548.1 350.3 -12.0 529.0 Income bf tax 427.7 394.7 228.2 104.8 466.1 Income tax 128.0 115.6 62.0 29.7 136.0 Income tax 107.8 89.6 17.6 7.0 112.1 309.6 432.5 288.3 -41.7 393.0 319.9 305.1 210.6 97.8 354.0 Net income Net income
NI contribution to KT 296.6 394.5 264.3 54.4 375.5 EBITDA 1,415.5 1,505.3 1,259.9 1,279.2 1,480.2 EBITDA 1,167.4 1,190.0 979.9 1,031.5 1,199.1 EBITDA Margin EBITDA Margin 22.0% 23.0% 18.8% 19.1% 22.2% 25.3% 26.5% 21.0% 22.5% 25.5% 16
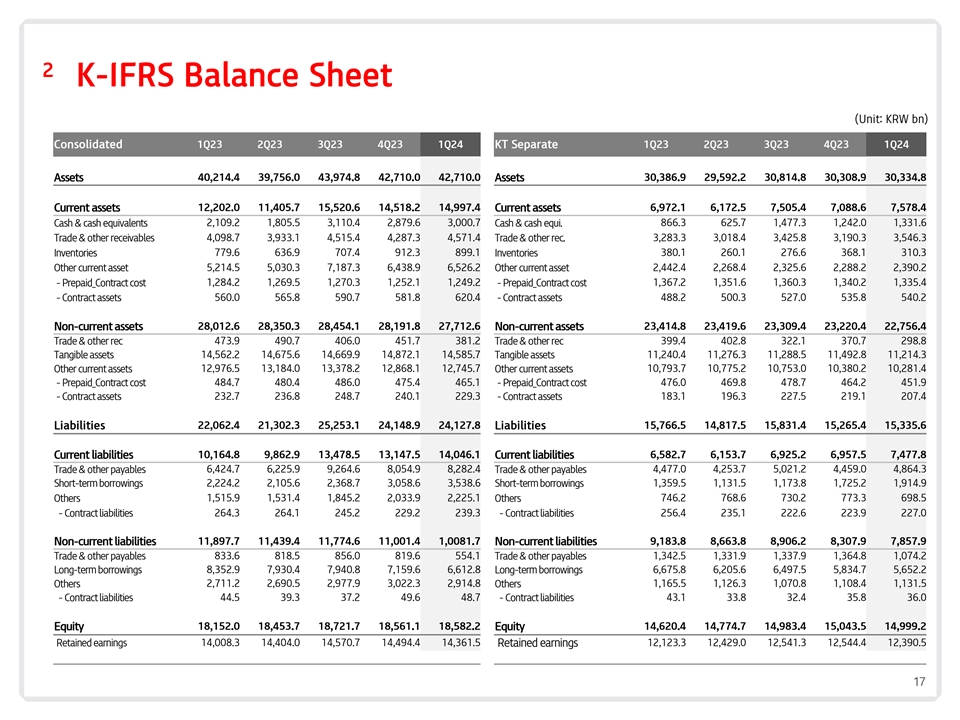
2 K-IFRS Balance Sheet (Unit: KRW bn) Consolidated 1Q23 2Q23 3Q23 4Q23 1Q24
KT Separate 1Q23 2Q23 3Q23 4Q23 1Q24 40,214.4 39,756.0 43,974.8 42,710.0 42,710.0 30,386.9 29,592.2 30,814.8 30,308.9 30,334.8 Assets Assets Current assets 12,202.0 11,405.7 15,520.6 14,518.2 14,997.4 Current assets 6,972.1 6,172.5 7,505.4 7,088.6
7,578.4 2,109.2 1,805.5 3,110.4 2,879.6 3,000.7 866.3 625.7 1,477.3 1,242.0 1,331.6 Cash & cash equivalents Cash & cash equi. 4,098.7 3,933.1 4,515.4 4,287.3 4,571.4 3,283.3 3,018.4 3,425.8 3,190.3 3,546.3 Trade & other receivables Trade
& other rec. Inventories 779.6 636.9 707.4 912.3 899.1 Inventories 380.1 260.1 276.6 368.1 310.3 Other current asset 5,214.5 5,030.3 7,187.3 6,438.9 6,526.2 Other current asset 2,442.4 2,268.4 2,325.6 2,288.2 2,390.2 - Prepaid_Contract cost
1,284.2 1,269.5 1,270.3 1,252.1 1,249.2 - Prepaid_Contract cost 1,367.2 1,351.6 1,360.3 1,340.2 1,335.4 560.0 565.8 590.7 581.8 620.4 488.2 500.3 527.0 535.8 540.2 - Contract assets - Contract assets Non-current assets 28,012.6 28,350.3 28,454.1
28,191.8 27,712.6 Non-current assets 23,414.8 23,419.6 23,309.4 23,220.4 22,756.4 Trade & other rec 473.9 490.7 406.0 451.7 381.2 Trade & other rec 399.4 402.8 322.1 370.7 298.8 Tangible assets 14,562.2 14,675.6 14,669.9 14,872.1 14,585.7
Tangible assets 11,240.4 11,276.3 11,288.5 11,492.8 11,214.3 Other current assets 12,976.5 13,184.0 13,378.2 12,868.1 12,745.7 Other current assets 10,793.7 10,775.2 10,753.0 10,380.2 10,281.4 - Prepaid_Contract cost 484.7 480.4 486.0 475.4 465.1 -
Prepaid_Contract cost 476.0 469.8 478.7 464.2 451.9 232.7 236.8 248.7 240.1 229.3 183.1 196.3 227.5 219.1 207.4 - Contract assets - Contract assets 22,062.4 21,302.3 25,253.1 24,148.9 24,127.8 15,766.5 14,817.5 15,831.4 15,265.4 15,335.6 Liabilities
Liabilities 10,164.8 9,862.9 13,478.5 13,147.5 14,046.1 6,582.7 6,153.7 6,925.2 6,957.5 7,477.8 Current liabilities Current liabilities Trade & other payables 6,424.7 6,225.9 9,264.6 8,054.9 8,282.4 Trade & other payables 4,477.0 4,253.7
5,021.2 4,459.0 4,864.3 2,224.2 2,105.6 2,368.7 3,058.6 3,538.6 1,359.5 1,131.5 1,173.8 1,725.2 1,914.9 Short-term borrowings Short-term borrowings Others 1,515.9 1,531.4 1,845.2 2,033.9 2,225.1 Others 746.2 768.6 730.2 773.3 698.5 - Contract
liabilities 264.3 264.1 245.2 229.2 239.3 - Contract liabilities 256.4 235.1 222.6 223.9 227.0 11,897.7 11,439.4 11,774.6 11,001.4 1,0081.7 9,183.8 8,663.8 8,906.2 8,307.9 7,857.9 Non-current liabilities Non-current liabilities Trade & other
payables 833.6 818.5 856.0 819.6 554.1 Trade & other payables 1,342.5 1,331.9 1,337.9 1,364.8 1,074.2 8,352.9 7,930.4 7,940.8 7,159.6 6,612.8 6,675.8 6,205.6 6,497.5 5,834.7 5,652.2 Long-term borrowings Long-term borrowings Others 2,711.2
2,690.5 2,977.9 3,022.3 2,914.8 Others 1,165.5 1,126.3 1,070.8 1,108.4 1,131.5 - Contract liabilities 44.5 39.3 37.2 49.6 48.7 - Contract liabilities 43.1 33.8 32.4 35.8 36.0 Equity 18,152.0 18,453.7 18,721.7 18,561.1 18,582.2 Equity 14,620.4
14,774.7 14,983.4 15,043.5 14,999.2 Retained earnings 14,008.3 14,404.0 14,570.7 14,494.4 14,361.5 12,123.3 12,429.0 12,541.3 12,544.4 12,390.5 Retained earnings 17

K-IFRS / Separate 3 Subscribers (Unit: Thousands) Wireless Subscribers 1Q
23 2Q 23 3Q 23 4Q 23 1Q 24 QoQ YoY Total 24,332 24,621 24,903 24,897 24,834 -0.3% 2.1% - MNO 17,505 17,643 17,735 17,759 17,743 -0.1% 1.4% - MVNO 6,827 6,978 7,168 7,138 7,091 -0.7% 3.9% 1) 5G Handset 8,796 9,117 9,408 9,722 9,948 2.3% 13.1% 2)
Churn rate 1.0% 1.0% 1.1% 1.1% 1.1% 0.0%p 0.1%p 3) ARPU (KRW) 33,771 33,948 33,838 34,302 34,461 0.5% 2.0% nd 1) 5G Handset : Retroactively applied from 1Q23 based on the change of subscriber disclosure criteria by the MSIT (excludes 5G 2 Device and
5G IoT) 2) Churn rate : Based on MNO subscribers (excludes IoT) 3) ARPU = Wireless revenue* / Wireless subscribers** * Wireless revenue(3G, LTE, 5G incl.): Revenue of Voice/Data usage (Interconnection/Subscription fee exc.), VAS, Contract/ Bundled
Discounts, and etc. incl. ** Wireless subscribers: Based on MSIT’s guidelines for average billed subscribers in quarter (IoT/M2M exc.) (Unit: Thousands) Fixed Line Subscribers 1Q 23 2Q 23 3Q 23 4Q 23 1Q 24 QoQ YoY Telephony 12,445 12,310
12,184 12,035 11,903 -1.1% -4.4% - PSTN 9,226 9,089 8,960 8,820 8,673 -1.7% -6.0% - VoIP 3,219 3,221 3,225 3,215 3,230 0.5% 0.3% Broadband 9,774 9,812 9,810 9,827 9,862 0.4% 0.9% IPTV (GTV+GTS) 9,451 9,470 9,430 9,409 9,418 0.1% -0.4% ※ Number
of IPTV subscribers above differs from MSIT figures that follow the IPTV law - Number of KT pay TV subscribers in 1H 2023 is 8,865,968 (6-month average) 18

KT (NYSE:KT)
Historical Stock Chart
From Nov 2024 to Dec 2024

KT (NYSE:KT)
Historical Stock Chart
From Dec 2023 to Dec 2024

