Form NPORT-P - Monthly Portfolio Investments Report on Form N-PORT (Public)
October 28 2024 - 3:27PM
Edgar (US Regulatory)
KAYNE ANDERSON ENERGY INFRASTRUCTURE FUND, INC.
SCHEDULE OF INVESTMENTS
AUGUST 31, 2024
(amounts in 000’s)
(UNAUDITED)
|
Description
|
|
No. of
Shares/Units
|
|
Value
|
|
Long-Term Investments — 139.7%
|
|
|
|
|
|
|
Equity Investments(1) — 139.7%
|
|
|
|
|
|
|
Midstream Energy Company(2) — 129.7%
|
|
|
|
|
|
|
Antero Midstream Corporation
|
|
2,218
|
|
$
|
32,988
|
|
Archrock, Inc.
|
|
1,132
|
|
|
22,900
|
|
Aris Water Solutions, Inc.
|
|
745
|
|
|
12,535
|
|
Cheniere Energy, Inc.
|
|
1,016
|
|
|
188,285
|
|
DT Midstream, Inc.
|
|
531
|
|
|
41,731
|
|
Enbridge Inc.(3)
|
|
2,977
|
|
|
119,615
|
|
Energy Transfer LP
|
|
17,059
|
|
|
274,650
|
|
Enterprise Products Partners L.P.
|
|
8,955
|
|
|
262,747
|
|
Hess Midstream LP
|
|
1,474
|
|
|
55,067
|
|
Kinder Morgan, Inc.
|
|
7,545
|
|
|
162,750
|
|
Kinetik Holdings Inc.
|
|
734
|
|
|
32,482
|
|
MPLX LP
|
|
3,904
|
|
|
167,414
|
|
MPLX LP — Convertible Preferred Units(4)(5)(6)
|
|
2,255
|
|
|
96,711
|
|
ONEOK, Inc.
|
|
2,393
|
|
|
221,057
|
|
Pembina Pipeline Corporation(3)
|
|
3,167
|
|
|
127,561
|
|
Plains All American Pipeline, L.P.
|
|
7,105
|
|
|
127,471
|
|
Sentinel Midstream Highline JV Holdings LLC(4)(5)(7)(8)
|
|
1,500
|
|
|
33,750
|
|
Streamline Innovations Holdings, Inc. — Series C Preferred
Shares(4)(5)(8)(9)(10)
|
|
5,500
|
|
|
35,750
|
|
Targa Resources Corp.
|
|
1,381
|
|
|
202,869
|
|
TC Energy Corporation(3)(11)
|
|
2,222
|
|
|
102,956
|
|
The Williams Companies, Inc.
|
|
6,008
|
|
|
274,986
|
|
Western Midstream Partners, LP
|
|
4,367
|
|
|
168,470
|
| |
|
|
|
|
2,764,745
|
|
Utility Company(2) — 6.2%
|
|
|
|
|
|
|
Entergy Corporation
|
|
202
|
|
|
24,401
|
|
NextEra Energy, Inc.
|
|
554
|
|
|
44,577
|
|
Sempra Energy
|
|
770
|
|
|
63,259
|
| |
|
|
|
|
132,237
|
|
Energy Company(2) — 3.8%
|
|
|
|
|
|
|
Exxon Mobil Corporation
|
|
92
|
|
|
10,887
|
|
Phillips 66
|
|
134
|
|
|
18,751
|
|
Shell plc — ADR(3)(12)
|
|
709
|
|
|
50,815
|
| |
|
|
|
|
80,453
|
|
Total Long-Term Investments — (Cost — $2,411,989)
|
|
|
|
|
2,977,435
|
See accompanying notes to financial statements.
KAYNE ANDERSON ENERGY INFRASTRUCTURE FUND, INC.
SCHEDULE OF INVESTMENTS
AUGUST 31, 2024
(amounts in 000’s)
(UNAUDITED)
|
Description
|
|
No. of
Shares/Units
|
|
Value
|
|
Short-Term Investment — Money Market Fund — 0.1%
|
|
|
|
|
|
|
|
First American Money Market Fund Treasury Obligations Fund — Class X
Shares, 5.17%(13) (Cost — $1,338)
|
|
1,338
|
|
$
|
1,338
|
|
|
Total Investments — 139.8% (Cost — $2,413,327)
|
|
|
|
|
2,978,773
|
|
| |
|
|
|
|
|
|
|
Debt
|
|
|
|
|
(435,432
|
)
|
|
Mandatory Redeemable Preferred Stock at Liquidation Value
|
|
|
|
|
(153,094
|
)
|
|
Current Income Tax Liability, net
|
|
|
|
|
(4,387
|
)
|
|
Deferred Income Tax Liability, net
|
|
|
|
|
(247,354
|
)
|
|
Other Liabilities in Excess of Other Assets
|
|
|
|
|
(7,727
|
)
|
|
Net Assets Applicable to Common Stockholders
|
|
|
|
$
|
2,130,779
|
|
See accompanying notes to financial statements.
KAYNE ANDERSON ENERGY INFRASTRUCTURE FUND, INC.
SCHEDULE OF INVESTMENTS
AUGUST 31, 2024
(amounts in 000’s)
(UNAUDITED)
At August 31, 2024, the Company’s geographic allocation was as follows:
|
Geographic Location
|
|
% of Long-Term
Investments
|
|
United States
|
|
86.5%
|
|
Canada
|
|
11.8%
|
|
Europe/U.K.
|
|
1.7%
|
See accompanying notes to financial statements.
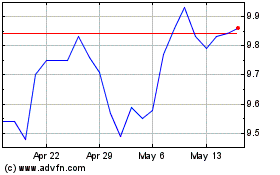
Kayne Anderson Energy In... (NYSE:KYN)
Historical Stock Chart
From Dec 2024 to Jan 2025

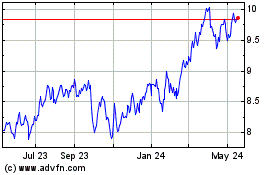
Kayne Anderson Energy In... (NYSE:KYN)
Historical Stock Chart
From Jan 2024 to Jan 2025
