U.S. SECURITIES AND EXCHANGE COMMISSION
Washington, D.C. 20549
FORM 6-K
REPORT OF FOREIGN PRIVATE ISSUER
PURSUANT TO RULE 13a-16 OR 15d-16 UNDER THE
SECURITIES EXCHANGE
ACT OF 1934
For the Month of October 2023
Nexa Resources S.A.
(Exact Name as Specified in its Charter)
N/A
(Translation of Registrant’s Name)
37A, Avenue J.F. Kennedy
L-1855, Luxembourg
Grand Duchy of Luxembourg
(Address of principal executive offices)
Indicate by check mark
whether the registrant files or will file annual reports under cover Form 20-F or Form 40-F.
Indicate by check mark
if the registrant is submitting the Form 6-K in paper as permitted by Regulation S-T Rule 101(b)(1): ____
Indicate by check mark
if the registrant is submitting the Form 6-K in paper as permitted by Regulation S-T Rule 101(b)(7): ____
Indicate by check mark
whether by furnishing the information contained in this Form, the registrant is also thereby furnishing the information to the Commission
pursuant to Rule 12g3-2(b) under the Securities Exchange Act of 1934.
If “Yes” is marked,
indicate below the file number assigned to the registrant in connection with Rule 12g3-2(b): Not applicable.
SIGNATURES
Pursuant to the requirements
of the Securities Exchange Act of 1934, the registrant has duly caused this report to be signed on its behalf by the undersigned, thereunto
duly authorized.
Date: October 30, 2023
| Nexa Resources S.A. |
| By:/s/ José Carlos del Valle |
| Name: José Carlos del Valle |
|
Title: Senior Vice President of
Finance and Group Chief Financial Officer
|
EXHIBIT INDEX

Nexa Reports Third
Quarter 2023 Net Loss of US$63 million and Adjusted EBITDA of US$82 Million
Luxembourg, October
30, 2023 – Nexa Resources S.A. (“Nexa Resources”, “Nexa”, or the “Company”)
announces today its results for the three and nine-month periods ended September 30, 2023.
CEO Message – Ignacio
Rosado
“In 3Q23, there continued to be downward
pressure on metal prices, mainly driven by the persistence of negative external factors, such as inflation in the U.S. leading to still
high interest rates and uncertainties about the performance of key sectors of the Chinese economy (e.g., property). Consequently, the
prices of our main metals remained at levels below our expectations for the period and slightly lower than the previous quarter.
Faced with this challenging metal price
environment, we remain committed to our financial discipline, which includes a portfolio of initiatives focused on cost reduction, CAPEX,
and working capital optimization. Some of these initiatives are still being implemented but have allowed us to improve some line items
in our 2023 guidance. Furthermore, they also contributed to positive cash flow generation in 3Q23.
On the operational side, as disclosed a
week ago, we have revised Aripuanã’s production range downwards for the year, given primarily to the limitations related
to the designed capacity of the flotation pumping system, which also resulted in the extension of the ramp-up phase. However, during 3Q23,
we continued the ramp-up phase in a structured and disciplined manner, maintaining recoveries and improving the concentrate quality and
grades. We are focused on ensuring safe and steady production by processing the zinc concentrate produced in our smelters while expanding
sales of lead and copper concentrates.
With respect to our mineral exploration
plan, we are moving forward with special attention to expanding the resource and mineral reserves base in our current mines. Additionally,
on the growth front, we are making progress with the advanced studies related to the Pasco Integration Project.
Looking ahead, our priorities are the completion
of the Aripuanã ramp-up phase, our capital optimization initiatives and the proactive adoption of appropriate measures to maintain
a healthy balance sheet, such as the reinforcement of our liquidity through the new 5-year sustainability-linked revolving credit facility
of US$320 million, which replaces the previous line that was due to expire in October 2024.
Lastly, we are confident in the long-term
fundamentals of our industry and our business. As always, we will continue to focus on safety, productivity, our ESG commitments, and
cost control to create value for all of our stakeholders.”
Summary of Financial
Performance
| US$ million (except per share amounts) |
3Q23 |
2Q23 |
3Q22 |
9M23 |
9M22 |
| Net revenues |
649 |
627 |
703 |
1,943 |
2,254 |
| Gross profit |
67 |
62 |
85 |
228 |
555 |
| Net income (loss) |
(63) |
(103) |
(40) |
(182) |
158 |
| EBITDA (1) |
67 |
(44) |
111 |
139 |
614 |
| Basic and diluted earnings per share ("EPS") |
(0.56) |
(0.77) |
(0.31) |
(1.48) |
0.99 |
| Adjusted net income (loss) (1) |
(49) |
12 |
(30) |
(34) |
184 |
Earnings Release – 3Q23 |  |
| US$ million (except per share amounts) |
3Q23 |
2Q23 |
3Q22 |
9M23 |
9M22 |
| Adjusted EBITDA (1) |
82 |
72 |
121 |
286 |
640 |
| Adjusted basic and diluted EPS (1) |
(0.43) |
0.04 |
(0.24) |
(0.40) |
1.19 |
| Cash provided by operating activities before working capital (1) (2) |
40 |
51 |
93 |
197 |
561 |
| Capex |
82 |
60 |
85 |
198 |
265 |
| Free cash flows (1) |
14 |
34 |
(87) |
(84) |
(226) |
| Total cash (3) |
422 |
421 |
538 |
422 |
538 |
| Net debt (1) |
1,242 |
1,262 |
1,115 |
1,242 |
1,115 |
| Net Debt/LTM Adj. EBITDA |
3.06x |
2.83x |
1.41x |
3.06x |
1.41x |
(1) Refer
to “Use of Non-IFRS Financial Measures” for further information. Adjusted EBITDA, adjusted net income (loss) and adjusted
EPS, exclude the items presented in the “Net income (loss) reconciliation to Adjusted EBITDA” section for further details
on page 13 of this earnings release. For details on segment definition and accounting policy, please refer to explanatory note 2 –
“Information by business segment” in the “Condensed consolidated interim financial statements (unaudited) at and for
the three and nine-month periods ended on September 30, 2023”.
(2) Working
capital had a positive impact of US$95 million in 3Q23, totaling US$74 million in 9M23. Working capital in 3Q22 had a negative impact
of US$23 million, totaling negative US$203 million in 9M22.
(3) Cash,
cash equivalents and financial investments.
Executive Summary
Operational Performance
| § | Zinc production of 87kt in 3Q23 rose by 15% compared to 3Q22, mainly
explained by the increase in treated ore volume and the beginning of production in the Aripuanã mine. Compared to 2Q23, zinc production
increased by 8%, primarily due to the higher volumes from the Cerro Lindo, Vazante and Morro Agudo mines, in addition to further production
from the Aripuanã ramp-up. |
| § | Run-of-mine mining cost in 3Q23 was US$44/t, up 1% from 3Q22. Compared
to 2Q23, run-of-mine mining cost was relatively flat. |
| § | Mining cash cost net of by-products[1]
in 3Q23 was US$0.35/lb compared with US$0.57/lb in 3Q22. This decrease was primarily
due to higher by-products contribution driven by higher lead prices and higher copper concentrate volumes. Compared to 2Q23, mining cash
cost net of by-products decreased by 6% from US$0.37/lb explained by higher zinc volumes produced, which was partially offset by lower
by-products-contribution. |
| § | The smelting segment delivered total production (zinc metal and oxide)
of 150kt, down 6% from 3Q22, mainly driven by lower volumes in Cajamarquilla and Juiz de Fora. Compared to 2Q23, production was up 1%. |
| § | In 3Q23, zinc metal and oxide sales were 154kt, down 5% from 3Q22, following
lower production volumes, in addition to lower domestic demand for oxide in the period. Compared to 2Q23, metal sales grew 3% driven by
higher production volumes and sales strategy in line with working capital improvement initiatives. |
| § | Smelting conversion cost was US$0.29/lb in 3Q23 compared with US$0.26/lb
in 3Q22 due to higher maintenance, personnel costs and energy expenses impacted by inflation in the period. Compared to 2Q23, conversion
cost was down US$0.03/lb. |
| § | Smelting cash cost1 was US$1.01/lb in 3Q23 compared with
US$1.36/lb in 3Q22 and compared with US$1.12 in 2Q23. In both periods, the decrease was mainly explained by lower zinc prices, which reduced
concentrate purchase costs. |
Aripuanã
| § | As
previously disclosed in our press release dated October 24,
2023, at the beginning of 3Q23, the plant performance was averaging above 75%
of nameplate capacity. We then observed design limitations in the capacity of
the flotation pumping system, identified during the detection of bottlenecks in March, which required resizing and upgrade along with
certain plant processing facilities and systems, as well as the clean-up and upgrading of water treatment facilities, which will also
contribute to a better resiliency during the rainy season (which is expected to run from December to March). Due to the aforementioned
limitations, in 3Q23 we reduced plant throughput and, as a result, the utilization rate was also reduced in the period and the plant performed
at an average of 56% in the quarter. Despite this reduction, our priority is to continue improving metal recovery and concentrate quality
and grades, aiming to achieve a stable operation and to minimize impacts related to the needed extension of the ramp-up phase. With this
revised plan in place, we expect to gradually return to an average of 70% capacity utilization level during 4Q23 and reaching 100% of
nameplate capacity in 1H24. |
1 Our cash cost net of
by-products credits is measured with respect to zinc sold.
 | 2 |
Earnings Release – 3Q23 |  |
Financial Performance
| § | Net revenues in 3Q23 were US$649 million compared with US$703 million
in 3Q22. This decrease was mainly due to lower zinc LME metal prices and smelting sales volume. Compared to 2Q23, net revenues increased
by 4%, because of higher mining production and metal sales volumes, partially offset by lower LME metal prices. In 9M23, net revenues
amounted to US$1,943 million, down by 14% compared to the same period a year ago. |
| § | In 3Q23, net loss was US$63 million, totaling US$182
million in 9M23, resulting in a basic and diluted losses per share of US$0.56 and
US$1.48, respectively. |
| § | Adjusted EBITDA[2]
in 3Q23 was US$82 million, compared with US$121 million in 3Q22 and US$72 million
in 2Q23. This performance was mainly driven by lower zinc LME metal prices (Zn down 26% vs 3Q22 and 4% vs 2Q23). Compared to 2Q23, the
lower zinc LME metal prices was offset by lower costs in Brazil and higher treatment charges (“TCs”) applied to concentrate
purchases from third-parties. In 9M23, Adjusted EBITDA amounted to US$286 million, down by 55% compared to the same period a year ago. |
| § | Adjusted EBITDA for the mining segment in 3Q23 was US$40 million compared
with US$20 million in 2Q23. This increase was mainly driven by higher volumes in Cerro Lindo, El Porvenir and Vazante, in addition to
lower operational costs in Aripuanã, related to concentrate and stockpile costs, which were partially offset by lower LME metal
prices. Compared to 3Q22, Adjusted EBITDA decreased by 37%. |
| § | Adjusted EBITDA for the smelting segment in 3Q23 was US$49 million compared
with US$51 million in 2Q23. This decrease was mainly driven by the negative hedge variation and lower by-products contribution, which
were partially offset by higher TCs and higher sales volume. Compared to 3Q22, Adjusted EBITDA decreased by 16%. |
| § | Adjusted
net loss in 3Q23, was US$49 million, totaling US$34 million in 9M23. Adjusted net loss attributable
to Nexa’s shareholders was US$57 million in 3Q23 and US$53 million in 9M23, resulting in
adjusted basic and diluted loss per share of US$0.43 and US$0.40,
respectively. |
Financial Position,
Investments and Financing
| § | Total cash[3]
at September 30, 2023, was US$422 million compared to US$421 million at June 30,
2023. Our available liquidity in 3Q23 remained at US$722 million, including our revolving credit facility of US$300 million. Nevertheless,
on October 20, 2023, we successfully closed a US$320 million sustainability-linked revolving credit facility. This new facility, with
a term of 5-year, replaced Nexa’s 2019 US$300 million revolving credit facility. |
| § | In 3Q23, our free cash flow generation was US$14 million, mainly due
to the positive impact of working capital variations of US$95 million, a result of a reduction in inventories and increase in trade and
confirming payables, which were partially offset by an increase in trade accounts receivables, and by investments
in sustaining CAPEX (including HS&E investments) in the amount of US$75 million, including US$20 million related to Aripuanã.
Refer to our “Net cash flows from operating activities excluding working capital variations and free cash flow - Reconciliation”
section for further details. |
2
Adjusted EBITDA exclude the items presented in
the “Net income (loss) reconciliation to Adjusted EBITDA” section on page 13 of this earnings release – US$15 million
in 3Q23, totaling US$148 million in 9M23.
3
Cash and cash equivalents and financial investments.
| | 3 |
Earnings Release – 3Q23 | |
| § | Net debt to Adjusted EBITDA ratio for the last twelve months (“LTM”)
increased to 3.06x compared with 2.83x at the end of June 2023 and 1.41x at the end of 3Q22. This increase was mainly explained by lower
LTM Adjusted EBITDA, impacted in part by lower metal prices, while total debt remained relatively flat. |
Environmental,
Social and Governance (“ESG”) and Corporate Highlights
| § | In July 2023, Nexa Peru committed to RED (“Red de Empresas y Discapacidad”)
to improve the employment and inclusion of professionals with disabilities, reaffirming our commitment to providing equal opportunities
and promoting a diverse and inclusive organizational culture. |
| § | In August 2023, Nexa signed a partnership agreement focused on reducing
waste disposal with a local cement supplier to test and evaluate the feasibility of technological routes for Cajamarquilla’s dried
neutral sludge to be used in the cement production chain. |
| § | In August 2023, in line with our ESG commitments, targeting net-zero
greenhouse gas emissions by 2050, we implemented the ON GRID solar system at our Cajamarquilla smelter, providing electric power from
solar energy, resulting in a reduced footprint carbon emissions and promoting clean energy production. We have early-stage initiatives
in place and plan to expand the utilization of this solar system in the available locations of deactivated tailings dams in Cajamarquilla. |
| § | In September 2023, Nexa was recognized as a leader in Social Governance
and awarded “Company of the Year - Mining Sector 2023” by Brasil Mineral (a Brazilian magazine specializing in mining). This
recognition was partly in acknowledgement of our training program in Aripuanã. The program as a whole trained 1,987 people, of
whom 53% were women. Furthermore, 40% of program participants were placed back into the job market. It is estimated that more than 15%
of the local population has benefited from this initiative, underscoring our commitment to being a collaborative force in regional development. |
| § | In September 2023, Nexa held its annual Safety Week, which included
several employees across all operations in Brazil and Peru. The purpose of this event is to share insights and experiences to enhance
our safety culture and strengthen our awareness of potential risks, promote healthy habits, and to encourage safer behaviors. |
| § | In September 2023, Ms. Jane Sadowsky, our board member, was named as
one of the most influential leaders in corporate governance by the National Association of Corporate Directors (“NACD”) as
part of their 2023 NACD Directorship 100™, an annual list of leading corporate directors and governance advocates. This accolade
underscores our commitment to governance excellence, integrity, and accountability. |
| § | Nexa recently announced organizational changes aimed at some of its
leadership roles. In September 2023, Mrs. Sofia Bresani was appointed as Head of Corporate Controlling, Tax Planning and Investment Analysis,
and in October 2023, Mrs. Neuma Eufrazio was appointed as Head of Internal Auditing, Compliance and Internal Controls. These appointments
strengthen our diversity and recognize that their professional experience will contribute positively to shaping the future of our business. |
| § | On October 20, 2023, Nexa announced the successful closing of a US$320
million sustainability-linked revolving credit facility, which replaces Nexa’s 2019 US$300 million revolving credit facility that
was set to mature in October 2024. This new revolving credit facility has a term of five years, and the amounts drawn are subject to an
initial interest rate of 1.60% plus Term SOFR. The applicable margin is subject to compliance with carbon reduction key performance indicators,
reflecting the company's unwavering commitment to reducing its carbon footprint. Such efforts are consistent with Nexa's ESG ambitions,
targeting net-zero greenhouse gas emissions by 2050, in alignment with the Paris Agreement. |
| | 4 |
Earnings Release – 3Q23 | |
| § | On July 27, 2023, Nexa informed that production at the Atacocha San
Gerardo open pit mine was resumed after protest activities by local communities ceased and access to the mine was released. The communities
were illegally blocking access to the mine and claiming rights over areas registered as the property of Nexa Atacocha. Nexa remains committed
to the social development of its host communities and will continue to pursue an active dialogue with the local community and its members. |
Growth Strategy
and Asset Portfolio
| § | We
have been focused on free cash flow generation and we continue to evaluate our capital allocation framework, which includes
priorities related to ESG and HS&E, whilst ensuring that Nexa’s capital is appropriately allocated to the highest
return assets. |
| § | The
strategic review of our assets continues with initiatives to optimize the portfolio. We continue to assess risk-return alternatives
for our Magistral copper project in Peru and for our Morro Agudo mine and Bonsucesso project in Brazil. |
| § | We
continue to advance the technical studies of the Pasco Integration project, aiming to develop a robust organic growth option for Nexa.
Technical studies cover different work, from mine planning to important projects to sustain and expand production, such as mine design
and studies for the underground interconnection, shaft upgrade and engineering assessment of the plant, as well as key routes to improve
capacity to provide a long-term solution for tailings storage facilities (“TSF”). Furthermore, we continue to advance the
required environmental studies and permits. As studies progress, the project continues to demonstrate potential to unlock important value
for Nexa through economies of scale, costs improvements and extension of asset life. |
Outlook
Production, Sales
and Cash Cost Guidance
| § | Nexa will continue to monitor risks associated with global supply chain
disruptions, which could be exacerbated, among other factors, by the ongoing Russia-Ukraine war, as well as the Israel-Hamas conflict,
unusual weather conditions and/or increased restrictions related to the COVID-19 pandemic; the global recession, and the potential impact
on the demand for our products; inflationary cost pressure; metal prices; and community protests, political situation and changes to the
regulatory framework in the countries in which we operate that could affect our production levels and our costs. Refer to “Risks
and Uncertainties” and “Cautionary Statement on Forward-Looking Statements” for further information. |
| § | Nexa reiterates its 2023 production guidance for all metals, except
for the Aripuanã mine, which guidance was updated due to the reasons aforementioned. Zinc metal sales, consolidated cash cost for
mining and smelting, capital expenditures, exploration, project evaluation and other expenses are outlined below. |
| o | Cerro Lindo: zinc and copper production is expected to slightly increase
in 4Q23 due to the ongoing mining plan, which encompasses higher-grade stopes. These areas were restricted in 2Q23 after the rainfall-related
shutdown in mid-March, impacting mine development, and resumed in 3Q23. |
| o | El Porvenir: the mine is running at full throughput capacity and based
on mine sequencing, zinc production in 4Q23 is expected to slightly decrease compared to 3Q23. However, lead and silver production are
expected to increase due to estimated higher average head grades for those metals. |
| o | Atacocha: the mine is currently running at full throughput capacity
and all metals production is estimated to increase in 4Q23 compared to 3Q23, driven by the expected production recovery after the illegal
protest activities that took place in June and July. |
| o | Vazante: ore throughput and zinc head grade in 4Q23 are expected to
slightly decrease compared to 3Q23, resulting in lower zinc production, given the mine sequencing plan for the period. Nonetheless,
production for 2023 is expected to reach the upper range of the guidance. |
| | 5 |
Earnings Release – 3Q23 | |
| o | Morro Agudo: zinc production in 4Q23 is expected to remain at a similar
level to the average of 3Q23. Lead production is expected to decrease compared to 3Q23 due to the estimated lower average head grade. |
| o | Aripuanã: the overall ramp-up is expected to improve in 4Q23
compared to 3Q23. The utilization rate at the plant is expected to increase gradually, reaching 70% in the quarter. However, we may expect
some additional impact on 2024 production. The 2023 production guidance was revised downwards as previously disclosed in our press release
on October 24, 2023. |
| § | Zinc metal sales guidance also remains unchanged at 580-605kt. |
| o | Peru: we expect production at Cajamarquilla in 4Q23 to be higher than
the average in 3Q23, mainly driven by better performance and production stability. |
| o | Brazil: in Três Marias we expect production to slightly increase
in 4Q23 compared to 3Q23, following production stability, while Juiz de Fora production is expected to remain at similar level to the
average in 3Q23. |
Mining segment – production
| Mining production |
|
9M23 |
|
2023e |
| (Metal in concentrate) |
|
Updated |
| |
|
|
|
|
|
|
|
| Zinc |
kt |
|
243 |
|
299 |
- |
334 |
| Cerro Lindo |
|
|
54 |
|
69 |
- |
79 |
| El Porvenir |
|
|
42 |
|
51 |
- |
55 |
| Atacocha |
|
|
6 |
|
9 |
- |
11 |
| Vazante |
|
|
111 |
|
131 |
- |
144 |
| Morro Agudo |
|
|
16 |
|
17 |
- |
23 |
| Aripuanã |
|
|
15 |
|
20 |
- |
23 |
| |
|
|
|
|
|
|
|
| Copper |
kt |
|
24 |
|
29 |
- |
33 |
| Cerro Lindo |
|
|
21 |
|
25 |
- |
28 |
| El Porvenir |
|
|
0.3 |
|
0.2 |
- |
0.3 |
| Aripuanã |
|
|
3.1 |
|
4.2 |
- |
5.0 |
| |
|
|
|
|
|
|
|
| Lead |
kt |
|
48 |
|
53 |
- |
65 |
| Cerro Lindo |
|
|
9 |
|
11 |
- |
13 |
| El Porvenir |
|
|
18 |
|
20 |
- |
26 |
| Atacocha |
|
|
8 |
|
10 |
- |
12 |
| Vazante |
|
|
1.2 |
|
1.1 |
- |
1.2 |
| Morro Agudo |
|
|
6.4 |
|
4.9 |
- |
6.1 |
| Aripuanã |
|
|
4.1 |
|
5.7 |
- |
6.9 |
| |
|
|
|
|
|
|
|
| Silver |
MMoz |
|
7.6 |
|
9.1 |
- |
10 |
| Cerro Lindo |
|
|
2.5 |
|
3.5 |
- |
3.8 |
| El Porvenir |
|
|
3.3 |
|
3.7 |
- |
4.5 |
| Atacocha |
|
|
1.0 |
|
1.0 |
- |
1.2 |
| Vazante |
|
|
0.4 |
|
0.3 |
- |
0.4 |
| Aripuanã |
|
|
0.3 |
|
0.4 |
- |
0.5 |
Smelting segment – sales
| | 6 |
Earnings Release – 3Q23 | |
| Smelting sales |
|
9M23 |
|
2023e |
| |
|
|
|
|
|
|
|
| Metal Sales |
kt |
|
447 |
|
580 |
- |
605 |
| Zinc metal |
|
|
421 |
|
545 |
- |
565 |
| Zinc oxide |
|
|
26 |
|
35 |
- |
40 |
| § | Nexa
reiterates its cost ROM at mining operations and conversion costs at smelting operations
despite a challenging inflationary environment, however, on October
24, 2023, we lowered our cash cost guidance for both segments. On the mining side,
primarily due to higher by-products contribution and lower TCs, while on the smelting side
lower zinc prices positively impacted the purchase of zinc concentrate. We believe that the
lowered 2023 consolidated cash cost guidance for our mining and smelting segments will be
achieved. |
| o | Mining and smelting volumes are expected to be higher in 4Q23 compared
to previous quarters and remain in the guidance ranges, as noted above. |
| o | Continued improvements in operational efficiency and cost management
are expected to offset some of the ongoing inflationary pressures. Certain initiatives focused on optimizing costs and increasing productivity
continue to be implemented in Aripuanã and the Peruvian mines, in addition to Cajamarquilla. |
| o | Commodity prices have been revised for 2023e – (Zn: US$1.19/lb,
Cu: US$3.84/lb, Pb: US$0.97/lb, Ag: US$23.3/oz, Au: US$1,927/oz), versus previous 2023e – (Zn: US$1.29/lb, Cu: US$3.54/lb, Pb: US$0.91/lb,
Ag: US$20/oz, Au: US$1,700/oz). Nexa’s C1 cash cost is sensitive to by-products prices and volumes, which may affect the results
of our final costs. |
| o | Foreign exchange rates assumptions have been updated to (BRL/USD: 4.99
and Soles/USD: 3.72), versus previous 2023e – (BRL/USD: 5.07 and Soles/USD: 3.94). |
| o | Zinc treatment charges (“TCs”) assumptions for the year
have been updated to US$274/t concentrate, versus previous 2023e US$285/t concentrate. |
Cash Costs
| Mining Operating costs |
|
Cost ROM
(US$/t) |
|
Cash Cost
(US$/lb) |
|
Cost ROM
(US$/t) |
|
Cash Cost
(US$/lb) |
| |
|
|
|
| |
9M23 |
|
9M23 |
|
2023e |
|
2023e |
| |
|
|
|
Updated |
| |
|
|
|
|
|
|
|
|
|
|
|
|
| Mining (1) |
|
44.2 |
|
0.38 |
|
43.9 |
- |
46.4 |
|
0.35 |
- |
0.38 |
| Cerro Lindo |
|
40.3 |
|
(0.12) |
|
40.1 |
- |
42.1 |
|
(0.12) |
- |
(0.10) |
| El Porvenir |
|
60.2 |
|
0.26 |
|
57.3 |
- |
60.7 |
|
0.26 |
- |
0.28 |
| Atacocha |
|
33.1 |
|
(0.72) |
|
33.1 |
- |
35.4 |
|
(0.45) |
- |
(0.38) |
| Vazante |
|
56.7 |
|
0.62 |
|
57.2 |
- |
59.0 |
|
0.59 |
- |
0.65 |
| Morro Agudo |
|
30.6 |
|
0.83 |
|
35.0 |
- |
38.2 |
|
0.80 |
- |
0.94 |
(1) C1 Weighted Cash cost net
of by-products credits is measured with respect to zinc sold per mine.
| Smelting Operating costs |
|
Conversion cost
(US$/lb) |
|
Cash Cost
(US$/lb) |
|
Conversion cost
(US$/lb) |
|
Cash Cost
(US$/lb) |
| |
|
|
|
| |
9M23 |
|
9M23 |
|
2023e |
|
2023e |
| |
|
|
|
Updated |
| |
|
|
|
|
|
|
|
|
|
|
|
|
| Smelting (2) |
|
0.31 |
|
1.13 |
|
0.29 |
- |
0.32 |
|
1.07 |
- |
1.12 |
| Cajamarquilla |
|
0.28 |
|
1.07 |
|
0.27 |
- |
0.29 |
|
1.04 |
- |
1.08 |
| Três Marias |
|
0.27 |
|
1.16 |
|
0.27 |
- |
0.30 |
|
1.08 |
- |
1.13 |
| Juiz de Fora |
|
0.50 |
|
1.29 |
|
0.45 |
- |
0.49 |
|
1.19 |
- |
1.28 |
(2) C1 Weighted Cash cost net
of by-products credits is measured with respect to zinc sold per smelter.
| | 7 |
Earnings Release – 3Q23 | |
| § | Mining C1 cash cost of US$0.38/lb in 9M23 was within our updated 2023
guidance, primarily driven by Cerro Lindo and Atacocha performances. For reference, please see the section “Business performance
– Mining segment”. Nonetheless, we expect a reduction in C1 cash in 4Q23, ending the year within the updated guidance range. |
| § | Smelting C1 cash cost of US$1.13/lb in 9M23 was slightly higher than
our updated 2023 guidance. This was mainly related to lower by-products credits in the period, driven by lower-than-expected metal prices
and production in 3Q23. Nonetheless, we expect a reduction in C1 cash in 4Q23, ending the year within the updated guidance range. |
Capital Expenditures
(“CAPEX”) Guidance
| § | Nexa invested US$82 million in 3Q23, totaling US$198
million in 9M23. Nearly all of the investment was classified
as sustaining, which includes CAPEX to sustain operations, HS&E and mine development. |
| § | At Aripuanã, sustaining and HS&E CAPEX in 3Q23 accounted
for US$20 million, totaling US$51 million in 9M23. Of this amount, US$6 million was invested in mine development in the quarter, totaling
US$16 million in 9M23. |
| § | The Brazilian real appreciation against the U.S. dollar had a negative
impact of US$2.8 million in the quarter, totaling a negative impact of US$3.7 million in 9M23. |
| § | 2023 CAPEX guidance remains unchanged. |
| CAPEX |
|
9M23 |
|
2023e |
| (US$ million) |
|
|
| Expansion projects (1) |
|
2 |
|
7 |
| |
|
|
|
|
| Non-Expansion |
|
201 |
|
303 |
| Sustaining (2) |
|
185 |
|
268 |
| HS&E |
|
11 |
|
26 |
| Others (3) |
|
5 |
|
10 |
| Reconciliation to Financial Statements (4) |
|
(5) |
|
- |
| TOTAL |
|
198 |
|
310 |
(1) Including
Vazante deepening, among other several projects to improve operational performance.
(2) Investments
in tailing dams are included in sustaining expenses.
(3) Modernization,
IT and others.
(4) The
amounts are mainly related to capitalization of interest net of advanced payments for imported materials and tax credits.
Exploration &
Project Evaluation and Other Expenses Guidance
| § | In 3Q23, we invested US$26 million in exploration and project evaluation,
totaling US$69 million in 9M23. |
| § | Our updated exploration and project evaluation guidance is now expected
to be US$100 million in 2023, a reduction of US$10 million from the previous guidance, mainly due to initiatives to optimize capital allocation.
Additionally, we reduced US$5 million of our 2023 guidance for technology and communities to continue contributing
to the social and economic development of our host communities. |
| | 8 |
Earnings Release – 3Q23 | |
| § | As part of our long-term strategy, we will maintain our efforts to replace
and increase mineral reserves and resources. We expect to continue advancing with our exploration activities, primarily focusing on identifying
new ore bodies and upgrading resources classification through infill drilling campaigns. |
| Other Operating Expenses |
|
9M23 |
|
2023e |
| (US$ million) |
|
|
Updated |
| Exploration |
|
44 |
|
49 |
| Mineral Exploration |
|
28 |
|
30 |
| Mineral rights |
|
4 |
|
5 |
| Sustaining (mine development) |
|
11 |
|
14 |
| |
|
|
|
|
| Project Evaluation |
|
25 |
|
50 |
| Três Marias Project |
|
10 |
|
15 |
| |
|
|
|
|
| Exploration & Project Evaluation (1) |
|
69 |
|
100 |
| |
|
|
|
|
| Other |
|
12 |
|
20 |
| Technology |
|
4.3 |
|
6 |
| Communities |
|
7.4 |
|
14 |
(1) Exploration
and Project Evaluation expenses in 3Q23, were adjusted downwards by US$1.6 million due to a reclassification from the previous quarter,
not affecting the cumulative amount for 9M23.
Note: Exploration and project evaluation expenses
consider several stages of development, from mineral potential definition, R&D, and subsequent scoping and pre-feasibility studies
(FEL1 and FEL2).
| | 9 |
Earnings Release – 3Q23 | |
Earnings Release
– 3Q23
This Earnings Release should be read
in conjunction with the Condensed consolidated interim financial statements (unaudited) at and for the three and nine-month periods ended
on September 30, 2023. This document contains forward-looking statements.
Table of contents
| Consolidated performance |
11 |
| Business performance – Mining |
16 |
| Business performance – Smelting |
28 |
| Liquidity and Indebtedness |
35 |
| Cash flows |
36 |
| Others |
37 |
| Market scenario |
38 |
| Risks and Uncertainties |
40 |
| Use of Non-IFRS Financial Measures |
41 |
| Cautionary Statement on Forward-Looking Statements |
43 |
| Appendix |
45 |
UPCOMING EVENT
Earnings Conference
Call
Date: Tuesday, October 31, 2023
– 9:00am (EST)
Dial In
US: +1-833-816-1265
Canada: +1-647-484-8814
Brazil: +55 11 3181-8565
International: +1-412-317-5635
Conference ID: Nexa Resources
Live audio webcast with slide presentation
will be available on:
https://ir.nexaresources.com
| | 10 |
Earnings Release – 3Q23 | |
Consolidated performance
Selected financial
information
US$ million
(excepted indicated otherwise) |
3Q23 |
2Q23 |
3Q22 |
9M23 |
9M22 |
| |
|
|
|
|
|
| Net Revenues |
649 |
627 |
703 |
1,943 |
2,254 |
| Mining |
273 |
268 |
241 |
809 |
933 |
| Smelting |
484 |
465 |
616 |
1,493 |
1,861 |
| Intersegment results | Adjustments |
(107) |
(107) |
(154) |
(358) |
(539) |
| |
|
|
|
|
|
| Cost of Sales |
(583) |
(565) |
(618) |
(1,715) |
(1,699) |
| Mining |
(246) |
(256) |
(193) |
(745) |
(602) |
| Current Operations |
(203) |
(195) |
(193) |
(601) |
(602) |
| Aripuanã |
(43) |
(60) |
0 |
(144) |
0 |
| Smelting |
(439) |
(415) |
(579) |
(1,323) |
(1,648) |
| Intersegment results | Adjustments |
102 |
106 |
154 |
352 |
551 |
| |
|
|
|
|
|
| Selling, general and administrative |
(33) |
(33) |
(32) |
(94) |
(105) |
| Mining |
(16) |
(14) |
(17) |
(45) |
(49) |
| Smelting |
(15) |
(16) |
(14) |
(46) |
(44) |
| Intersegment results | Adjustments |
(2) |
(3) |
0 |
(3) |
(11) |
| |
|
|
|
|
|
| Depreciation and amortization |
72 |
72 |
73 |
216 |
213 |
| Mining |
51 |
53 |
49 |
157 |
145 |
| Smelting |
20 |
19 |
20 |
58 |
61 |
| Intersegment results | Adjustments |
0 |
0 |
4 |
1 |
7 |
| |
|
|
|
|
|
| Adjusted EBITDA (1) |
82 |
72 |
121 |
286 |
640 |
| Mining |
40 |
20 |
64 |
102 |
362 |
| Smelting |
49 |
51 |
58 |
189 |
281 |
| Intersegment results | Adjustments |
(7) |
1 |
(1) |
(4) |
(2) |
| Adj. EBITDA margin (%) |
12.6% |
11.4% |
17.2% |
14.7% |
28.4% |
| |
|
|
|
|
|
| Net income (loss) |
(63) |
(103) |
(40) |
(182) |
158 |
| Attributable to Nexa's shareholders |
(74) |
(102) |
(41) |
(196) |
131 |
| Attributable to non-controlling interests |
10 |
(0) |
1 |
14 |
27 |
| |
|
|
|
|
|
| Basic and diluted EPS |
(0.56) |
(0.77) |
(0.31) |
(1.48) |
0.99 |
| |
|
|
|
|
|
| Adjusted net income (loss) (1) |
(49) |
12 |
(30) |
(34) |
184 |
| Attributable to Nexa's shareholders |
(57) |
6 |
(32) |
(53) |
157 |
| Attributable to non-controlling interests |
8 |
7 |
2 |
19 |
26 |
| |
|
|
|
|
|
| Adjusted basic and diluted EPS (1) |
(0.43) |
0.04 |
(0.24) |
(0.40) |
1.19 |
(1) Refer to “Use of Non-IFRS Financial
Measures” for further information. Adjusted EBITDA, adjusted net income (loss) and adjusted EPS, exclude the items presented in
the “Net income (loss) reconciliation to Adjusted EBITDA” section for further details on page 13 of this earnings release.
For details on segment definition and accounting policy, please refer to explanatory note 2 – “Information by business segment”
in the “Condensed consolidated interim financial statements (unaudited) at and for the three and nine-month periods ended on September
30, 2023”.
| | 11 |
Earnings Release – 3Q23 | |
Net revenues
In 3Q23, net revenues were US$649 million,
8% lower year-over-year, primarily due to lower zinc metal prices and smelting sales volume. The LME average price for zinc was down by
26%, while copper and lead rose by 8% and 10%, respectively, compared to the same period in 2022 – for more information on metal
prices, refer to the “Market Scenario” section.
Compared to 2Q23, net revenues increased
by 4%, mainly due to higher mining production and metal sales volumes, which was partially offset by lower zinc and copper metal prices.
In 9M23, net revenues amounted to US$1,943
million, down by 14% compared to the same period a year ago, as a result of lower LME metal prices across all base metals, which was partially
offset by higher zinc mining production.
Cost of Sales
In 3Q23, cost of sales amounted to US$583
million, down 6% year-over-year, mainly due to lower zinc prices, positively impacting our smelting raw material purchase and lower smelting
sales, which were partially offset by higher mining sales volumes driving overall higher cost of sales for the mining segment. Compared
to 2Q23, cost of sales increased by 3%, explained by higher mining sales volumes and smelting sales, which was partially offset by lower
zinc prices, positively impacting the purchase of the zinc concentrate in our smelting segment.
In 9M23, cost of sales amounted to US$1,715
million, up 1% compared to the same period a year ago, mainly due to higher mining production volumes and lower zinc prices, positively
impacting the purchase of the zinc concentrate in our smelting segment.
Mineral exploration
and project evaluation
In 3Q23, mineral exploration and project
evaluation investments were US$26 million compared to US$24 million in 3Q22, mainly driven by higher project evaluation expenses. In 9M23,
mineral exploration and project evaluation investment amounted to US$69 million.
For additional information about our exploration
results in the third quarter of 2023, please refer to our 3Q23 Exploration Report published on October 23, 2023.
SG&A
In 3Q23, SG&A expenses of US$33 million
were relatively flat compared with US$33 million in 2Q23, mainly driven by higher employee benefit expenses, partially offset by lower
third-party services in support areas, and were higher by 5% when compared to 3Q22. In 9M23, SG&A
expenses amounted to US$94 million, down by 10% compared to the same period a year ago, partially a result of our organizational redesign
that occurred in 2022 and lower third-party services in support areas.
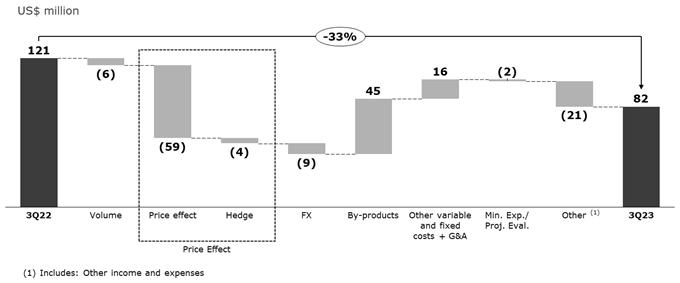
Adjusted EBITDA
In 3Q23, Adjusted EBITDA was US$82 million
compared with US$121 million in 3Q22. The main factors that contributed to this decrease were (i) the negative net price effect of US$59
million, primarily related to lower LME metal prices, which was partially offset by the positive effect of variation in MTM (“mark-to-market”);
(ii) negative impact of FX variation of US$9 million; (iii) the negative accounting effect regarding Enercan’s deconsolidation of
US$8 million; (iv) lower zinc metal sales volume of US$6 million; and (v) the negative hedge variation of US$4 million, which were partially
offset by (vi) higher by-products contribution of US$45 million, primarily related to higher copper and lead prices and volumes, partially
offset by lower payable value of sulphuric acid; and (vii) the positive net impact of US$16 million in costs, mainly due to higher zinc
concentrate volumes from our own mines, higher TCs applied to concentrate purchases from third-parties and a better smelting raw material
mix consumption, partially offset by Aripuanã’s sales expenses in the quarter compared to 3Q22.
| | 12 |
Earnings Release – 3Q23 | |
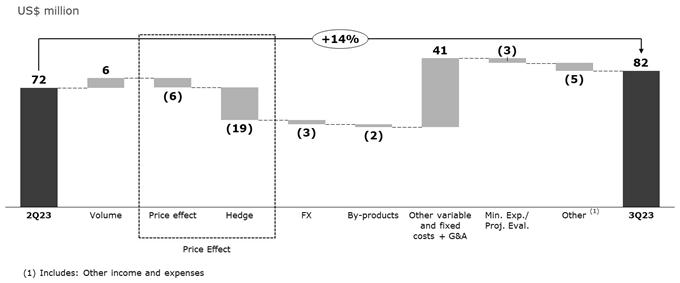
Compared to 2Q23, Adjusted EBITDA increased
by 14%. This increase was mainly driven by (i) the positive net impact of US$41 million, mainly due to the effect of lower ore stockpile
in Aripuanã, lower costs on raw material consumption in Brazil, lower freight and sales expenses in Cajamarquilla, and higher TCs
applied to concentrate purchases from third-parties, which was partially offset by (ii) the negative hedge effect of US$19 million; (iii)
the negative net price effect of US$6 million due to lower LME metal prices; (iv) the negative FX impact of US$3 million; and (v) lower
by-products contribution of US$2 million driven by lower prices.
During 9M23, Adjusted EBITDA was US$286
million compared with US$640 million in the same period a year ago, primarily driven by lower LME metal prices with a negative impact
of US$307 million and higher operational costs mainly in Aripuanã, related to concentrate and stockpile costs.
Net income (loss) reconciliation
to Adjusted EBITDA
| US$ million |
3Q23 |
2Q23 |
3Q22 |
9M23 |
9M22 |
| Net Income (loss) |
(63.4) |
(102.8) |
(39.9) |
(181.6) |
157.8 |
| Depreciation, amortization and depletion |
72.1 |
71.7 |
72.8 |
215.5 |
213.0 |
| Share in the results of associates |
(6.3) |
(5.7) |
0.0 |
(17.4) |
0.0 |
| Net financial results |
64.4 |
26.5 |
52.3 |
130.1 |
115.9 |
| Taxes on income |
0.4 |
(33.5) |
26.2 |
(8.1) |
127.7 |
| | 13 |
Earnings Release – 3Q23 | |
| US$ million |
3Q23 |
2Q23 |
3Q22 |
9M23 |
9M22 |
| EBITDA |
67.1 |
(43.7) |
111.4 |
138.6 |
614.4 |
| Fair value of offtake agreement (2) |
(1.0) |
(13.4) |
(7.8) |
(1.0) |
(16.6) |
| Impairment loss of long-lived assets |
1.9 |
57.2 |
(0.3) |
59.1 |
(0.3) |
| Pre-operating and ramp-up expenses during the commissioning and ramp-up of greenfield projects (Aripuanã) (3) |
3.5 |
(3.8) |
12.1 |
5.4 |
40.7 |
| Loss on sale of property, plant and equipment |
(0.1) |
1.0 |
0.6 |
1.2 |
0.5 |
| Remeasurement in estimates of asset retirement obligations |
(2.6) |
1.4 |
(5.5) |
(2.8) |
(9.2) |
| Remeasurement adjustment of streaming agreement |
2.3 |
0.0 |
10.6 |
2.3 |
10.6 |
| Energy forward contracts – MTM |
(2.3) |
9.7 |
0.0 |
7.4 |
0.0 |
| Provisions – Value added tax ("VAT") discussions |
12.8 |
63.2 |
0.0 |
76.0 |
0.0 |
| Adjusted EBITDA (1) |
81.7 |
71.5 |
121.1 |
286.2 |
640.2 |
(1) Adjusted EBITDA exclude the items presented
above in the “Net income (loss) reconciliation to Adjusted EBITDA”. For details on segment definition and accounting policy,
please refer to explanatory note 2 – “Information by business segment” in the “Condensed consolidated interim
financial statements (unaudited) at and for the three and nine-month periods ended on September 30, 2023”.
(2) Refers to the fair value of the financial
instrument related to the “Offtake agreement” described on page 37 of this earnings release.
(3) Expenses related to pre-operating and
ramp-up expenses incurred during the commissioning and ramp-up phases of greenfield projects which have not achieved their nameplate capacity
are not indicative of the Company’s normal operating activities. Once Aripuanã operation is stabilized and operational at
its nameplate capacity, such effects will no longer be excluded.
Net financial
results
The net
financial results in 3Q23 were an expense of US$65 million compared to US$27 million expense in 2Q23, mainly driven by higher FX rate
losses, higher financial income (interest on financial investments and cash equivalents) and lower financial expenses, including interest
paid in the forfaiting and confirming payables program, accrued interest related to our two outstanding corporate bonds and other financial
expenses[4].
The foreign
exchange variation had a negative impact of US$27 million versus a positive impact of US$27 million in 2Q23, mainly explained by the 4%
depreciation of the Brazilian real against the U.S. dollar[5]
in 3Q23 versus the previous quarter.
Excluding the effect of the foreign exchange
variation, the net financial results in 3Q23 were an expense of US$37 million compared to an expense of US$53 million in the previous
quarter.
| US$ thousand |
3Q23 |
2Q23 |
3Q22 |
| |
|
|
|
| Financial income |
8,359 |
6,700 |
6,701 |
| |
|
|
|
| Financial expenses |
(45,316) |
(59,363) |
(41,571) |
| |
|
|
|
| Other financial items, net |
(27,400) |
26,149 |
(17,423) |
| Foreign exchange gain (loss) |
(26,882) |
26,812 |
(16,076) |
| |
|
|
|
4
For details on other financial expenses, please
refer to the Legal Matters section of this Earnings Release and explanatory note 1 (b) “VAT discussions – TAX Voluntary Disclosure
and Contingent Liabilities” in the “Condensed consolidated interim financial statements ended on September 30, 2023”.
5
In 3Q23, the Brazilian real / U.S. dollar (end of period) exchange rate was R$5.007/US$1.00 compared to R$4.819/US$1.00 in 2Q23.
| | 14 |
Earnings Release – 3Q23 | |
| US$ thousand |
3Q23 |
2Q23 |
3Q22 |
| Net financial result |
(64,357) |
(26,514) |
(52,293) |
| Net financial result excluding FX |
(37,475) |
(53,326) |
(36,217) |
Net income (loss)
Net loss
was US$63 million in 3Q23 compared to net loss of US$40 million in 3Q22 and net loss of US$103 million in 2Q23, mainly driven by the increase
in operating income when compared to 2Q23, the recognition of an impairment loss[6]
and contingent liabilities and provisions in 2Q23. In 9M23, net loss was US$182 million compared to net
income of US$158 million in the same period a year ago.
Excluding the miscellaneous adjustments
presented below and detailed above in the Net income (loss) reconciliation to Adjusted EBITDA section, adjusted net loss was US$49 million
in the quarter. In 9M23, adjusted net loss totaled US$34 million.
Adjusted net loss attributable to Nexa’s
shareholders was US$57 million in 3Q23 and US$53 million in 9M23, resulting in adjusted loss per share of US$0.43 and
US$0.40, respectively.
US$ million
(excepted indicated otherwise) |
3Q23 |
2Q23 |
3Q22 |
9M23 |
9M22 |
| Net Income (loss) |
(63.4) |
(102.8) |
(39.9) |
(181.6) |
157.8 |
| Attributable to Nexa's shareholders |
(73.7) |
(102.5) |
(41.2) |
(196.0) |
130.8 |
| Attributable to non-controlling interests |
10.4 |
(0.3) |
1.4 |
14.4 |
27.0 |
| Basic and diluted earnings (loss) per share |
(0.56) |
(0.77) |
(0.31) |
(1.48) |
0.99 |
| |
|
|
|
|
|
| Miscellaneous adjustments |
14.6 |
115.2 |
9.7 |
147.6 |
25.8 |
| Attributable to Nexa's shareholders |
16.6 |
108.2 |
9.3 |
143.2 |
26.5 |
| Attributable to non-controlling interests |
(2.0) |
7.0 |
0.4 |
4.4 |
(0.7) |
| Basic and diluted miscellaneous adjustments per share |
0.13 |
0.82 |
0.07 |
1.08 |
0.20 |
| |
|
|
|
|
|
| Adjusted net income (loss) |
(48.8) |
12.5 |
(30.2) |
(33.9) |
183.6 |
| Attributable to Nexa's shareholders |
(57.2) |
5.7 |
(31.9) |
(52.8) |
157.3 |
| Attributable to non-controlling interests |
8.4 |
6.7 |
1.7 |
18.8 |
26.3 |
| Weighted average number of outstanding shares - in thousand |
132,439 |
132,439 |
132,439 |
132,439 |
132,439 |
| Adjusted basic and diluted EPS |
(0.43) |
0.04 |
(0.24) |
(0.40) |
1.19 |
(1) Miscellaneous adjustments include: (i)
Fair value of offtake agreement; (ii) Impairment loss of long-lived assets; (iii) Aripuanã pre-operating expenses and ramp-up impacts;
(iv) Impairment of other assets; (v) Loss on sale of property, plant and equipment; (vi) Remeasurement in estimates of asset retirement
obligations; (vii) Remeasurement adjustment of streaming agreement; and (viii) Other adjustments.
6
Note: For details on Impairment Loss and Contingent Liabilities and Provisions, please refer to the “Condensed consolidated interim
financial statements ended on September 30, 2023”.
| | 15 |
Earnings Release – 3Q23 | |
Business Performance
Mining segment
| Consolidated |
|
3Q23 |
2Q23 |
3Q22 |
3Q23 vs. 3Q22 |
9M23 |
9M22 |
9M23 vs. 9M22 |
| Ore Mined |
kt |
3,284 |
3,214 |
3,029 |
8.4% |
9,437 |
8,900 |
6.0% |
| Treated Ore |
kt |
3,470 |
3,546 |
3,135 |
10.7% |
10,147 |
9,062 |
12.0% |
| |
|
|
|
|
|
|
|
|
| Grade |
|
|
|
|
|
|
|
|
| Zinc |
% |
2.99 |
2.72 |
2.78 |
21 bps |
2.90 |
2.82 |
8 bps |
| Copper |
% |
0.37 |
0.35 |
0.30 |
6 bps |
0.33 |
0.33 |
(0 bps) |
| Lead |
% |
0.67 |
0.64 |
0.62 |
5 bps |
0.67 |
0.61 |
6 bps |
| Silver |
oz/t |
1.01 |
1.02 |
1.08 |
(6.3%) |
1.02 |
1.08 |
(5.7%) |
| Gold |
oz/t |
0.005 |
0.005 |
0.005 |
2.0% |
0.005 |
0.005 |
3.0% |
| |
|
|
|
|
|
|
|
|
| Production | metal contained |
|
|
|
|
|
|
|
| Zinc |
kt |
87.4 |
80.7 |
76.0 |
15.0% |
242.9 |
221.5 |
9.6% |
| Copper |
kt |
9.3 |
8.7 |
7.4 |
24.7% |
24.0 |
23.9 |
0.5% |
| Lead |
kt |
16.5 |
16.0 |
15.3 |
7.9% |
47.6 |
41.8 |
14.0% |
| Silver |
MMoz |
2.6 |
2.6 |
2.6 |
(0.5%) |
7.6 |
7.4 |
1.8% |
| Gold |
koz |
6.6 |
6.8 |
7.1 |
(7.1%) |
19.9 |
20.3 |
(2.0%) |
| Zinc Equivalent (1) |
kt |
141.8 |
133.5 |
125.2 |
13.3% |
393.3 |
367.7 |
7.0% |
(1) Consolidated mining production in kt
of zinc equivalent is calculated by converting copper, lead, silver and gold contents to a zinc equivalent grade, assuming 2022 LME average
benchmark prices: Zn: US$1.58/lb; Cu: US$3.99/lb; Pb: US$0.98/lb; Ag: US$21.7/oz; Au: US$1,800/oz.
In 3Q23, treated ore volume was 3,470kt
up 11% year-over-year, explained by better plant performance in El Porvenir, Vazante and Morro Agudo and the beginning of production in
Aripuanã. However, Cerro Lindo treated ore slightly dropped by 3%, and was in line with our expectations for the year (following
the current mine sequencing plan), while Atacocha decreased by 14% explained by the temporary suspension of production for approximately
one month (end of June through end of July) in the period due to illegal protest activities.
Compared to 2Q23, treated ore volume decreased
by 2%, mainly driven by the Atacocha and Aripuanã mines.
The ore throughput, year-over-year, increased
at El Porvenir (+8%), Vazante (+3%) and Morro Agudo (+27%), while Cerro Lindo decreased by (-3%) and Atacocha decreased by (-14%).
Zinc production of 87kt in the quarter
rose by 15% from 3Q22, mainly explained by the increase in treated ore volume and the start-up of the Aripuanã mine. Compared with
2Q23, zinc production rose by 8%, mainly due to the higher volumes from Cerro Lindo, Morro Agudo and Vazante, in addition to Aripuanã
ramp-up phase progress.
Copper production of 9kt increased by
25% from 3Q22, as a result of higher average grade in Cerro Lindo and the Aripuanã ramp-up. Compared to 2Q23, copper production
was 7% higher, mainly driven by Cerro Lindo performance in the period.
Lead production increased by 8% year-over-year
and 3% quarter-over-quarter driven by El Porvenir, Morro Agudo and Aripuanã.
In 9M23, treated ore volume increased
by 12% year-over-year to 10,147kt mainly explained by the higher ore throughput in all mines, except Atacocha. Zinc average grade was
up 8bps to 2.90%.
| | 16 |
Earnings Release – 3Q23 | |
Therefore, zinc production totaled 243kt,
10% higher than in 9M22. Copper production was 0.5% higher and lead production increased by 14% to 48kt, following higher average grades.
Cerro Lindo
Cerro Lindo
(100% basis) |
|
3Q23 |
2Q23 |
1Q23 |
9M23 |
4Q22 |
3Q22 |
2Q22 |
1Q22 |
9M22 |
| |
|
|
|
|
|
|
|
|
|
|
| Ore Mined |
kt |
1,515 |
1,595 |
1,254 |
4,365 |
1,581 |
1,558 |
1,698 |
1,425 |
4,681 |
| Treated Ore |
kt |
1,540 |
1,530 |
1,277 |
4,347 |
1,589 |
1,594 |
1,661 |
1,392 |
4,647 |
| |
|
|
|
|
|
|
|
|
|
|
| Grade |
|
|
|
|
|
|
|
|
|
|
| |
|
|
|
|
|
|
|
|
|
|
| Zinc |
% |
1.63 |
1.31 |
1.38 |
1.44 |
1.49 |
1.42 |
1.58 |
1.71 |
1.57 |
| Copper |
% |
0.63 |
0.57 |
0.48 |
0.57 |
0.65 |
0.55 |
0.66 |
0.57 |
0.59 |
| Lead |
% |
0.32 |
0.33 |
0.25 |
0.30 |
0.28 |
0.37 |
0.35 |
0.34 |
0.35 |
| Silver |
oz/t |
0.81 |
0.83 |
0.72 |
0.79 |
0.70 |
0.94 |
0.99 |
0.92 |
0.95 |
| Gold |
oz/t |
0.002 |
0.002 |
0.002 |
0.002 |
0.003 |
0.002 |
0.003 |
0.003 |
0.002 |
| |
|
|
|
|
|
|
|
|
|
|
| Production | metal contained |
|
|
|
|
|
|
|
| |
|
|
|
|
|
|
|
|
|
|
| Zinc |
kt |
21.7 |
16.9 |
15.0 |
53.6 |
20.7 |
19.9 |
22.7 |
21.1 |
63.7 |
| Copper |
kt |
8.1 |
7.4 |
5.2 |
20.7 |
9.1 |
7.4 |
9.5 |
6.8 |
23.7 |
| Lead |
kt |
3.6 |
3.6 |
2.1 |
9.3 |
3.2 |
4.7 |
4.4 |
3.4 |
12.5 |
| Silver |
MMoz |
0.9 |
0.9 |
0.6 |
2.5 |
0.8 |
1.1 |
1.2 |
1.0 |
3.3 |
| Gold |
koz |
0.7 |
0.8 |
0.7 |
2.2 |
0.9 |
1.0 |
1.1 |
1.1 |
3.2 |
| |
|
|
|
|
|
|
|
|
|
|
| Zinc sales |
kt |
20.8 |
17.5 |
14.8 |
53.1 |
19.9 |
19.7 |
22.9 |
23.4 |
66.0 |
| |
|
|
|
|
|
|
|
|
|
|
| Costs |
|
|
|
|
|
|
|
|
|
| |
|
|
|
|
|
|
|
|
|
|
| Cost of sales |
US$ mm |
88.6 |
86.5 |
81.6 |
256.7 |
99.0 |
94.6 |
105.9 |
97.0 |
297.5 |
| Cost ROM (2) |
US$/t |
41.3 |
39.8 |
39.6 |
40.3 |
42.2 |
40.1 |
38.2 |
41.0 |
39.7 |
| Cash cost (1) |
US$/lb |
(0.18) |
(0.13) |
(0.02) |
(0.12) |
(0.38) |
0.37 |
(0.59) |
(0.34) |
(0.22) |
| Sustaining cash cost (1) |
US$/lb |
0.07 |
0.15 |
0.23 |
0.14 |
(0.04) |
0.59 |
(0.39) |
(0.19) |
(0.03) |
| |
|
|
|
|
|
|
|
|
|
|
| CAPEX |
US$ mm |
|
|
|
|
|
|
|
|
|
| |
|
|
|
|
|
|
|
|
|
|
| Sustaining |
|
9.1 |
9.4 |
8.0 |
26.5 |
12.8 |
8.6 |
9.4 |
7.3 |
25.3 |
| Other |
|
2.0 |
1.5 |
0.4 |
3.9 |
2.1 |
1.0 |
0.8 |
0.5 |
2.3 |
(1) Our cash cost and sustaining cash cost
are net of by-products credits, measured with respect to zinc sold per mine. For a cash cost reconciliation to COGS, please refer to Appendix
– All in Sustaining Cash Cost | Mining.
(2) Our cost per ROM is measured with respect
to treated ore volume. Refer to “Use of Non-IFRS Financial Measures” for further information.
Zinc production of 22kt increased 9% year-over-year
and 28% quarter-over-quarter.
During 3Q23, according to the mine sequencing
plan, areas with better zinc grades were prioritized, resulting in higher zinc production.
| | 17 |
Earnings Release – 3Q23 | |
Zinc head grade averaged 1.63% in the
quarter, up 20bps and 32bps compared to 3Q22 and 2Q23, respectively.
Copper production of 8kt increased by
11% compared to 3Q22 and increased by 10% compared to 2Q23. Copper average grade was 0.63%, up 9bps and 6bps from 3Q22 and 2Q23, respectively.
Lead production was 3.6kt, down 24% year-over-year
driven by lower treated ore and lead average grade in the period. Compared to 2Q23, lead production was relatively flat.
In the first nine months of 2023, zinc
production totaled 54kt, down 16% compared to 9M22. Copper and lead production were down 13% and 26%, to 21kt and 9kt, respectively, as
daily production for all metals was significantly reduced in 1Q23.
Cost
Cost of sales was US$89 million in 3Q23
compared to US$95 million in the same period last year, mainly due to depreciation and amortization and lower treated ore volume. Compared
to 2Q23, cost of sales increased by 2%, mainly driven by higher variable costs in line with higher volumes produced.
Run-of-mine mining cost was US$41.3/t
in the quarter, up 3% and 4% from 3Q22 and 2Q23, respectively, primarily explained by the increase in operational costs related to mine
development, which contributed to higher grades in the period.
Cash cost net of by-products in 3Q23 decreased
to US$(0.18)/lb compared with US$0.37/lb in 3Q22 and US$(0.13)/lb in 2Q23. The performance year-over-year was mainly explained by higher
by-products contribution, particularly lead and copper, while the quarter-over-quarter performance was explained by higher production
volumes, which was partially offset by lower by-products prices (copper and silver).
CAPEX
In 3Q23, sustaining capital expenditures
amounted to US$9.1 million, mainly related to mining development, and other mining infrastructure expenses, totaling US$26 million in
9M23.
El Porvenir
El Porvenir
(100% basis) |
|
3Q23 |
2Q23 |
1Q23 |
9M23 |
4Q22 |
3Q22 |
2Q22 |
1Q22 |
9M22 |
| |
|
|
|
|
|
|
|
|
|
|
| Ore Mined |
kt |
568 |
546 |
544 |
1,658 |
551 |
529 |
520 |
513 |
1,563 |
| Treated Ore |
kt |
568 |
546 |
544 |
1,658 |
550 |
527 |
521 |
514 |
1,562 |
| |
|
|
|
|
|
|
|
|
|
|
| Grade |
|
|
|
|
|
|
|
|
|
|
| |
|
|
|
|
|
|
|
|
|
|
| Zinc |
% |
2.89 |
2.89 |
2.82 |
2.87 |
2.61 |
2.77 |
2.86 |
2.96 |
2.86 |
| Copper |
% |
0.16 |
0.17 |
0.15 |
0.16 |
0.13 |
0.16 |
0.17 |
0.18 |
0.17 |
| Lead |
% |
1.36 |
1.35 |
1.38 |
1.36 |
1.38 |
1.34 |
1.34 |
1.31 |
1.33 |
| Silver |
oz/t |
2.22 |
2.42 |
2.55 |
2.39 |
2.64 |
2.45 |
2.35 |
2.41 |
2.40 |
| Gold |
oz/t |
0.010 |
0.011 |
0.011 |
0.011 |
0.012 |
0.011 |
0.011 |
0.013 |
0.012 |
| |
|
|
|
|
|
|
|
|
|
|
| Production | metal contained |
|
|
|
|
|
|
|
| |
|
|
|
|
|
|
|
|
|
|
| Zinc |
kt |
14.4 |
13.8 |
13.6 |
41.9 |
12.6 |
12.7 |
13.0 |
13.2 |
39.0 |
| Copper |
kt |
0.1 |
0.1 |
0.1 |
0.3 |
0.0 |
0.1 |
0.1 |
0.1 |
0.2 |
| Lead |
kt |
6.3 |
6.0 |
6.2 |
18.5 |
6.3 |
5.8 |
5.7 |
5.4 |
16.9 |
| | 18 |
Earnings Release – 3Q23 | |
El Porvenir
(100% basis) |
|
3Q23 |
2Q23 |
1Q23 |
9M23 |
4Q22 |
3Q22 |
2Q22 |
1Q22 |
9M22 |
| Silver |
MMoz |
1.0 |
1.1 |
1.2 |
3.3 |
1.2 |
1.0 |
1.0 |
1.0 |
3.0 |
| Gold |
koz |
2.0 |
2.2 |
2.3 |
6.6 |
2.5 |
2.4 |
2.1 |
2.2 |
6.7 |
| |
|
|
|
|
|
|
|
|
|
|
| Zinc sales |
kt |
14.5 |
14.5 |
14.4 |
43.5 |
12.1 |
12.4 |
14.0 |
13.5 |
39.9 |
| |
|
|
|
|
|
|
|
|
|
|
| Costs |
|
|
|
|
|
|
|
|
|
| |
|
|
|
|
|
|
|
|
|
|
| Cost of sales |
US$ mm |
47.8 |
48.1 |
51.8 |
147.7 |
39.2 |
40.1 |
45.6 |
42.9 |
128.7 |
| Cost ROM (2) |
US$/t |
57.5 |
63.1 |
60.1 |
60.2 |
58.6 |
58.5 |
60.1 |
62.1 |
60.2 |
| Cash cost (1) |
US$/lb |
0.20 |
0.35 |
0.22 |
0.26 |
(0.00) |
0.63 |
0.31 |
0.37 |
0.43 |
| Sustaining cash cost (1) |
US$/lb |
0.73 |
0.65 |
0.64 |
0.67 |
0.63 |
0.98 |
0.48 |
0.54 |
0.66 |
| |
|
|
|
|
|
|
|
|
|
|
| CAPEX |
US$ mm |
|
|
|
|
|
|
|
|
|
| |
|
|
|
|
|
|
|
|
|
|
| Sustaining |
|
16.7 |
9.7 |
13.4 |
39.8 |
16.6 |
9.4 |
5.1 |
4.7 |
19.1 |
| Other |
|
- |
(0.0) |
(0.0) |
(0.0) |
0.3 |
0.1 |
0.2 |
0.4 |
0.7 |
(1) Our cash cost and sustaining cash cost
are net of by-products credits, measured with respect to zinc sold per mine. For a cash cost reconciliation to COGS, please refer to Appendix
– All in Sustaining Cash Cost | Mining.
(2) Our cost per ROM is measured with respect
to treated ore volume. Refer to “Use of Non-IFRS Financial Measures” for further information.
In 3Q23, zinc production of 14kt was up
13% and 4% from 3Q22 and 2Q23, respectively. Zinc grade increased to 2.89% in the quarter, as production focused on cut and fill areas
with higher grades.
Lead production in 3Q23 increased by 9%
and 5% from 3Q22 and 2Q23, respectively, while silver production decreased by 2% and 5% from the same periods, respectively, as a result
of lower grades in the period.
The mine is running at full throughput
capacity and achieved 568kt of ore mined and treated ore in 3Q23, which represents its record production performance for a quarterly period.
In the first nine months of 2023, zinc
production totaled 42kt, up 7% compared to 9M22. Lead and silver production were up 9% to 18kt and 8% to 3MMoz, respectively, following
higher average grades.
Cost
Cost of sales was US$48 million in 3Q23
compared to US$40 million in 3Q22 due to higher inventory costs and inflation, which impacted mainly third-party services. Compared to
2Q23, cost of sales was relatively flat.
Run-of-mine mining cost was US$58/t in
the quarter, down 2% and 9% from 3Q22 and 2Q23, mainly driven by higher treated ore.
Cash cost net of by-products in 3Q23 decreased
to US$0.20/lb compared to 3Q22, mainly driven by higher by-products contribution, explained by higher lead prices and volumes. Compared
to 2Q23, cash cost decreased US$0.14/lb due to lower operating costs and higher by-products contribution.
CAPEX
In 3Q23, sustaining capital expenditures
amounted to US$16.7 million, mainly related to mine development, the tailings dam project and other mining infrastructure implementation,
totaling US$40 million in 9M23.
Atacocha
| | 19 |
Earnings Release – 3Q23 | |
Atacocha
(100% basis) |
|
3Q23 |
2Q23 |
1Q23 |
9M23 |
4Q22 |
3Q22 |
2Q22 |
1Q22 |
9M22 |
| |
|
|
|
|
|
|
|
|
|
|
| Ore Mined |
kt |
290 |
363 |
342 |
995 |
394 |
339 |
325 |
296 |
960 |
| Treated Ore |
kt |
290 |
373 |
342 |
1,004 |
394 |
339 |
325 |
296 |
960 |
| |
|
|
|
|
|
|
|
|
|
|
| Grade |
|
|
|
|
|
|
|
|
|
|
| |
|
|
|
|
|
|
|
|
|
|
| Zinc |
% |
0.58 |
0.67 |
0.94 |
0.73 |
0.87 |
0.90 |
0.82 |
1.00 |
0.90 |
| Lead |
% |
0.84 |
0.80 |
1.23 |
0.96 |
1.20 |
0.96 |
0.83 |
0.82 |
0.87 |
| Silver |
oz/t |
1.33 |
1.11 |
1.24 |
1.21 |
1.26 |
0.99 |
0.99 |
0.94 |
0.97 |
| Gold |
oz/t |
0.009 |
0.010 |
0.012 |
0.010 |
0.013 |
0.016 |
0.015 |
0.015 |
0.016 |
| |
|
|
|
|
|
|
|
|
|
|
| Production | metal contained |
|
|
|
|
|
|
|
| |
|
|
|
|
|
|
|
|
|
|
| Zinc |
kt |
1.2 |
1.9 |
2.5 |
5.5 |
2.6 |
2.4 |
2.1 |
2.4 |
6.9 |
| Lead |
kt |
2.1 |
2.6 |
3.6 |
8.2 |
4.1 |
2.8 |
2.3 |
2.1 |
7.1 |
| Silver |
MMoz |
0.3 |
0.3 |
0.4 |
1.0 |
0.4 |
0.3 |
0.3 |
0.2 |
0.7 |
| Gold |
koz |
1.4 |
2.2 |
2.6 |
6.2 |
3.1 |
3.8 |
3.6 |
3.1 |
10.5 |
| |
|
|
|
|
|
|
|
|
|
|
| Zinc sales |
kt |
1.1 |
2.4 |
2.3 |
5.8 |
2.9 |
2.3 |
2.3 |
2.1 |
6.7 |
| |
|
|
|
|
|
|
|
|
|
|
| Costs |
|
|
|
|
|
|
|
|
|
| |
|
|
|
|
|
|
|
|
|
|
| Cost of sales |
US$ mm |
13.1 |
19.8 |
16.5 |
49.5 |
23.3 |
15.7 |
21.1 |
15.3 |
52.1 |
| Cost ROM (2) |
US$/t |
30.7 |
31.7 |
36.6 |
33.1 |
35.7 |
37.7 |
35.5 |
38.0 |
37.1 |
| Cash cost (1) |
US$/lb |
(1.22) |
(1.05) |
(0.12) |
(0.72) |
(1.54) |
0.54 |
(1.28) |
(0.30) |
(0.35) |
| Sustaining cash cost (1) |
US$/lb |
(0.19) |
(0.58) |
0.81 |
0.05 |
(1.36) |
0.64 |
(1.14) |
0.14 |
(0.13) |
| |
|
|
|
|
|
|
|
|
|
|
| CAPEX |
US$ mm |
|
|
|
|
|
|
|
|
|
| |
|
|
|
|
|
|
|
|
|
|
| Sustaining |
|
2.6 |
2.5 |
4.7 |
9.7 |
1.1 |
0.5 |
0.8 |
2.0 |
3.3 |
| Other |
|
0.0 |
0.0 |
(0.0) |
0.0 |
0.1 |
- |
(0.0) |
0.0 |
0.0 |
(1) Our cash cost and sustaining cash cost
are net of by-products credits, measured with respect to zinc sold per mine. For a cash cost reconciliation to COGS, please refer to Appendix
– All in Sustaining Cash Cost | Mining.
(2) Our cost per ROM is measured with respect
to treated ore volume. Refer to “Use of Non-IFRS Financial Measures” for further information.
As previously disclosed, Atacocha mine
production was temporarily suspended at the end of June 2023 due to illegal protest activities by local communities and operations could
only be resumed at the end of July. As a result, production in 3Q23 was significantly reduced.
During the quarter, treated ore volume
decreased by 14% and 22% compared to 3Q22 and 2Q23, respectively.
Zinc production of 1.2kt in 3Q23 decreased
52% year-over-year and 38% quarter-over-quarter, zinc average grade was 0.58% down 32bps year-over-year and 9bps quarter-over-quarter.
Lead production decreased by 25% to 2.1kt
compared to 3Q22, while silver production increased to 321koz. Compared to 2Q23, lead and silver production decreased by 18% and 8%, respectively.
| | 20 |
Earnings Release – 3Q23 | |
Illegal protest activities also affected
stripping activities, and consequently, the preparation of high-grade areas was reduced during 3Q23.
In 9M23, treated ore volume totaled 1,004kt,
up 5% from the same period last year. On the other hand, zinc production was down from 6.9kt to 5.5kt, while lead and silver increased
by 15% to 8kt and 37% to 1,025koz, respectively.
Cost
Cost of sales was US$13 million in 3Q23
compared to US$16 million in the same period last year, following lower maintenance and lower treated ore volumes. Compared to 2Q23, cost
of sales decreased by 34%, also explained by the reduction in volume of stripping and mined ore, in addition to lower idleness costs.
Run-of-mine mining cost was US$31/t in
the quarter, down 19% and 3% from 3Q22 and 2Q23, respectively, mainly explained by lower idleness costs.
Cash cost net of by-products was US$(1.22)/lb
in 3Q23 compared with US$0.54/lb in 3Q22 due to higher by-products contribution, lower operating costs and lower volumes. Compared to
2Q23, cash cost net of by-products was down US$0.17/lb, mainly explained by lower volumes, which was partially offset by lower by-products
contribution.
CAPEX
In 3Q23, sustaining capital expenditures
amounted to US$2.6 million, mainly driven by the tailings dam deposit area and system, totaling US$9.7 million in 9M23.
Vazante
Vazante
(100% basis) |
|
3Q23 |
2Q23 |
1Q23 |
9M23 |
4Q22 |
3Q22 |
2Q22 |
1Q22 |
9M22 |
| |
|
|
|
|
|
|
|
|
|
|
| Ore Mined |
kt |
384 |
366 |
385 |
1,135 |
372 |
376 |
381 |
264 |
1,021 |
| Treated Ore |
kt |
427 |
405 |
394 |
1,226 |
395 |
416 |
408 |
305 |
1,130 |
| |
|
|
|
|
|
|
|
|
|
|
| Grade |
|
|
|
|
|
|
|
|
|
|
| |
|
|
|
|
|
|
|
|
|
|
| Zinc |
% |
10.22 |
10.25 |
10.44 |
10.30 |
9.87 |
10.06 |
10.29 |
9.57 |
10.01 |
| Lead |
% |
0.35 |
0.35 |
0.34 |
0.35 |
0.36 |
0.31 |
0.32 |
0.35 |
0.33 |
| Silver |
oz/t |
0.70 |
0.66 |
0.69 |
0.68 |
0.63 |
0.62 |
0.65 |
0.61 |
0.63 |
| |
|
|
|
|
|
|
|
|
|
|
| Production | metal contained |
|
|
|
|
|
|
|
| |
|
|
|
|
|
|
|
|
|
|
| Zinc |
kt |
38.4 |
36.6 |
35.8 |
110.8 |
33.7 |
36.4 |
36.5 |
24.9 |
97.9 |
| Lead |
kt |
0.4 |
0.4 |
0.4 |
1.2 |
0.4 |
0.3 |
0.3 |
0.2 |
0.8 |
| Silver |
MMoz |
0.2 |
0.2 |
0.1 |
0.4 |
0.1 |
0.1 |
0.1 |
0.1 |
0.3 |
| |
|
|
|
|
|
|
|
|
|
|
| Zinc sales |
kt |
38.4 |
36.6 |
35.8 |
110.8 |
33.7 |
36.4 |
36.5 |
24.9 |
97.9 |
| |
|
|
|
|
|
|
|
|
|
|
| Costs |
|
|
|
|
|
|
|
|
|
| |
|
|
|
|
|
|
|
|
|
|
| Cost of sales |
US$ mm |
33.5 |
32.0 |
29.8 |
95.3 |
30.1 |
30.0 |
29.4 |
26.5 |
85.9 |
| Cost ROM (2) |
US$/t |
57.7 |
57.0 |
55.4 |
56.7 |
53.6 |
47.1 |
45.5 |
43.7 |
45.4 |
| Cash cost (1) |
US$/lb |
0.63 |
0.61 |
0.63 |
0.62 |
0.58 |
0.59 |
0.57 |
0.46 |
0.55 |
| | 21 |
Earnings Release – 3Q23 | |
| Sustaining cash cost (1) |
US$/lb |
0.72 |
0.72 |
0.71 |
0.72 |
0.72 |
0.72 |
0.68 |
0.62 |
0.68 |
| |
|
|
|
|
|
|
|
|
|
|
| CAPEX |
US$ mm |
|
|
|
|
|
|
|
|
|
| |
|
|
|
|
|
|
|
|
|
|
| Sustaining |
|
7.2 |
8.8 |
6.2 |
22.2 |
13.4 |
9.9 |
8.6 |
7.7 |
26.1 |
| Other |
|
1.7 |
0.8 |
0.2 |
2.7 |
7.2 |
6.6 |
1.0 |
1.4 |
8.9 |
(1) Our cash cost and sustaining cash cost
are net of by-products credits, measured with respect to zinc sold per mine. For a cash cost reconciliation to COGS, please refer to Appendix
– All in Sustaining Cash Cost | Mining.
(2) Our cost per ROM is measured with respect
to treated ore volume. Refer to “Use of Non-IFRS Financial Measures” for further information.
Zinc production of 38kt in 3Q23 was up
5% compared to 3Q22 and 2Q23, mainly explained by the better performance of the plant in the period due to the increase in the mill’s
capacity.
Zinc head grade averaged 10.22% (up 16bps
from 3Q22 and down 3bps from 2Q23).
In 9M23, treated ore volume totaled 1,226kt,
up 9% from the same period of last year. As a result, zinc production increased by 13% to 111kt from 9M22.
Cost
Cost of sales was US$34 million in 3Q23
compared to US$30 million in 3Q22, primarily explained by higher volumes, in addition to higher fixed costs, and variable costs, which
were impacted by inflation in the period. Compared to 2Q23, cost of sales increased by 5%, mainly related to higher volumes and FX rate
effect.
Run-of-mine mining cost was US$58/t in
3Q23 compared to US$47/t in 3Q22 and US$57/t in 2Q23, explained by lower FX rate and inflation.
Cash cost net of by-products increased
to US$0.63/lb compared with US$0.59/lb in 3Q22, explained mainly by slightly higher operational cost and FX effects. Compared to 2Q23,
cash cost increased by 3% due to lower by-products volumes.
CAPEX
In 3Q23, sustaining capital expenditures
amounted to US$7.2 million, mainly related to mine development and other mining infrastructure upgrades, totaling US$22 million in 9M23.
Morro Agudo
Morro Agudo
(100% basis) |
|
3Q23 |
2Q23 |
1Q23 |
9M23 |
4Q22 |
3Q22 |
2Q22 |
1Q22 |
9M22 |
| |
|
|
|
|
|
|
|
|
|
|
| Ore Mined |
kt |
291 |
283 |
265 |
839 |
233 |
226 |
240 |
208 |
675 |
| Treated Ore |
kt |
330 |
320 |
296 |
946 |
254 |
259 |
259 |
245 |
763 |
| |
|
|
|
|
|
|
|
|
|
|
| Grade |
|
|
|
|
|
|
|
|
|
|
| |
|
|
|
|
|
|
|
|
|
|
| Zinc |
% |
2.03 |
1.79 |
2.02 |
1.95 |
1.99 |
1.91 |
2.09 |
2.26 |
2.09 |
| Lead |
% |
0.98 |
0.81 |
0.91 |
0.90 |
0.94 |
0.81 |
0.76 |
0.88 |
0.81 |
| |
|
|
|
|
|
|
|
|
|
|
| Production | metal contained |
|
|
|
|
|
|
|
| |
|
|
|
|
|
|
|
|
|
|
| Zinc |
kt |
6.0 |
5.1 |
5.3 |
16.4 |
4.6 |
4.6 |
4.7 |
4.7 |
14.1 |
| Lead |
kt |
2.6 |
1.9 |
1.9 |
6.4 |
1.8 |
1.7 |
1.5 |
1.3 |
4.5 |
| |
|
|
|
|
|
|
|
|
|
|
| | 22 |
Earnings Release – 3Q23 | |
| Zinc sales |
kt |
6.0 |
5.1 |
5.3 |
16.4 |
4.6 |
4.6 |
4.7 |
4.7 |
14.1 |
| |
|
|
|
|
|
|
|
|
|
|
| Costs |
|
|
|
|
|
|
|
|
|
| |
|
|
|
|
|
|
|
|
|
|
| Cost of sales |
US$ mm |
16.6 |
17.6 |
15.5 |
49.7 |
18.0 |
15.1 |
17.7 |
13.0 |
45.8 |
| Cost ROM (2) |
US$/t |
22.9 |
31.7 |
36.9 |
30.6 |
54.4 |
31.6 |
41.2 |
43.4 |
38.6 |
| Cash cost (1) |
US$/lb |
0.61 |
0.87 |
1.05 |
0.83 |
1.26 |
1.00 |
0.74 |
0.93 |
0.89 |
| Sustaining cash cost (1) |
US$/lb |
0.67 |
0.97 |
1.07 |
0.89 |
1.46 |
1.09 |
0.97 |
1.06 |
1.04 |
| |
|
|
|
|
|
|
|
|
|
|
| CAPEX |
US$ mm |
|
|
|
|
|
|
|
|
|
| |
|
|
|
|
|
|
|
|
|
|
| Sustaining |
|
0.8 |
1.0 |
0.2 |
2.1 |
1.9 |
0.9 |
2.3 |
1.1 |
4.4 |
| Other |
|
0.0 |
0.1 |
0.0 |
0.1 |
0.2 |
0.1 |
0.1 |
0.2 |
0.4 |
(1) Our cash cost and sustaining cash cost
are net of by-products credits, measured with respect to zinc sold per mine. For a cash cost reconciliation to COGS, please refer to Appendix
– All in Sustaining Cash Cost | Mining.
(2) Our cost per ROM is measured with respect
to treated ore volume. Refer to “Use of Non-IFRS Financial Measures” for further information.
Zinc production of 6.0kt in 3Q23 increased
by 31% compared to 3Q22, mainly explained by higher treated ore. Compared to 2Q23, production increased by 19% due to higher grades. Zinc
head grade averaged 2.03%, up 12bps and 25bps compared to 3Q22 and 2Q23, respectively.
In 9M23, zinc production totaled 16kt,
up 16% compared to 9M22. As previously disclosed, several initiatives related to the prioritization of the mine deepening development
to increase underground production and mining flexibility were implemented last year, which are supporting the positive zinc production
results that we achieved throughout 2023.
Cost
Cost of sales was US$17 million in 3Q23
and was up 10% compared to the same period last year, following higher treated ore volume, lower FX rate and higher operating costs, which
was impacted by inflation in the period. Compared to 2Q23, cost of sales decreased by 6%, mainly explained by lower depreciation and amortization.
Run-of-mine mining cost was US$23/t in
the quarter, down 28% from 3Q22 and 2Q23, mainly explained by higher volumes.
In 3Q23, cash cost net of by-products
was US$0.61/lb compared with US$1.00/lb in 3Q22 due to higher by-products contribution and lower operational costs, offsetting inflation
and lower FX rate impacts. Compared to 2Q23, cash cost decreased by US$0.26/lb due to lower operational costs, higher volumes, and higher
by-products contribution.
CAPEX
In 3Q23, sustaining capital expenditures
amounted to US$0.8 million, mainly related to mine development and structural upgrade, totaling US$2.1 million in 9M23.
Aripuanã
Aripuanã
(100% basis) |
|
3Q23 |
2Q23 |
1Q23 |
9M23 |
4Q22 |
3Q22 |
2Q22 |
1Q22 |
9M22 |
| |
|
|
|
|
|
|
|
|
|
|
| Ore Mined |
kt |
237 |
61 |
157 |
446 |
42 |
- |
- |
- |
- |
| Treated Ore |
kt |
315 |
372 |
277 |
965 |
100 |
- |
- |
- |
- |
| |
|
|
|
|
|
|
|
|
|
|
| Grade |
|
|
|
|
|
|
|
|
|
|
| | 23 |
Earnings Release – 3Q23 | |
Aripuanã
(100% basis) |
|
3Q23 |
2Q23 |
1Q23 |
9M23 |
4Q22 |
3Q22 |
2Q22 |
1Q22 |
9M22 |
| |
|
|
|
|
|
|
|
|
|
|
| Zinc |
% |
3.66 |
2.92 |
2.98 |
3.18 |
2.44 |
- |
- |
- |
- |
| Copper |
% |
0.65 |
0.74 |
0.57 |
0.66 |
0.49 |
- |
- |
- |
- |
| Lead |
% |
1.14 |
0.94 |
1.04 |
1.03 |
- |
- |
- |
- |
- |
| Silver |
oz/t |
0.97 |
0.89 |
0.86 |
0.91 |
0.61 |
- |
- |
- |
- |
| Gold |
oz/t |
0.017 |
0.013 |
0.013 |
0.015 |
0.011 |
- |
- |
- |
- |
| |
|
|
|
|
|
|
|
|
|
|
| Production | metal contained |
|
|
|
|
|
|
|
| |
|
|
|
|
|
|
|
|
|
|
| Zinc |
kt |
5.8 |
6.5 |
2.5 |
14.7 |
0.7 |
- |
- |
- |
- |
| Copper |
kt |
1.0 |
1.2 |
0.9 |
3.1 |
0.2 |
- |
- |
- |
- |
| Lead |
kt |
1.5 |
1.5 |
1.1 |
4.1 |
- |
- |
- |
- |
- |
| Silver |
MMoz |
0.1 |
0.1 |
0.1 |
0.3 |
0.0 |
- |
- |
- |
- |
| Gold |
koz |
2.4 |
1.7 |
0.9 |
5.0 |
0.3 |
- |
- |
- |
- |
| CAPEX |
US$ mm |
|
|
|
|
|
|
|
|
|
| |
|
|
|
|
|
|
|
|
|
|
| Sustaining |
|
19.9 |
15.9 |
15.2 |
51.0 |
- |
- |
- |
- |
- |
| Other (1) |
|
3.1 |
(19.3) |
(2.8) |
(19.1) |
|
|
|
|
- |
(1) The negative amounts are mainly related
to reclassifications between Aripuanã and Corporate, and capitalization of interest net of advanced payments for imported materials
and tax credits.
In 3Q23, treated ore volume decreased
by 15% to 315kt. Zinc production was 5.8kt (vs. 6.5kt in 2Q23), while zinc average grade was 3.66%, mainly explained by challenges at
the plant and process adjustments that occurred in the period and are still ongoing.
Copper production was 1.0kt (copper average
grade was 0.65%) and followed the same trend as zinc production.
As previously disclosed in our press
release dated October 24, 2023, at the beginning of 3Q23, the plant performance was averaging
above 75% of nameplate capacity. We then observed design limitations in the capacity of the flotation pumping system, identified during
the detection of bottlenecks in March, which required resizing and upgrade along with certain plant processing facilities and systems,
as well as the clean-up and upgrading of water treatment facilities, which will also contribute to a better resiliency during the rainy
season (which is expected to run from December to March. Due to the aforementioned limitations, in 3Q23, we reduced plant throughput
and, as a result, the utilization rate in was also reduced in the period and the plant performed at an average of 56% in the quarter.
With the clearing of bottlenecks in the
pumping and piping systems carried out in March 2023, we had anticipated that the plant could reach 100% of nameplate capacity by the
end of 2023, as the permanent replacement of the pumps to increase capacity, in line with the revised design of the flotation pumping
system, was scheduled to take place by the end of 3Q23, or at the beginning of 4Q23. However, the lead time to receive and assemble part
of the equipment, due to changes to specification, is now expected to take place in 1Q24. Meanwhile, the plant is undergoing some process
and equipment adjustments, and it is expected to gradually return to an average of 70% capacity utilization level during 4Q23 until the
upgrades are completed, while nameplate capacity is expected to reach 100% in 1H24.
In 3Q23, despite the reduction in the
utilization rate, the operational focus was to maintain concentrate quality and grades, as well as the metallurgical recovery rates, with
zinc recovery reaching 59% at the end of the period, remaining stable
at the same level as achieved in 2Q23, while copper and lead recovery improved, averaging 51% and 43% in 3Q23 versus 35% and 41% in 2Q23.
| | 24 |
Earnings Release – 3Q23 | |
We continue with mine development activities
at both the Arex and Link mines. At the end of 3Q23, approximately 132kt of ore was available in stockpiles (versus 188kt in 2Q23), which
is aligned with the strategy to reduce intermediate ore stocks and increase mine production to directly feed the plant.
ROM production in 3Q23 reached 236.9kt
compared to 60.9 kt in 2Q23 (up 290%), mainly explained by the start of production of the VRM method (Vertical Retreat Mining), which
will contribute positively to increase mine productivity and efficiency.
Horizontal mine development reached a
cumulated amount of 1,299 meters developed for both the Arex and Link mines in 3Q23 compared to 1,652 meters in 2Q23, following the current
plan to transition from outsourced development to an insourced team. The expectation is that the insourced team could reach 2,000 meters
in 4Q23 and 3,000 meters from 1Q24.
CAPEX
In 3Q23, sustaining capital expenditures
amounted to US$19.9 million, mainly related to mining development, mining infrastructure (tailing deposits and wetlands), task force and
other sustaining activities, totaling US$51 million in 9M23.
Financial performance
| US$ million |
|
3Q23 |
2Q23 |
3Q22 |
3Q23 vs. 3Q22 |
9M23 |
9M22 |
9M23 vs. 9M22 |
| Net Revenues |
|
272.6 |
268.2 |
241.3 |
13.0% |
808.5 |
932.8 |
(13.3%) |
| Cost of Sales (1) |
|
(245.9) |
(255.6) |
(193.4) |
27.2% |
(745.0) |
(602.3) |
23.7% |
| Gross Profit |
|
26.6 |
12.6 |
47.9 |
(44.5%) |
63.5 |
330.6 |
(80.8%) |
| Adjusted EBITDA |
|
40.4 |
20.0 |
63.7 |
(36.5%) |
101.9 |
361.9 |
(71.8%) |
| Adjusted EBITDA Mrg. |
|
14.8% |
7.4% |
26.4% |
(11.6pp) |
12.6% |
38.8% |
(26.2pp) |
Note: Financial performance pre intersegment
eliminations. (1) Includes the cost of sales of Aripuanã of US$43 million in 3Q23 and US$60 million in 2Q23, totaling
US$144 million in 9M23.
Net revenues for the mining segment
totaled US$273 million in 3Q23, up 13% versus 3Q22. This performance was mainly driven by (i) higher zinc, copper and lead volumes, which
was partially offset by (ii) the decrease in LME metal prices and (iii) higher TCs. Compared to 2Q23, net revenues increased by 2%, mainly
due to the increase in production across all base metals, which was partially offset by lower LME metal prices, except for lead.
In 9M23, net revenues amounted to US$809
million, 13% lower when compared to the same period a year ago, due to lower LME metal prices, partially offset by higher volumes.
Cost of sales in 3Q23 was US$246
million, including US$43 million from Aripuanã with a higher unit cost (ramp-up phase). Excluding the effect of Aripuanã,
cost of sales increased to US$203 million, due to higher sales volumes, when compared to US$193 million in 3Q22 and US$195 million in
2Q23, due to higher sales volumes.
Reconciliation of realized prices
Revenues are recorded at provisional prices
and, typically, an adjustment is then made after delivery, based on the pricing terms under the relevant contract. In addition, the difference
between the provisional and the final price received is recognized by adjusting the price in the period in which the sale is concluded.
| | 25 |
Earnings Release – 3Q23 | |
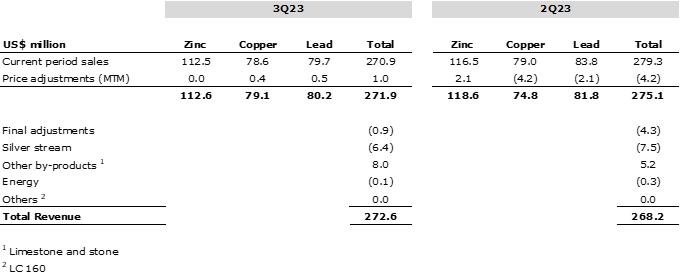
Adjusted EBITDA for the mining
segment in 3Q23 was US$40 million compared to US$64 million in 3Q22. This decrease was primarily explained by (i) the negative net impact
of US$38 million, mainly related to Aripuanã’s cost of sales in the quarter and higher maintenance costs in Brazil and Peru;
(ii) the negative net price effect of US$26 million, mainly due to lower LME metal prices of US$50 million and higher TCs of US$5 million,
partially offset by the positive effect of variation in MTM (“mark-to-market”) of US$27 million; (iii) negative impact of
FX variation of US$4 million, which were partially offset by (iv) the positive impact of US$33 million due to the increase in volumes,
related to the access to higher grade areas in Cerro Lindo, higher volumes in Vazante and El Porvenir, as well as volumes from Aripuanã;
and (v) higher by-products contribution of US$17 million, mainly related to higher prices and volumes of lead and copper concentrates.
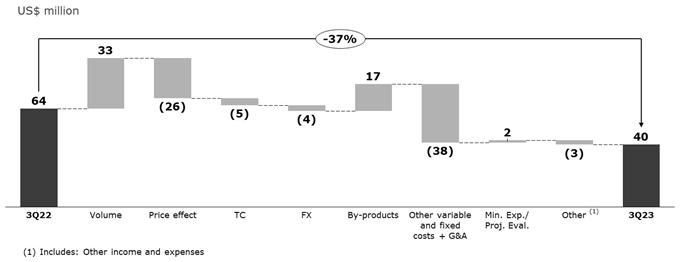
Compared to 2Q23, Adjusted EBITDA increased
by 103%. This performance was mainly driven by (i) the positive impact of US$13 million due to higher volumes related to higher treated
ore and the access to higher grade areas in Cerro Lindo; (ii) the positive impact of US$15 million due to lower operational costs in Aripuanã,
related to concentrate and ore stockpile costs, which was partially offset by (iii) the negative price effect of US$4 million due to lower
LME metal prices; and (iv) lower by-products contribution of US$3 million due to lower silver and gold payables, partially offset by higher
prices and volumes of limestone sales.
| | 26 |
Earnings Release – 3Q23 | |
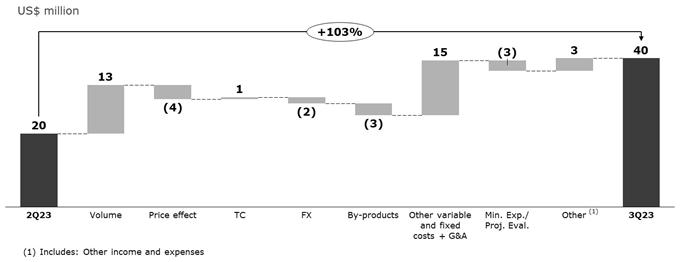
Cash cost and AISC 7,8
| Consolidated cash cost |
3Q23 |
2Q23 |
3Q22 |
3Q23 vs. 3Q22 |
9M23 |
9M22 |
9M23 vs. 9M22 |
| Run-of-mine mining cost |
US$/t |
43.6 |
43.9 |
43.2 |
1.0% |
44.2 |
43.6 |
1.4% |
| Cash cost net of by-products |
US$/t |
769 |
817 |
1,267 |
(39.3%) |
842 |
684 |
23.0% |
| AISC net of by-products |
US$/t |
1,712 |
1,423 |
2,115 |
(19.1%) |
1,657 |
1,551 |
6.8% |
| Cash cost net of by-products |
US$/lb |
0.35 |
0.37 |
0.57 |
(39.3%) |
0.38 |
0.31 |
23.0% |
| AISC net of by-products |
US$/lb |
0.78 |
0.65 |
0.96 |
(19.1%) |
0.75 |
0.70 |
6.8% |
Note: Cash cost and AISC per ton sold does
not include the impact of the cost of idleness capacity of US$1.7 million in Atacocha in 3Q23, US$5.2 million in Cerro Lindo and US$2.6
million in Atacocha in 9M23, and US$4.4 million in Vazante and US$2.1 million in Atacocha in 9M22.
Cash cost net of by-products for
the mining segment in 3Q23 decreased to US$0.35/lb compared to US$0.57/lb in 3Q22. This decrease was primarily due to higher by-products
contribution, mainly explained by higher lead prices and higher copper concentrate volumes.
Compared to 2Q23, cash cost decreased
by US$0.02/lb due to higher volumes produced, which was partially offset by lower by-products contribution.
Run-of-mine mining cost was US$44/t in
the quarter, up 1% from 3Q22 explained by inflation, higher third-party services, and maintenance expenses. Compared to 2Q23, run-of-mine
mining cost was relatively flat, mainly due to lower operational costs.
AISC net of by-products in 3Q23 was US$0.78/lb,
down by 19% and up by 20% compared to US$0.96/lb in 3Q22 and US$0.65/lb in 2Q23, respectively.
For a reconciliation of cash cost and
AISC net of by-products, please refer to the appendix section “All in Sustaining Cash Cost | Mining”.
7
Our cash cost and AISC are net of by-products credits, measured with respect to zinc sold.
8 AISC does not include Aripuanã.
| | 27 |
Earnings Release – 3Q23 | |
Smelting segment
| Consolidated |
|
3Q23 |
2Q23 |
3Q22 |
3Q23 vs. 3Q22 |
9M23 |
9M22 |
9M23 vs. 9M22 |
| Production |
|
|
|
|
|
|
|
|
| Zinc metal |
kt |
140.1 |
139.1 |
147.4 |
(4.9%) |
417.2 |
417.8 |
(0.1%) |
| Global Recovery |
% |
91.5 |
93.0 |
92.9 |
(136bps) |
92.3 |
93.8 |
(149bps) |
| Zinc oxide |
kt |
9.6 |
8.4 |
11.1 |
(13.5%) |
26.2 |
32.2 |
(18.8%) |
| Total |
kt |
149.7 |
147.5 |
158.5 |
(5.5%) |
443.4 |
450.0 |
(1.5%) |
| Sales |
|
|
|
|
|
|
|
|
| Zinc metal |
kt |
144.5 |
140.4 |
151.7 |
(4.7%) |
420.6 |
417.0 |
0.9% |
| Zinc oxide |
kt |
9.4 |
8.5 |
10.7 |
(12.1%) |
25.9 |
31.8 |
(18.4%) |
| Total |
kt |
153.9 |
148.9 |
162.3 |
(5.2%) |
446.5 |
448.8 |
(0.5%) |
In 3Q23, total production was 150kt, down
6% year-over-year driven by lower volumes in the Cajamarquilla and Juiz de Fora units, mainly explained by operational instabilities in
the roaster and maintenance in the period, respectively. Compared to 2Q23, production was up 1%.
In 3Q23, zinc metal and oxide sales were
154kt, down by 5% from 3Q22 following lower production volumes, in addition to lower demand for zinc oxide in the period. Compared to
2Q23, metal sales grew 3% driven by slightly higher production volumes, particularly in Três Marias, and our sales strategy (better
price and premium conditions at the end of the quarter) in line with working capital improvement initiatives.
In 9M23, total production amounted to
443kt and was down 1% compared to the same period a year ago due to the aforementioned reasons. Total sales decreased by 0.5% to 447kt,
including 26kt from zinc oxide.
Peru
Cajamarquilla
(100% basis) |
|
3Q23 |
2Q23 |
1Q23 |
9M23 |
4Q22 |
3Q22 |
2Q22 |
1Q22 |
9M22 |
| |
|
|
|
|
|
|
|
|
|
|
| Zinc metal production |
kt |
80.8 |
82.7 |
81.3 |
244.9 |
86.4 |
85.6 |
84.1 |
76.7 |
246.4 |
| Zinc metal sales |
kt |
87.1 |
81.2 |
78.8 |
247.0 |
93.0 |
92.1 |
81.0 |
74.3 |
247.4 |
| |
|
|
|
|
|
|
|
|
|
|
| Zinc content in products |
kt |
87.0 |
81.1 |
78.6 |
246.7 |
92.7 |
91.5 |
78.5 |
71.4 |
241.3 |
| |
|
|
|
|
|
|
|
|
|
|
| Cost of sales (2) |
US$ mm |
261 |
218 |
261 |
739 |
317 |
337 |
287 |
278 |
902 |
| (-) Raw material |
|
(147) |
(156) |
(199) |
(502) |
(214) |
(238) |
(236) |
(235) |
(709) |
| (+) By-product |
|
(9.1) |
(7.6) |
(6.7) |
(23.5) |
(7.9) |
(6.5) |
(8.1) |
(5.1) |
(19.7) |
| (+/-) Consolidation effects |
(48.5) |
(8.5) |
(6.4) |
(63.4) |
(50.9) |
(40.5) |
17.6 |
5.5 |
(17.5) |
| (+) Others |
|
(5.5) |
7.7 |
2.2 |
4.4 |
4.8 |
1.5 |
(6.4) |
(0.6) |
(5.4) |
| (=) Conversion cost |
US$ mm |
50.8 |
53.4 |
50.4 |
154.5 |
49.2 |
52.9 |
54.2 |
43.2 |
150.4 |
| Conversion cost |
US$/lb |
0.26 |
0.30 |
0.29 |
0.28 |
0.24 |
0.26 |
0.31 |
0.27 |
0.28 |
| |
|
|
|
|
|
|
|
|
|
|
| Cash cost (1) |
US$/lb |
0.97 |
1.06 |
1.17 |
1.07 |
1.18 |
1.34 |
1.32 |
1.12 |
1.32 |
| Sustaining cash cost (1) |
US$/lb |
1.01 |
1.09 |
1.20 |
1.09 |
1.25 |
1.40 |
1.41 |
1.15 |
1.38 |
| |
|
|
|
|
|
|
|
|
|
|
| | 28 |
Earnings Release – 3Q23 | |
Cajamarquilla
(100% basis) |
|
3Q23 |
2Q23 |
1Q23 |
9M23 |
4Q22 |
3Q22 |
2Q22 |
1Q22 |
9M22 |
| CAPEX |
US$ mm |
|
|
|
|
|
|
|
|
|
| |
|
|
|
|
|
|
|
|
|
|
| Sustaining |
|
6.2 |
3.2 |
4.0 |
13.4 |
10.2 |
10.0 |
13.1 |
5.2 |
28.3 |
| Other |
|
1.1 |
1.3 |
0.5 |
2.9 |
2.7 |
2.2 |
1.4 |
0.6 |
4.1 |
(1) Our cash cost and sustaining cash cost
are net of by-products credits, measured with respect to zinc sold per smelter. For a cash cost reconciliation to COGS, please refer to
Appendix - Conversion and All in Sustaining Cash Cost | Smelting.
(2) Cost of sales does not include resale
operations from third parties.
In 3Q23, Cajamarquilla smelter production
was 81kt, down 6% and 2% compared to 3Q22 and 2Q23, respectively, mainly explained lower roaster utilization, which presented some instabilities
that have been adjusted throughout the period.
Recovery rates averaged 92.6% during the
quarter compared to 94.4% in 3Q22 and 93.8% in 2Q23.
Metal sales totaled 87kt in 3Q23 and were
down 5% year-over-year, following lower production volumes in the period. Compared to 2Q23, sales increased by 7% due to the sales strategy
in line with working capital improvement initiatives.
In 9M23, smelter production totaled 245kt,
down 1% compared to 9M22.
Costs
Cost of sales was US$261 million in 3Q23
compared to US$337 million in the same period last year, mainly explained by lower raw material costs due to lower LME metal prices. Compared
to 2Q23, cost of sales increased by 20%, primarily due to hedge effect on inventories.
In 3Q23, conversion cost was US$0.26/lb
and remained relatively flat compared to 3Q22. Compared to 2Q23, conversion cost decreased by US$0.03/lb explained by higher contained
zinc sales.
Cash cost net of by-products in 3Q23 was
US$0.97/lb compared to US$1.34/lb in 3Q22 and US$1.06/lb in 2Q23. In both periods, cash cost decreased, mainly due to lower LME zinc prices
which reduced concentrate purchase cost.
CAPEX
In 3Q23, sustaining capital expenditures
amounted to US$6.2 million, mainly due to the acquisition and repairs of equipment, totaling US$13.4 million in 9M23.
Brazil
In 3Q23, smelter production amounted to
69kt, down 5% compared to the same period last year. Compared to 2Q23, smelter production was up 6% explained by better performance in
the Três Marias unit.
Total sales volume (zinc metal + zinc
oxide) amounted to 67kt and decreased by 5% and 2% from 3Q22 and 2Q23, respectively, mainly driven by lower production volumes at Juiz
de Fora, in addition to lower demand, particularly for zinc oxide.
In 9M23, smelter production was 198kt,
3% lower compared to 9M22. Metal sales increased by 2% to 174kt, while total sales volume (zinc metal + oxide) decreased by 1% to 200kt.
Três Marias
Três Marias
(100% basis) |
|
3Q23 |
2Q23 |
1Q23 |
9M23 |
4Q22 |
3Q22 |
2Q22 |
1Q22 |
9M22 |
| |
|
|
|
|
|
|
|
|
|
|
| Zinc metal production |
kt |
39.0 |
35.7 |
37.9 |
112.6 |
40.5 |
39.6 |
40.2 |
29.3 |
109.1 |
| Zinc oxide production |
kt |
9.6 |
8.4 |
8.2 |
26.2 |
8.1 |
11.1 |
11.2 |
9.9 |
32.2 |
| | 29 |
Earnings Release – 3Q23 | |
Três Marias
(100% basis) |
|
3Q23 |
2Q23 |
1Q23 |
9M23 |
4Q22 |
3Q22 |
2Q22 |
1Q22 |
9M22 |
| Zinc metal sales |
kt |
38.0 |
38.9 |
36.8 |
113.7 |
44.1 |
37.3 |
39.9 |
30.5 |
107.7 |
| |
|
|
|
|
|
|
|
|
|
|
| Zinc content in products |
kt |
45.4 |
45.6 |
43.1 |
134.1 |
50.5 |
45.2 |
46.5 |
37.9 |
129.5 |
| |
|
|
|
|
|
|
|
|
|
|
| Cost of sales (2) |
US$ mm |
113 |
132 |
138 |
383 |
146 |
153 |
185 |
138 |
476 |
| (-) Raw material |
|
(43) |
(61) |
(85) |
(189) |
(90) |
(110) |
(133) |
(99) |
(341) |
| (+) By-product |
|
(17.5) |
(19.7) |
(12.9) |
(50.1) |
(14.3) |
(14.0) |
(17.0) |
(12.1) |
(43.1) |
| (+/-) Consolidation effects |
(5.6) |
2.1 |
0.9 |
(2.5) |
(2.1) |
1.8 |
(0.6) |
(2.6) |
(1.4) |
| (+) Others |
|
(21.3) |
(22.3) |
(18.8) |
(62.4) |
(14.4) |
(12.0) |
(14.8) |
(11.2) |
(38.0) |
| (=) Conversion cost |
US$ mm |
26.2 |
30.8 |
22.6 |
79.6 |
24.5 |
19.3 |
19.9 |
13.1 |
52.4 |
| Conversion cost |
US$/lb |
0.26 |
0.31 |
0.24 |
0.27 |
0.22 |
0.19 |
0.19 |
0.16 |
0.18 |
| |
|
|
|
|
|
|
|
|
|
|
| Cash cost (1) |
US$/lb |
0.97 |
1.18 |
1.36 |
1.16 |
1.17 |
1.37 |
1.67 |
1.47 |
1.51 |
| Sustaining cash cost (1) |
US$/lb |
1.01 |
1.25 |
1.40 |
1.22 |
1.28 |
1.49 |
1.78 |
1.54 |
1.61 |
| |
|
|
|
|
|
|
|
|
|
|
| CAPEX |
US$ mm |
|
|
|
|
|
|
|
|
|
| |
|
|
|
|
|
|
|
|
|
|
| Sustaining |
|
3.5 |
5.2 |
2.4 |
11.1 |
2.8 |
2.8 |
5.5 |
2.6 |
10.9 |
| Other |
|
1.2 |
2.1 |
1.4 |
4.7 |
9.5 |
9.1 |
6.4 |
3.5 |
19.0 |
(1) Our cash cost and sustaining cash cost
are net of by-products credits, measured with respect to zinc sold per smelter. For a cash cost reconciliation to COGS, please refer to
Appendix – Conversion and All in Sustaining Cash Cost | Smelting.
(2) Cost of sales does not include resale
operations from third parties.
In Três Marias total production
(zinc metal + oxide) decreased by 4% compared to 3Q22 due to lower zinc oxide demand. Production increased by 10% compared to 2Q23, mainly
explained by better operational performance, following the maintenance carried out last quarter.
Metallic zinc production was down 2% from
3Q22 and up 9% compared to 2Q23. Metallic zinc sales amounted to 38kt, up 2% year-over-year due to slightly higher sales volume in the
period. Compared to 2Q23, metallic zinc sales were down 2%, mainly explained by a relatively lower demand. In 3Q23, zinc oxide sales increased
to 9.4kt.
In 9M23, Três Marias total production
amounted to 139kt, down 2% compared to 9M22. Zinc metal sales increased by 6% to 114kt and zinc oxide sales decreased by 18% to 26kt.
Costs
Cost of sales of US$113 million in 3Q23
decreased by 26% and 14% from 3Q22 and 2Q23, respectively. In both periods, the decrease was mainly driven by lower raw materials costs,
which was positively affected by lower zinc LME prices.
In 3Q23, conversion cost increased to
US$0.26/lb, compared to US$0.19/lb in 3Q22, mainly explained by higher unitary variable costs (including energy) and inflation, which
impacted on fixed costs. Compared to 2Q23, conversion cost was down by US$0.04/lb.
Cash cost net of by-products in 3Q23 decreased
to US$0.97/lb compared to US$1.37/lb in 3Q22 and US$1.18/lb in 2Q23. In both periods, the decrease was mainly explained by market-related
factors, such as lower LME zinc price, which impacted the concentrate purchased price.
CAPEX
| | 30 |
Earnings Release – 3Q23 | |
In 3Q23, sustaining capital expenditures
amounted to US$3.5 million, mainly due to the acquisition and repairs of equipment, as well as disbursements related to tailings dam,
totaling US$11.1 million in 9M23.
Juiz de Fora
Juiz de Fora
(100% basis) |
|
3Q23 |
2Q23 |
1Q23 |
9M23 |
4Q22 |
3Q22 |
2Q22 |
1Q22 |
9M22 |
| |
|
|
|
|
|
|
|
|
|
|
| Zinc metal production |
kt |
20.3 |
20.7 |
18.7 |
59.7 |
21.9 |
22.2 |
20.7 |
19.4 |
62.3 |
| Zinc metal sales |
kt |
19.4 |
20.3 |
20.2 |
59.9 |
21.7 |
22.3 |
20.5 |
19.2 |
62.0 |
| |
|
|
|
|
|
|
|
|
|
|
| Zinc content in products |
kt |
19.2 |
20.2 |
20.0 |
59.5 |
21.6 |
22.1 |
20.3 |
19.0 |
61.5 |
| |
|
|
|
|
|
|
|
|
|
|
| Cost of sales |
US$ mm |
66 |
67 |
71 |
203 |
79 |
88 |
83 |
75 |
247 |
| (-) Raw material |
|
(36) |
(47) |
(43) |
(126) |
(57) |
(61) |
(66) |
(50) |
(176) |
| (+) By-product |
|
(0.1) |
(0.4) |
(1.0) |
(1.5) |
(1.4) |
(0.6) |
(1.1) |
(1.0) |
(2.8) |
| (+/-) Consolidation effects |
2.0 |
5.1 |
1.2 |
8.3 |
2.5 |
0.3 |
2.4 |
(1.8) |
0.9 |
| (+) Others |
|
(9.9) |
(4.2) |
(4.4) |
(18.5) |
(6.4) |
(9.3) |
(0.4) |
(7.7) |
(17.3) |
| (=) Conversion cost |
US$ mm |
21.5 |
20.4 |
24.0 |
65.8 |
16.0 |
18.2 |
17.8 |
15.0 |
51.1 |
| Conversion cost |
US$/lb |
0.51 |
0.46 |
0.54 |
0.50 |
0.34 |
0.37 |
0.40 |
0.36 |
0.38 |
| |
|
|
|
|
|
|
|
|
|
|
| Cash cost (1) |
US$/lb |
1.27 |
1.24 |
1.35 |
1.29 |
1.35 |
1.45 |
1.50 |
1.35 |
1.44 |
| Sustaining cash cost (1) |
US$/lb |
1.39 |
1.30 |
1.40 |
1.36 |
1.47 |
1.59 |
1.65 |
1.44 |
1.56 |
| |
|
|
|
|
|
|
|
|
|
|
| CAPEX |
US$ mm |
|
|
|
|
|
|
|
|
|
| |
|
|
|
|
|
|
|
|
|
|
| Sustaining |
|
4.5 |
2.5 |
1.5 |
8.6 |
3.7 |
5.4 |
5.2 |
2.0 |
12.6 |
| Other |
|
0.3 |
0.4 |
0.8 |
1.5 |
1.8 |
1.1 |
1.6 |
1.6 |
4.3 |
(1) Our cash cost and sustaining cash cost
are net of by-products credits, measured with respect to zinc sold per smelter. For a cash cost reconciliation to COGS, please refer to
Appendix - Conversion and All in Sustaining Cash Cost | Smelting.
In 3Q23, Juiz de Fora production reached
20kt, down 9% year-over-year and 2% quarter-over-quarter, primarily explained by a scheduled roaster maintenance in the period that took
approximately 12 days.
Recoveries rates averaged 93.8% during
the quarter, compared to 93.6% in 3Q22 and 94.0% in 2Q23. Zinc metal sales totaled 19kt in 3Q23, down 13% and 5% compared to 3Q22 and
2Q23, respectively, primarily explained by lower production volumes, in addition to lower demand in some markets compared to the previous
quarter.
In the first nine months of 2023, zinc
metal production decreased by 4% to 60kt, and sales of 60kt were 3% lower compared to 9M22.
Costs
Cost of sales was US$66 million in 3Q23
compared to US$88 million in the same period last year primarily driven by lower raw materials cost, which was positively affected by
lower zinc LME prices. Compared to 2Q23, cost of sales decreased by 1%.
In 3Q23, conversion cost was US$0.51/lb
compared to US$0.37/lb in 3Q22 and US$0.46 in 2Q23. In both periods, the increase was mainly explained by higher maintenance costs, inflation,
other variable unitary costs, and lower metal sales.
| | 31 |
Earnings Release – 3Q23 | |
Cash cost net of by-products in 3Q23 was
US$1.27/lb compared to US$1.45/lb in 3Q22. This decrease was due to lower LME zinc price, which impacted the concentrate purchase price.
Compared to 2Q23, cash cost net of by-products increased by 3% due to higher maintenance costs.
CAPEX
In 3Q23, sustaining capital expenditures
amounted to US$4.5 million, mainly driven by the replacement and repairs of equipment, as well as disbursements related to the scheduled
roaster maintenance, totaling US$8.6 million in 9M23.
Financial performance
| US$ million |
|
3Q23 |
2Q23 |
3Q22 |
3Q23 vs. 3Q22 |
9M23 |
9M22 |
9M23 vs. 9M22 |
| Net Revenues |
|
484.2 |
465.1 |
615.5 |
(21.3%) |
1,492.6 |
1,860.6 |
(19.8%) |
| Cost of Sales |
|
(438.9) |
(415.1) |
(578.6) |
(24.2%) |
(1,322.5) |
(1,648.0) |
(19.7%) |
| Gross Profit |
|
45.3 |
50.0 |
36.9 |
22.8% |
170.1 |
212.6 |
(20.0%) |
| Adjusted EBITDA |
|
48.7 |
50.6 |
58.3 |
(16.5%) |
188.5 |
280.5 |
(32.8%) |
| Adjusted EBITDA Mrg. |
|
10.1% |
10.9% |
9.5% |
0.6pp |
12.6% |
15.1% |
(2.4pp) |
Note: Financial performance pre intersegment
eliminations.
Net revenues were US$484 million
in 3Q23, down by 21% compared to US$616 million in 3Q22, mainly due to lower metal prices and volumes. Compared to 2Q23, net revenues
increased by 4% due to higher volumes, which was partially offset by lower zinc metal prices.
In 9M23, net revenues amounted to US$1,493
million, 20% lower compared to the same period a year ago, primarily explained by lower zinc metal prices.
Cost of sales decreased by 24%
in 3Q23, totaling US$439 million compared to US$579 million in 3Q22. Compared to 2Q23, cost of sales increased by 6%, mainly benefitting
from lower zinc metal prices, positively impacting cost of concentrates purchased, and higher TCs.
Reconciliation of realized prices
Purchases of zinc in concentrate are recorded
at provisional prices and, typically, an adjustment is made after delivery, which is based on the pricing terms provided for under the
respective contract. In addition, the difference between the provisional and the final price received is recognized by adjusting the price
in the period in which the purchase is concluded.
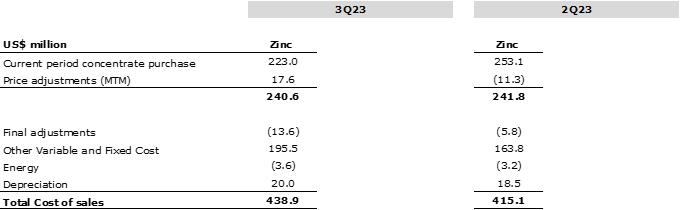
| | 32 |
Earnings Release – 3Q23 | |
Sources
of Zinc Concentrate to Nexa Smelters (kt) – 3Q23
| In 3Q23, Nexa acquired 52% of zinc concentrate
from our own mines, with the remainder supplied by third parties. The smelters use zinc concentrate as feedstock, which is supplied from
our mines, and we apply a benchmark TC for our operations. From third-party suppliers, the treatment charge is based on the benchmark
TC, spot TCs, or TCs negotiated annually, which remained relatively flat throughout the year. |
|
 |
The 2023 benchmark TC, negotiated in April
2023, was US$274/t concentrate, up 19% from 2022 (US$230/t). In order to reduce volatility, for the majority of our third-party contracts,
which are renewed during different periods throughout the year, we consider the 3-year benchmark TC. The reference benchmark for TC 2023,
2022 and 2021 is US$274/t concentrate, US$230/t concentrate, and US$159/t concentrate, respectively.
Adjusted EBITDA for the smelting
segment totaled US$49 million in 3Q23 compared to US$58 million reported in 3Q22. This decrease was mainly explained by (i) the negative
net price effect of US$10 million, mainly due to lower LME metal prices, partially offset by the positive effect of variation in MTM (“mark-to-market”)
of inventories; (ii) lower by-products contribution of US$8 million, primarily related to lower payable value of sulphuric acid; (iii)
the negative impact of US$6 million related to the accounting effect regarding Enercan’s deconsolidation; and (iv) the negative
hedge variation of US$4 million, which were partially offset by (v) higher TCs of US$17 million.
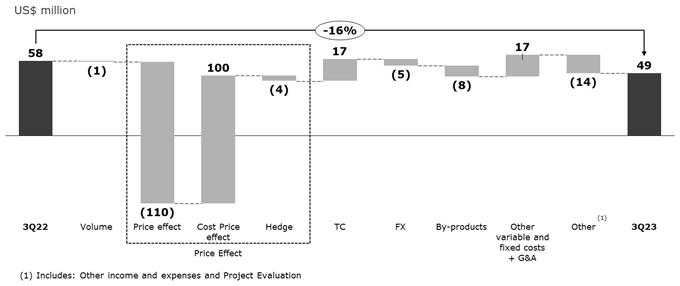
Compared to 2Q23, Adjusted EBITDA decreased
by 4%, mainly driven by (i) the negative hedge variation of US$19 million; (ii) lower by-products contribution of US$2 million due to
lower copper cement sales; and (iii) the negative net price effect of US$1 million due to lower LME metal prices, partially offset by
the positive effect of variation in MTM (“mark-to-market”), which were partially offset by (iv) the positive impact of US$13
million, mainly related to a better raw material mix in Brazil, lower freight and sales expenses in Cajamarquilla; and (v) higher TCs
of US$5 million and higher sales volume.
| | 33 |
Earnings Release – 3Q23 | |
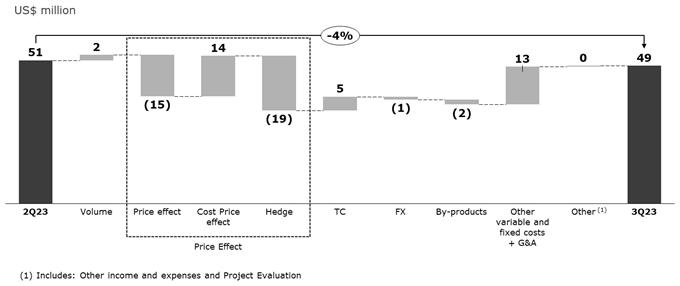
Conversion cost, Cash cost and
AISC 9
| Consolidated |
|
3Q23 |
2Q23 |
3Q22 |
3Q23 vs. 3Q22 |
9M23 |
9M22 |
9M23 vs. 9M22 |
| Smelting conversion cost |
US$/t |
649 |
712 |
570 |
14.0% |
678 |
587 |
15.6% |
| Cash cost net of by-products |
US$/t |
2,224 |
2,474 |
3,007 |
(26.0%) |
2,481 |
3,065 |
(19.1%) |
| AISC net of by-products |
US$/t |
2,410 |
2,721 |
3,230 |
(25.4%) |
2,678 |
3,298 |
(18.8%) |
| Smelting conversion cost |
US$/lb |
0.29 |
0.32 |
0.26 |
14.0% |
0.31 |
0.27 |
15.6% |
| Cash cost net of by-products |
US$/lb |
1.01 |
1.12 |
1.36 |
(26.0%) |
1.13 |
1.39 |
(19.1%) |
| AISC net of by-products |
US$/lb |
1.09 |
1.23 |
1.47 |
(25.4%) |
1.21 |
1.50 |
(18.8%) |
Note: Cash cost and AISC per ton sold does
not include the impact of the cost of idleness capacity of US$2.3 million in Três Marias in 9M22.
Cash cost net of by-products
for the smelting segment decreased to US$1.01/lb in 3Q23 compared to US$1.36/lb in 3Q22. This decrease was driven by lower cost of raw
material, explained by lower LME zinc prices, with an impact of US$0.37/lb which was partially offset by lower by-products contribution
of US$0.04/lb.
Compared to 2Q23, cash cost decreased
by US$0.11/lb, also driven by lower LME zinc prices, with an impact of US$0.07/lb and lower operating costs, with an impact of US$0.03/lb.
AISC net of by-products in 3Q23 was US$1.09/lb,
down 25% and 11% from US$1.47/lb in 3Q22 and US$1.23/lb in 2Q23, respectively.
Conversion cost for the smelting
segment in 3Q23 was US$0.29/lb, up US$0.04/lb from 3Q22, explained by higher maintenance personnel costs and energy expenses impacted
by inflation in the period. Compared to 2Q23, conversion cost was down US$0.03/lb.
For a reconciliation of conversion cost,
cash cost and AISC, please refer to the appendix section “Conversion and All in Sustaining Cash Cost | Smelting”.
[1] Our
conversion cost, cash cost and AISC net of by-products credits are measured with respect to zinc sold.
| | 34 |
Earnings Release – 3Q23 | |
Liquidity and
Indebtedness
On September
30, 2023, Nexa’s consolidated gross debt[10]
amounted to US$1,662 million, 1% lower compared to the balance at June 30, 2023, mainly driven by the
7% depreciation of the Brazilian real (end of period) against the U.S. dollar.
At the end of the period, 84% (or US$1,394
million) of the gross debt was denominated in U.S. dollars and 16% (or US$268 million) in Brazilian reais. The following charts show Nexa’s
gross debt by category and currency.
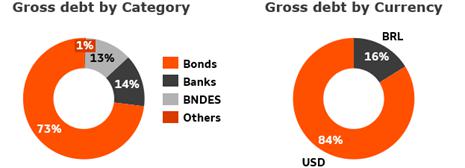
Cash and cash equivalents and financial
investments (“total cash”) amounted to US$422 million on September 30, 2023, relatively flat compared to June 30, 2023, mainly
due to positive operating cash flows in the quarter, which was offset by net sales of financial investments.
Total cash at the end of 3Q23 is sufficient
to cover the payment of all obligations maturing over the next 4 years. The Company also had an undrawn revolving credit facility of US$300
million which was recently replaced by a 5-year US$320 million sustainability-linked revolving credit facility, effective on October 20,
2023, and which remains undrawn. The average maturity of the total debt was 3.9 years at an average interest rate of 5.56% per year. Only
1% (US$24 million) of the total debt matures in 2023, 13% (US$217 million) matures between 2024 and 2026, while 85% (US$1,421 million)
of the total debt matures in and after 2027.
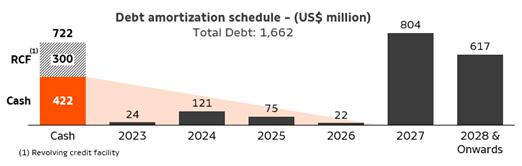
On
September 30, 2023, Nexa’s net debt[11]
was US$1,242 million compared with US$1,262 million at the end of 2Q23. As of September
30, 2023, Nexa was in compliance with all of its financial covenants.
| US$ million |
Sep 30, 2023 |
Jun 30, 2023 |
| Net debt |
1,242.4 |
1,262.2 |
| LTM Adj. EBITDA |
406.4 |
445.7 |
| Net debt/LTM Adj. EBITDA |
3.06x |
2.83x |
In addition to continuing to assess short-term
and mid-term commodities prices, management continues to review Nexa’s capital structure, financial position and the maturity profile
of our debt.
10
Loans and financings (“gross debt”)
11 Gross debt (US$1,662 million) minus
cash and cash equivalents (US$414 million), minus financial investments (US$8 million), plus negative derivatives (US$3.4 million), plus
Lease Liabilities (US$6 million). It does not include the financial instrument related to the offtake agreement.
| | 35 |
Earnings Release – 3Q23 | |
Cash flows
| US$ million |
3Q23 |
9M23 |
| Cash provided by operating activities before working capital |
40.1 |
196.9 |
| Variations in operating assets and liabilities ("Working Capital") |
94.9 |
73.7 |
| Net cash flows provided by (used in): |
|
|
| Operating activities |
97.2 |
136.2 |
| Investing activities |
(59.8) |
(165.0) |
| Financing activities |
(21.1) |
(60.9) |
| Increase (decrease) in cash and cash eq. |
13.6 |
(83.5) |
| Cash and cash eq. at the beginning of the period |
400.7 |
497.8 |
| Cash and cash eq. at the end of the period (1) |
414.3 |
414.3 |
(1) Does not include financial investments
totaling US$8 million at September 30, 2023.
Note: For details on Cash flows, please refer
to the “Condensed consolidated interim financial statements (unaudited) at and for the three and nine-month periods ended on September
30, 2023”.
In 3Q23, the cash provided by operating
activities before working capital variations was US$40 million. Working capital variations had a positive impact of US$95 million, primarily
due to (i) the reduction in inventories of US$55 million; (ii) the increase in trade payables of US$49 million; (iii) the increase in
other liabilities of US$21 million, related to tax liabilities, and salaries and payroll charges; and (iv) the increase in confirming
payables of US$20 million, partially offset by (v) the increase in trade accounts receivables of US$24 million; and (vi) the increase
in other assets of US$26 million, mainly related to dividends received from Enercan and the decrease in tax credits. In 3Q23, we paid
US$29 million in interest and US$8 million in taxes. Consequently, net cash from operating activities was US$97 million.
We used US$60 million of net cash flows
for investing activities in 3Q23, impacted primarily by US$84 million of CAPEX, partially offset by net sales of financial investments
of US$15 million and dividends received of US$9 million from Enercan.
We used US$21 million in cash for financing
activities due to contractual dividends paid to non-controlling interests (Pollarix) of US$13 million, payments of loans and financings,
and lease liabilities of US$8 million.
Foreign exchange effects on cash and cash
equivalents had a negative impact of US$3 million in the quarter, totaling US$6 million in 9M23.
As a result, cash and cash equivalents
excluding financial investments, increased by US$14 million to US$414 million at the end of 3Q23.
| | 36 |
Earnings Release – 3Q23 | |
Others
Offtake agreement
As previously disclosed, Nexa signed an
offtake agreement with a third-party international player (“Offtaker”), in which it agreed to sell 100% of the copper concentrate
produced by Aripuanã for a 5-year period starting in October 2022 and limited to 30,810 tons, at the lower of current market prices
or a price cap.
The offtake agreement was structured to
completely extinguish a previous existing future royalty obligation that the Company had with the Offtaker. The accounting for the offtake
agreement resulted in the Company recording a non-cash gain of US$1 million in 3Q23 excluded from the reported Adjusted EBITDA, totaling
a non-cash gain of US$8 million in 9M23.
For further information, please refer
to explanatory note 10 (e) – “Financial instruments in offtake agreement: fair value” in the “Condensed consolidated
interim financial statements (unaudited) at and for the three and nine-month periods ended on September 30, 2023”.
Legal Matters
As previously reported, Nexa is continuing
to cooperate with the investigation being carried out by the Fiscal Office of the State of Minas Gerais and the Public Ministry of Minas
Gerais (the “MG Authorities”) of the practices of certain of Nexa’s former customers with respect to commercial transactions
and related value added tax (“VAT”), as well as Nexa’s relationship with such former customers, that could result in
liabilities for all parties involved in the commercial relationship.
In the third quarter of 2023, Nexa and
the MG Authorities reached a resolution (the “Tax Resolution”) whereby Nexa, without admitting primary responsibility for
the resolved claims, agreed to make certain tax payments to the State of Minas Gerais on behalf of certain customers that allegedly failed
to properly make their tax payments (“tax portion”), and subsequently on October 20, 2023 entered into a related additional
agreement (the “Related Agreement”, and together with the Tax Resolution, the “Agreements”) to make a contribution
to the State of Minas Gerais to support its ESG-related efforts (“ESG portion”).
On September 29, 2023, Nexa paid US$1.5
million in cash as the initial installment under the Tax Resolution and used existing VAT tax credits of approximately US$25.0 million
to offset part of the tax portion of the Tax Resolution. The remaining tax portion of US$28.8 million, and the remaining ESG portion of
US$20.6 million, under the Agreements, will be paid in 35 and 46 monthly installments respectively, and will be updated by interest rate
SELIC (the Brazilian federal funds rate).
In addition to the Agreements, there are certain other tax-related
ongoing investigations that may result in additional liabilities for Nexa, for which the Company recorded a provision in this quarter
in the amount of approximately US$10.5 million, and for which the Company also expects to use accumulated tax credits as partial consideration
in any potential further resolution. Notwithstanding the final resolution reached in the Agreements, it is possible that the conclusion
of certain, remaining matters involving tax payments and interest may have a material impact on the Company’s business, results
of operations and financial condition. Nexa reserves the legal right to recover from certain customers the amounts that it has paid, or
will pay, on their behalf in connection with the tax portion of the Agreements.
| | 37 |
Earnings Release – 3Q23 | |
Market Scenario
3Q23
| LME Prices |
|
3Q23 |
2Q23 |
3Q22 |
3Q23 vs. 3Q22 |
9M23 |
9M22 |
9M23 vs. 9M22 |
| |
|
|
|
|
|
|
|
|
| |
|
|
|
|
|
|
|
|
| Zinc |
US$/t |
2,428 |
2,526 |
3,271 |
(25.8%) |
2,696 |
3,638 |
(25.9%) |
| Copper |
US$/t |
8,356 |
8,464 |
7,745 |
7.9% |
8,585 |
9,064 |
(5.3%) |
| Lead |
US$/t |
2,170 |
2,117 |
1,976 |
9.8% |
2,143 |
2,168 |
(1.1%) |
| Silver |
US$/oz |
23.57 |
24.13 |
19.23 |
22.6% |
23.40 |
21.92 |
6.8% |
| Gold |
US$/oz |
1,928 |
1,976 |
1,729 |
11.5% |
1,930 |
1,824 |
5.8% |
Source: Bloomberg
In 3Q23, the LME zinc price averaged US$2,428/t
(or US$1.10/lb), down 26% and 4% compared to 3Q22 and 2Q23, respectively. Zinc traded between US$2,261.00/t to US$2,640.50/t in 3Q23.
The LME copper price averaged US$8,356/t (US$3.79/lb), up 8% and down 1% compared to 3Q22 and 2Q23, respectively.
With respect to zinc, the price drop was
mainly affected by the speculation in relation to the global economy, such as potential new hikes in interest
rates in the U.S., slowing economic growth worldwide, and a Chinese economy that has not responded to economic stimulus as expected, particularly
the property sector. During this same period a year ago, expectations of potential economic recovery in China and of a potential easing
on U.S. interest rates positively impacted prices. Neither expectation has been realized to date, resulting significant differences in
the year-over-year zinc price comparison. Compared to 2Q23, prices were slightly lower as the expectations for China’s economic
recovery disappointed and had an additional negative effect on prices during 3Q23. Additionally, globally, three zinc mines were placed
on care and maintenance this quarter (Jaguar in Australia, Islay in Peru, and Aljustrel in Portugal). This, combined with an apparently
stable metal demand, kept zinc prices slightly lower and relatively stable.
Copper prices, year-over-year, followed
the same trend as zinc prices, and were impacted by an appreciation of the U.S. dollar and disappointing China’s economic reports.
However, quarter-over-quarter, copper demand from sectors related to the energy transition, as solar power and EVs remained strong, positively
impacting copper prices, and contributing to a slight quarter-over-quarter increase.
Looking ahead to the rest of 2023, metal
prices are still expected to be negatively impacted by monetary policy in Europe and the U.S., as well as the still-present uncertainty
about the Chinese economy. The escalation of tension in the Middle East also poses a risk, given the potential duration of the conflict,
which could put upside pressure on oil prices, and strengthen the U.S. dollar, a safe haven in times of uncertainty. Both these factors
could put downward pressure on base metal prices. In the mid and long-terms, the fundamental outlook for both zinc and copper prices remains
positive. Investments in construction, infrastructure, automotive sector (driven by EV sales) and electrification in general, with attention
to renewable sources, will continue to have a positive impact on future expectations for demand for base metals.
With respect to our home markets (Latin
America excluding Mexico), overall demand fell 4% year-over-year, mainly impacted by the slowdown in the civil construction and infrastructure
sectors, as well as the automotive sector. Compared to 2Q23, we noted a growth of 5%, mainly due to the recovery of the Brazilian market,
which was partially offset by lower consumption in other countries in the region. Given the current pace and outlook for 4Q23, zinc demand
in Latin America is expected to be slightly lower in 2023 versus 2022. If the Brazilian monetary policy easing continues, we should see improvements in activities in the civil
construction and light vehicles sectors in 2024, which could contribute positively to demand in Latin America.
| | 38 |
Earnings Release – 3Q23 | |
Foreign Exchange
| FX |
|
3Q23 |
2Q23 |
3Q22 |
3Q23 vs. 3Q22 |
9M23 |
9M22 |
9M23 vs. 9M22 |
| BRL/USD (Average) |
4.880 |
4.948 |
5.246 |
(7.0%) |
5.008 |
5.136 |
(2.5%) |
| BRL/USD (End of period) |
5.007 |
4.819 |
5.406 |
(7.4%) |
5.007 |
5.406 |
(7.4%) |
| PEN/USD (Average) |
3.678 |
3.697 |
3.892 |
(5.5%) |
3.732 |
3.815 |
(2.2%) |
| PEN/USD (End of period) |
3.785 |
3.625 |
3.983 |
(5.0%) |
3.785 |
3.983 |
(5.0%) |
Source: Bloomberg
The U.S. dollar outperformed most major
currencies in 3Q23. Financial markets are now focused on stabilizing interest rates in the U.S. and are already beginning to debate whether
the FED rate will be reduced in 2024.
The average exchange rate for the Brazilian
real in 3Q23 was 4.880/US$, down 1% from 4.948/US$ in 2Q23 and down 7% from 5.246/US$ in 3Q22. The Real appreciated due to the growth
of Brazilian GDP, which was better-than-expected so far. Furthermore, the Central Bank of Brazil maintained its conservative view on monetary
policy, which also contributed to the strengthening of the Real. At the end of September, the Real/US$ exchange rate was 5.007.
The average exchange rate for the Peruvian
soles in 3Q23 averaged 3.678/US$, down 0.5% compared to 2Q23 and down 6% compared to 3Q22. At the end of September, the Peruvian soles/US$
exchange rate was 3.785.
| | 39 |
Earnings Release – 3Q23 | |
Risks and Uncertainties
Risk management is one of the key points
in our business strategy and contributes to value creation and increasing the level of confidence in the Company held by its main stakeholders,
including shareholders, employees, customers, suppliers and the local communities.
As a result, we have adopted an Enterprise
Risk Management (“ERM”) Policy that describes Nexa’s Risk Management Model. The ERM forms an integral part of the processes
in our operational units, corporate departments and projects, and provides support for decision-making by our Executive Officers and Board
of Directors.
The risk assessment cycle is performed
annually focusing on our strategy, operations and key projects. We seek to identify material risks, which are then assessed with consideration
of the potential health, safety, environmental, social, reputational, legal and financial impacts. By embedding risk management into our
work processes and critical business systems, we work to ensure we make decisions based on relevant inputs and valid data. The material
risks identified during the risk management process are monitored and reported to the Executive Team, Audit Committee and Board of Directors.
Our operations are exposed to a number
of inherent risks and uncertainties, and our results may be influenced by the following factors, including, among others:
| · | the cyclical and volatile prices of commodities; |
| · | the changes in the expected level of supply and demand for commodities; |
| · | foreign exchange rates and inflation; |
| · | the risks and uncertainties relating to economic and political conditions in the countries in which we
operate; |
| · | changes in global market conditions; |
| · | the impact of expanded regional or global conflict, including the conflict between Russia and Ukraine,
as well as Israel-Hamas conflict, and the resulting potential impacts on supply and demand for commodities, global security concerns,
and market volatility; |
| · | outbreaks of contagious diseases or health crises impacting overall economic activity regionally or globally,
including the COVID-19 pandemic, and the potential impact thereof on commodity prices, our business and operating sites, and the global
economy; |
| · | increasing demand and evolving expectations from stakeholders with respect to our environmental, social
and governance (“ESG”) practices, performance and disclosures, including the ability to meet energy requirements while complying
with greenhouse gas emissions regulations and other energy transition policy changes and laws in the countries in which we operate; |
| · | the impact of climate change on our operations, workforce and value chain; |
| · | environmental, safety and engineering challenges and risks inherent to mining; |
| · | the ability to meet energy requirements while complying with greenhouse gas emissions regulations and
other energy transition policy changes and laws in the countries in which we operate; |
| · | severe natural disasters, such as storms and earthquakes, disrupting our operations; |
| · | operational risks, such as operator errors, mechanical failures and other accidents; |
| · | the availability of materials, supplies, insurance coverage, equipment, required permits or approvals
and financing; |
| | 40 |
Earnings Release – 3Q23 | |
| · | supply-chain and logistic related interruptions, including impacts to international freight and transportation
networks; |
| · | the implementation of our growth strategy and risks associated with related capital expenditures; |
| · | failure to obtain financial assurance to meet closure and remediation obligations; |
| · | the possible material differences between our estimates of mineral reserves and mineral resources and
the mineral quantities we actually recover; |
| · | the possibility that our concessions may be terminated or not renewed by governmental authorities in the
countries in which we operate; |
| · | the impact of political and government changes in the countries in which we operate, and the effects of
potential new legislation and changes in taxation; |
| · | legal and regulatory risks, including ongoing or future investigations by local authorities with respect
to our business and operations, as well as the conduct of our customers, as well as the impact to our financial statements regarding the
resolution of any such matters; |
| · | labor disputes or disagreements with local communities in the countries in which we operate; |
| · | loss of reputation due to unanticipated operational failures or significant occupational incidents; |
| · | failure or outage of our digital infrastructure or information and operating technology systems; |
| · | cyber events or attacks (including ransomware, state-sponsored and other cyberattacks) due to negligence
or IT security failures; |
| · | the future impact of competition and changes in domestic and international governmental and regulatory
policies that apply to our operations; |
| · | currency exchange rate and interest rate fluctuations; and |
For a broader discussion of risks please
refer to our annual report on form 20-F filed with the SEC (www.sec.gov), on SEDAR+ (www.sedarplus.com)
and available on the Company’s website (ir.nexaresources.com).
Use of Non-IFRS
Financial Measures
Nexa’s management uses Consolidated
Adjusted EBITDA as an additional performance measure on a consolidated basis, in addition to, and not as a substitute for, net income.
We believe this measure provides useful information about the performance of our operations as it facilitates consistent comparisons between
periods, planning and forecasting of future operating results reflecting the operational performance of our existing business without
the impact of interest, taxes, amortization, depreciation, non-cash items that do not reflect our operational performance for the specific
reporting period and the impact of pre-operating and ramp-up expenses during the commissioning and ramp-up phases of greenfield projects
(currently, only Aripuanã has reached these stages). Pre-operating and ramp-up expenses incurred during the commissioning and ramp-up
of phases of Aripuanã are not considered infrequent, unusual or non-recurring expenses, as they have recurred in prior years with
respect to Aripuanã and may recur in the future with respect to Aripuanã or any other projects that may reach the commissioning
or ramp-up phases. Our management believes this adjustment is helpful because it shows our performance without the impact of specific
expenses relating to a greenfield project that has reached the commissioning or ramp-up phases, with no connection with the performance
of our other existing operations.
When applicable, Adjusted EBITDA also
excludes the impact of (i) events that are non-recurring, unusual or infrequent, and (ii) other specific events that, by their nature
and scope, do not reflect our operational performance for the specific period in our management’s view. These events did not impact
our Adjusted EBITDA in 2022 and 2021 but may impact future periods.
| | 41 |
Earnings Release – 3Q23 | |
In addition, management may adjust the
effect of certain types of transactions that in management’s judgment are not indicative of the Company´s normal operating
activities, or do not necessarily occur on a regular basis.
In this report, we present Consolidated
Adjusted EBITDA, which we define as net income (loss) for the year, adjusted by (i) share in the results of associates, depreciation and
amortization, net financial results and income tax; (ii) non-cash events and non-cash gains or losses that do not specifically reflect
our operational performance for the specific period (including: (loss) gain on sale of investments; impairment and impairment reversals;
(loss) gain on sale of long-lived assets; write-offs of long-lived assets; and remeasurement in estimates of asset retirement obligations);
and (iii) pre-operating and ramp-up expenses incurred during the commissioning and ramp-up phases of greenfield projects (currently, Aripuanã).
Our calculation of Adjusted EBITDA may
be different from the calculation used by other companies, including our competitors in the mining industry, so our measures may not be
comparable to those of other companies.
Mining segment | Cash cost net of by-products
credits: for our mining operations, cash cost after by-products credits includes all direct costs associated with mining, concentrating,
leaching, solvent extraction, on-site administration and general expenses, any off-site services essential to the operation, concentrate
freight costs, marketing costs and property and severance taxes paid to state or federal agencies that are not profit-related. Treatment
and refining charges on metal sales, which are typically recognized as a deduction component of sales revenues, are added to cash cost.
Cash cost net of by-products credits is measured with respect to zinc sold per mine.
Mining segment | Cost ROM: includes all
direct production costs for mining, concentrating, leaching, on-site mineral transportation, and other on-site administration expenses,
excluding royalties and workers’ participation costs. Cost ROM is measured with respect to total treated ore volume and non-metallic
products revenue (such as limestone and stones) are considered as cost-reduction for our mining operations.
Smelting segment | Cash cost net of by-products
credits: for our smelting operations, cash cost, after by-products credits includes all the costs of smelting, including costs associated
with labor, net energy, maintenance, materials, consumables and other on-site costs, as well as raw material costs. Cash cost net of by-products
credits is measured with respect to zinc sold per smelter.
Smelting segment | Conversion cost: costs
incurred to convert zinc concentrate (feed) into final products measured with respect to contained zinc sold per smelter, including energy,
consumables, and other fixed and on-site expenses. Conversion cost does not include raw material, alloys, and by-products related cost.
Sustaining cost net of by-products credits
is defined as the cash cost, net of by-product credits plus non-expansion capital expenditure, including sustaining, health, safety and
environment, modernization and other non-expansion-related capital expenditures. Sustaining cash cost net of by-products credits is measured
with respect to zinc sold.
All in sustaining cost (“AISC”)
net of by-products credits is defined as sustaining cash cost, net of by-products credits plus corporate general and administrative expenses,
royalties and workers’ participation. AISC net of by-products credits is measured with respect to zinc sold.
Net debt: defined as (i) loans and financing
(the most comparable IFRS measure), less (ii) cash and cash equivalents, less (iii) financial investments, plus or less (iv) the fair
value of derivative financial instruments, plus (v) leases liabilities. Our management believes that net debt is an important figure because
it indicates our ability to repay outstanding debts that become due simultaneously using available cash and highly liquid assets.
All forward-looking non-IFRS financial
measures in this release, including cash cost guidance, are provided only on a non-IFRS basis. This is due to the inherent difficulty
of forecasting the timing or amount of items that would be included in the most directly comparable forward-looking IFRS financial measures.
As a result, reconciliation of the forward-looking non-IFRS financial measures to IFRS financial measures is not available without unreasonable
effort and the Company is unable to assess the probable significance of the unavailable information.
See “Cautionary Statement on Forward-Looking
Statements” below.
Technical information
Jose Antonio Lopes, MausIMM (Geo): 224829,
a mineral resources manager, a qualified person for purposes of National Instrument 43-101 and a Nexa employee, has approved the scientific
and technical information contained in this Earnings Release. Please note that the mineral reserves included in this Earnings Release were
estimated in accordance with the Canadian Institute of Mining, Metallurgy and Petroleum (“CIM”) 2014 Definition Standards
For Mineral Resources and Mineral Reserves, whose definitions are incorporated by reference in National Instrument 43-101. Accordingly,
such information may not be comparable to similar information prepared in accordance with Subpart 1300 of Regulation S-K (“S-K 1300”).
For a discussion of the differences between the requirements under S-K 1300 and NI 43-101, please see our annual report on Form 20-F.
Our estimates of mineral reserves may be materially different from mineral quantities we actually recover, and market price fluctuations
and changes in operating capital costs may render certain mineral reserves uneconomical to mine.
| | 42 |
Earnings Release – 3Q23 | |
CAUTIONARY STATEMENT
ON FORWARD-LOOKING STATEMENTS
This Earnings
Release contains certain forward-looking information and forward-looking statements as defined in applicable securities laws (collectively
referred to in this Earnings Release as “forward-looking statements”). All statements other than statements of historical
fact are forward-looking statements. The words “believe,” “will,” “may,” “may have,” “would,”
“estimate,” “continues,” “anticipates,” “intends,” “plans,” “expects,”
“budget,” “scheduled,” “forecasts” and similar words are intended to identify estimates and forward-looking
statements. Forward-looking statements are not guarantees and involve known and unknown risks, uncertainties and other factors which may
cause the actual results, performance or achievements of NEXA to be materially different from any future results, performance or achievements
expressed or implied by the forward-looking statements. Actual results and developments may be substantially different from the expectations
described in the forward-looking statements for a number of reasons, many of which are not under our control, among them, the activities
of our competition, the future global economic situation, weather conditions, market prices and conditions, exchange rates, and operational
and financial risks. The unexpected occurrence of one or more of the abovementioned events may significantly change the results of our
operations on which we have based our estimates and forward-looking statements. Our estimates and forward-looking statements may also
be influenced by, among others, legal, political, environmental or other risks that could materially affect the potential development
of our projects, including risks related to outbreaks of contagious diseases or health crises impacting overall economic activity regionally
or globally, as well as risks relating to ongoing or future investigations by local authorities with respect to our business and
operations and the conduct of our customers, including the impact to our financial statements regarding the resolution of any such matters.
These forward-looking statements related
to future events or future performance and include current estimates, predictions, forecasts, beliefs and statements as to management’s
expectations with respect to, but not limited to, the business and operations of the Company and mining production our growth strategy,
the impact of applicable laws and regulations, future zinc and other metal prices, smelting sales, CAPEX, expenses related to exploration
and project evaluation, estimation of mineral reserves and mineral resources, mine life and our financial liquidity.
Forward-looking statements are necessarily
based upon a number of factors and assumptions that, while considered reasonable and appropriate by management, are inherently subject
to significant business, economic and competitive uncertainties and contingencies and may prove to be incorrect. Statements concerning
future production costs or volumes are based on numerous assumptions of management regarding operating matters and on assumptions that
demand for products develops as anticipated, that customers and other counterparties perform their contractual obligations, full integration
of mining and smelting operations, that operating and capital plans will not be disrupted by issues such as mechanical failure, unavailability
of parts and supplies, labor disturbances, interruption in transportation or utilities, adverse weather conditions, and other COVID-19
related impacts, and that there are no material unanticipated variations in metal prices, exchange rates, or the cost of energy, supplies
or transportation, among other assumptions.
| | 43 |
Earnings Release – 3Q23 | |
We assume no obligation to update forward-looking
statements except as required under securities laws. Estimates and forward-looking statements refer only to the date when they were made,
and we do not undertake any obligation to update or revise any estimate or forward-looking statement due to new information, future events
or otherwise, except as required by law. Estimates and forward-looking statements involve risks and uncertainties and do not guarantee
future performance, as actual results or developments may be substantially different from the expectations described in the
forward-looking statements. Further information concerning risks and uncertainties associated with these forward-looking statements and
our business can be found in our annual report on Form 20-F and in our other public disclosures available on our website and filed under
our profile on SEDAR+ (www.sedarplus.com) and on EDGAR (www.sec.gov).
| | 44 |
Earnings Release – 3Q23 | |
Appendix
| Income Statement |
46 |
Net cash flows from operating activities excluding working capital variations
and free cash flow - Reconciliation |
47 |
| CAPEX |
48 |
| All in Sustaining Cash Cost | Mining |
49 |
| Conversion and All in Sustaining Cash Cost | Smelting |
53 |
| | 45 |
Earnings Release – 3Q23 | |
Income Statement
| US$ million |
1Q22 |
2Q22 |
3Q22 |
4Q22 |
1Q23 |
2Q23 |
3Q23 |
| Net Revenues |
722.1 |
829.4 |
702.6 |
779.8 |
667.3 |
626.7 |
649.3 |
| Cost of sales |
(524.8) |
(556.3) |
(617.8) |
(696.2) |
(567.8) |
(565.0) |
(582.5) |
| Gross Profit |
197.4 |
273.1 |
84.8 |
83.6 |
99.5 |
61.7 |
66.8 |
| SG&A |
(36.0) |
(37.1) |
(31.6) |
(40.8) |
(28.5) |
(32.6) |
(33.1) |
| Mineral Exploration and Project Evaluation |
(17.2) |
(26.8) |
(27.4) |
(27.4) |
(22.0) |
(21.3) |
(29.6) |
| Impairment of long-lived assets |
- |
- |
- |
(32.5) |
- |
(57.2) |
(1.9) |
| Other income and expenses, net |
(20.9) |
30.4 |
12.8 |
(25.0) |
(5.5) |
(66.1) |
(7.2) |
| Operating income (loss) |
123.2 |
239.6 |
38.6 |
(42.1) |
43.5 |
(115.5) |
(5.0) |
| Share in the results of associates |
- |
- |
- |
1.9 |
5.4 |
5.7 |
6.3 |
| Net Financial Results |
10.7 |
(74.2) |
(52.3) |
(17.9) |
(39.2) |
(26.5) |
(64.4) |
| Financial income |
3.7 |
8.4 |
6.7 |
6.2 |
5.6 |
6.7 |
8.4 |
| Financial expenses |
(43.4) |
(40.3) |
(41.6) |
(43.4) |
(46.4) |
(59.4) |
(45.3) |
| Other financial items, net |
50.3 |
(42.3) |
(17.4) |
19.4 |
1.6 |
26.1 |
(27.4) |
| Depreciation, amortization and depletion |
(65.9) |
(74.4) |
(72.8) |
(77.9) |
(71.7) |
(71.7) |
(72.1) |
| Adjusted EBITDA |
216.7 |
302.4 |
121.1 |
120.2 |
133.0 |
71.5 |
81.7 |
| Adj. EBITDA margin |
30.0% |
36.5% |
17.2% |
15.4% |
19.9% |
11.4% |
12.6% |
| Income Tax |
(59.6) |
(41.8) |
(26.2) |
(23.3) |
(25.1) |
33.5 |
(0.4) |
| Net Income (loss) |
74.2 |
123.5 |
(39.9) |
(81.4) |
(15.4) |
(102.8) |
(63.4) |
| Attributable to Nexa's shareholders |
63.0 |
109.0 |
(41.2) |
(81.7) |
(19.7) |
(102.5) |
(73.7) |
| Attributable to non-controlling interests |
11.2 |
14.5 |
1.4 |
0.3 |
4.3 |
(0.3) |
10.4 |
| Weighted average number of outstanding shares - in thousand |
132,439 |
132,439 |
132,439 |
132,439 |
132,439 |
132,439 |
132,439 |
| Basic and diluted earnings (loss) per share - (in US$) |
0.48 |
0.82 |
(0.31) |
(0.62) |
(0.15) |
(0.77) |
(0.56) |
| Adjusted Net Income (loss) |
101.9 |
111.9 |
(30.2) |
2.9 |
2.4 |
12.5 |
(48.8) |
| Adjusted Basic and diluted earnings (loss) per share - (in US$) |
0.69 |
0.74 |
(0.24) |
(0.04) |
(0.01) |
0.04 |
(0.43) |
| | 46 |
Earnings Release – 3Q23 | |
Net cash flows
from operating activities excluding working capital variations and free cash flow - Reconciliation
Nexa manages and reports cash flows from
operating activities excluding variations in working capital. Working capital can be volatile due to several factors, including prices
and a build-up or reduction of inventories.
Furthermore, we also exclude from the
analysis interest and income tax payments. Management believes excluding these measures provides investors a better visibility of the
operating cash flow performance and our capital allocation strategy.
The following table provides a reconciliation
of the cash from operating activities before variations in working capital to free cash flow.
| US$ million |
3Q23 |
9M23 |
| |
|
|
| Cash provided by operating activities |
135 |
271 |
| (-) Working capital variations |
95 |
74 |
| Trade accounts receivables |
(24) |
76 |
| Inventory |
55 |
115 |
| Other assets |
(26) |
(58) |
| Payables |
69 |
(49) |
| Other liabilities |
21 |
(11) |
| |
|
|
| Cash flows from operations excluding working capital variations |
40 |
197 |
| |
|
|
| Interest paid |
(29) |
(89) |
| Income tax |
(8) |
(46) |
| Sustaining CAPEX (1) |
(75) |
(197) |
| |
|
|
| Net cash flows from operations excluding working capital variations |
(73) |
(134) |
| |
|
|
| Other investments (2) |
(9) |
(4) |
| Loans and investments (3) |
17 |
13 |
| Dividends and share premium |
(13) |
(38) |
| Foreign exchange effects |
(3) |
6 |
| Working capital variations |
95 |
74 |
| |
|
|
| Free cash flow |
14 |
(84) |
(1) Non expansion investments related to sustaining
and HS&E.
(2) Other non-expansion investments. Refer to
page 8 of this earnings release for CAPEX breakdown.
(3) Loans and financing, bonds repurchase and
net sales of financial investments.
For details on cash flows, please refer to the
“Condensed consolidated interim financial statements (unaudited) at and for the three and nine-month periods ended on September
30, 2023”.
| | 47 |
Earnings Release – 3Q23 | |
CAPEX
| US$ million |
3Q23 |
2Q23 |
1Q23 |
4Q22 |
3Q22 |
2Q22 |
1Q22 |
2022 |
| Mining |
63.1 |
30.4 |
45.4 |
55.6 |
37.1 |
28.2 |
25.2 |
146.1 |
| Cerro Lindo |
11.1 |
10.9 |
8.3 |
14.9 |
9.6 |
10.1 |
7.8 |
42.5 |
| El Porvenir |
16.7 |
9.7 |
13.4 |
16.9 |
9.5 |
5.3 |
5.0 |
36.7 |
| Atacocha |
2.6 |
2.5 |
4.7 |
1.1 |
0.5 |
0.7 |
2.0 |
4.5 |
| Vazante |
8.9 |
9.6 |
6.4 |
20.6 |
16.4 |
9.6 |
9.0 |
55.6 |
| Morro Agudo |
0.8 |
1.1 |
0.2 |
2.1 |
1.0 |
2.4 |
1.3 |
6.8 |
| Aripuanã (1) |
23.0 |
(3.4) |
12.4 |
- |
- |
- |
- |
0.0 |
| Smelting |
15.3 |
14.7 |
10.7 |
30.7 |
30.7 |
33.2 |
15.4 |
109.9 |
| Cajamarquilla |
7.3 |
4.5 |
4.5 |
12.9 |
12.2 |
14.5 |
5.7 |
45.3 |
| Três Marias |
4.6 |
7.3 |
3.9 |
12.2 |
11.9 |
11.9 |
6.0 |
42.1 |
| Juiz de Fora |
4.8 |
2.9 |
2.3 |
5.5 |
6.5 |
6.8 |
3.6 |
22.4 |
| Other |
2.5 |
14.8 |
0.1 |
29.5 |
17.2 |
36.5 |
42.0 |
125.3 |
| Total |
82.4 |
59.9 |
56.2 |
115.8 |
85.0 |
97.9 |
82.5 |
381.2 |
| |
|
|
|
|
|
|
|
|
| Sustaining (US$ million) |
3Q23 |
2Q23 |
1Q23 |
4Q22 |
3Q22 |
2Q22 |
1Q22 |
2022 |
| Mining |
56.3 |
47.3 |
47.7 |
45.8 |
29.3 |
26.1 |
22.8 |
124.1 |
| Cerro Lindo |
9.1 |
9.4 |
8.0 |
12.8 |
8.6 |
9.4 |
7.3 |
38.1 |
| El Porvenir |
16.7 |
9.7 |
13.4 |
16.6 |
9.4 |
5.1 |
4.7 |
35.7 |
| Atacocha |
2.6 |
2.5 |
4.7 |
1.1 |
0.5 |
0.8 |
2.0 |
4.4 |
| Vazante |
7.2 |
8.8 |
6.2 |
13.4 |
9.9 |
8.6 |
7.7 |
39.5 |
| Morro Agudo |
0.8 |
1.0 |
0.2 |
1.9 |
0.9 |
2.3 |
1.1 |
6.3 |
| Aripuanã |
19.9 |
15.9 |
15.2 |
- |
- |
- |
- |
0.0 |
| Smelting |
14.2 |
10.9 |
7.9 |
16.7 |
18.3 |
23.8 |
9.7 |
68.5 |
| Cajamarquilla |
6.2 |
3.2 |
4.0 |
10.2 |
10.0 |
13.1 |
5.2 |
38.5 |
| Três Marias |
3.5 |
5.2 |
2.4 |
2.8 |
2.8 |
5.5 |
2.6 |
13.7 |
| Juiz de Fora |
4.5 |
2.5 |
1.5 |
3.7 |
5.4 |
5.2 |
2.0 |
16.3 |
| Total Operations Sustaining |
70.5 |
58.2 |
55.6 |
62.5 |
47.6 |
49.9 |
32.5 |
192.5 |
| Corporate Sustaining (2) |
0.3 |
0.3 |
0.4 |
17.6 |
11.1 |
11.0 |
7.4 |
47.2 |
| Total Sustaining |
70.8 |
58.5 |
56.0 |
80.1 |
58.7 |
61.0 |
39.9 |
239.7 |
(1) The negative amounts are mainly related
to reclassifications between Aripuanã and Corporate, and capitalization of interest net of advanced payments for imported materials
and tax credits.
(2) Until 4Q22, Aripuanã sustaining expenses
were included in Corporate Sustaining.
| | 48 |
Earnings Release – 3Q23 | |
All in Sustaining
Cash Cost | Mining (1)
3Q23
| |
US$ million
(excepted indicated otherwise) |
Vazante |
Morro Agudo |
Cerro Lindo |
El Porvenir |
Atacocha |
Consolidation of Operations |
Corporate & Others |
Mining |
| |
Sales Volume (Zinc content in Products) |
|
|
|
|
|
|
|
|
| |
Tonnes |
38,360 |
6,004 |
20,833 |
14,533 |
1,146 |
80,876 |
|
80,876 |
| (+) |
COGS |
33.5 |
16.6 |
88.6 |
47.8 |
13.1 |
199.6 |
(0.4) |
199.2 |
| (+) |
On-site G&A |
0.1 |
0.1 |
0.1 |
0.2 |
0.1 |
0.5 |
|
0.5 |
| (-) |
By-products revenue |
(4.1) |
(11.6) |
(85.6) |
(37.7) |
(13.1) |
(152.1) |
6.4 |
(145.7) |
| (+) |
Treatment Charges |
30.2 |
3.8 |
11.2 |
9.4 |
0.7 |
55.4 |
|
55.4 |
| (+) |
Selling Expenses |
0.1 |
0.1 |
0.4 |
0.1 |
0.1 |
0.8 |
|
0.8 |
| (-) |
Depreciation, amortization and depletion |
(6.0) |
(0.5) |
(20.7) |
(9.8) |
(3.5) |
(40.4) |
(0.1) |
(40.5) |
| (-) |
Royalties |
(0.6) |
(0.3) |
0.0 |
(0.3) |
0.0 |
(1.2) |
|
(1.2) |
| (-) |
Workers participation & Bonus |
(0.4) |
(0.2) |
(1.6) |
(1.4) |
(0.1) |
(3.7) |
|
(3.7) |
| (+) |
Others |
0.1 |
0.0 |
(0.5) |
(1.8) |
(0.5) |
(2.7) |
|
(2.7) |
| (=) |
Cash Cost (Sold) |
52.9 |
8.1 |
(8.1) |
6.5 |
(3.1) |
56.3 |
5.9 |
62.2 |
| |
Cash Cost (Sold) (per ton) |
1,379.5 |
1,347.1 |
(390.1) |
450.5 |
(2,690.8) |
696.6 |
0.0 |
769.4 |
| (+) |
Sustaining Capital Expenditure |
8.0 |
0.8 |
11.1 |
16.7 |
2.6 |
39.3 |
19.7 |
59.0 |
| (=) |
Sustaining Cash Cost (Sold) |
61.0 |
8.9 |
3.0 |
23.3 |
(0.5) |
95.6 |
25.6 |
121.3 |
| |
Sustaining Cash Cost (Sold) (per ton) |
1,589.3 |
1,481.8 |
143.5 |
1,601.7 |
(424.3) |
1,182.6 |
0.0 |
1,499.3 |
| (+) |
Workers participation & Bonus |
0.4 |
0.2 |
1.6 |
1.4 |
0.1 |
3.7 |
|
3.7 |
| (+) |
Royalties |
0.6 |
0.3 |
0.0 |
0.3 |
0.0 |
1.2 |
|
1.2 |
| (+) |
Corporate G&A |
|
|
|
|
|
|
12.3 |
12.3 |
| (=) |
AISC (Sold) |
|
|
|
|
|
|
|
138.4 |
| (=) |
AISC (Sold) (per ton) |
|
|
|
|
|
|
|
1,711.6 |
| (=) |
AISC (Sold) in US$/lb |
|
|
|
|
|
|
|
0.78 |
Note: Cash cost and AISC per ton sold does not
include the impact of the cost of idleness capacity of US$1.7 million in Atacocha in 3Q23.
(1) Our cash cost, sustaining cash cost
and AISC are net of by-products credits, measured with respect to zinc sold.
| | 49 |
Earnings Release – 3Q23 | |
3Q22
| |
US$ million
(excepted indicated otherwise) |
Vazante |
Morro Agudo |
Cerro Lindo |
El Porvenir |
Atacocha |
Consolidation of Operations |
Corporate & Others |
Mining |
| |
Sales Volume (Zinc content in Products) |
|
|
|
|
|
|
|
|
| |
Tonnes |
36,420 |
4,595 |
19,707 |
12,376 |
2,278 |
75,376 |
|
75,376 |
| (+) |
COGS |
30.0 |
15.1 |
94.6 |
40.1 |
15.7 |
195.6 |
(2.2) |
193.4 |
| (+) |
On-site G&A |
0.3 |
0.2 |
0.1 |
0.2 |
0.1 |
0.9 |
|
0.9 |
| (-) |
By-products revenue |
(1.4) |
(6.8) |
(59.7) |
(22.6) |
(11.9) |
(102.3) |
4.5 |
(97.8) |
| (+) |
Treatment Charges |
26.0 |
2.5 |
9.4 |
6.8 |
1.3 |
46.0 |
|
46.0 |
| (+) |
Selling Expenses |
0.7 |
2.3 |
0.4 |
0.2 |
0.1 |
3.7 |
|
3.7 |
| (-) |
Depreciation, amortization and depletion |
(6.0) |
(2.3) |
(29.5) |
(7.0) |
(4.4) |
(49.1) |
(0.0) |
(49.1) |
| (-) |
Royalties |
(0.5) |
(0.4) |
(1.0) |
(0.5) |
(0.2) |
(2.5) |
|
(2.5) |
| (-) |
Workers participation & Bonus |
(0.4) |
(0.2) |
(0.5) |
(0.7) |
(0.0) |
(1.8) |
|
(1.8) |
| (+) |
Others |
(1.7) |
(0.4) |
2.2 |
0.7 |
1.9 |
2.7 |
|
2.7 |
| (=) |
Cash Cost (Sold) |
47.2 |
10.1 |
16.0 |
17.2 |
2.7 |
93.2 |
2.3 |
95.5 |
| |
Cash Cost (Sold) (per ton) |
1,296.9 |
2,197.7 |
810.3 |
1,389.8 |
1,179.9 |
1,236.3 |
0.0 |
1,266.7 |
| (+) |
Sustaining Capital Expenditure |
10.2 |
1.0 |
9.6 |
9.5 |
0.5 |
30.8 |
14.0 |
44.9 |
| (=) |
Sustaining Cash Cost (Sold) |
57.4 |
11.1 |
25.6 |
26.7 |
3.2 |
124.0 |
16.3 |
140.3 |
| |
Sustaining Cash Cost (Sold) (per ton) |
1,577.3 |
2,407.6 |
1,298.4 |
2,157.4 |
1,421.0 |
1,645.5 |
0.0 |
1,861.8 |
| (+) |
Workers participation & Bonus |
0.4 |
0.2 |
0.5 |
0.7 |
0.0 |
1.8 |
|
1.8 |
| (+) |
Royalties |
0.5 |
0.4 |
1.0 |
0.5 |
0.2 |
2.5 |
|
2.5 |
| (+) |
Corporate G&A |
|
|
|
|
|
|
14.7 |
14.7 |
| (=) |
AISC (Sold) |
|
|
|
|
|
|
|
159.4 |
| (=) |
AISC (Sold) (per ton) |
|
|
|
|
|
|
|
2,114.8 |
| (=) |
AISC (Sold) in US$/lb |
|
|
|
|
|
|
|
0.96 |
| | 50 |
Earnings Release – 3Q23 | |
9M23
| |
US$ million
(excepted indicated otherwise) |
Vazante |
Morro Agudo |
Cerro Lindo |
El Porvenir |
Atacocha |
Consolidation of Operations |
Corporate & Others |
Mining |
| |
Sales Volume (Zinc content in Products) |
|
|
|
|
|
|
|
|
| |
Tonnes |
110,753 |
16,405 |
53,134 |
43,474 |
5,774 |
229,540 |
|
229,540 |
| (+) |
COGS |
95.3 |
49.7 |
256.7 |
147.7 |
49.5 |
598.8 |
(3.8) |
595.1 |
| (+) |
On-site G&A |
0.3 |
0.3 |
0.3 |
0.4 |
0.2 |
1.5 |
|
1.5 |
| (-) |
By-products revenue |
(11.6) |
(24.6) |
(224.9) |
(108.2) |
(47.2) |
(416.5) |
13.4 |
(403.0) |
| (+) |
Treatment Charges |
87.1 |
10.6 |
27.8 |
26.4 |
3.4 |
155.4 |
|
155.4 |
| (+) |
Selling Expenses |
0.2 |
(0.2) |
1.8 |
0.5 |
0.2 |
2.4 |
|
2.4 |
| (-) |
Depreciation, amortization and depletion |
(17.5) |
(4.3) |
(62.5) |
(30.2) |
(11.5) |
(126.0) |
(0.1) |
(126.1) |
| (-) |
Royalties |
(1.6) |
(1.0) |
(0.7) |
(1.9) |
(0.2) |
(5.4) |
|
(5.4) |
| (-) |
Workers participation & Bonus |
(1.6) |
(0.8) |
(4.1) |
(3.3) |
(0.6) |
(10.3) |
|
(10.3) |
| (+) |
Others |
1.3 |
0.4 |
(8.3) |
(6.8) |
(3.0) |
(16.3) |
|
(16.3) |
| (=) |
Cash Cost (Sold) |
152.0 |
30.1 |
(13.9) |
24.6 |
(9.2) |
183.6 |
9.6 |
193.2 |
| |
Cash Cost (Sold) (per ton) |
1,372.0 |
1,837.2 |
(262.2) |
566.8 |
(1,586.4) |
800.1 |
0.0 |
841.8 |
| (+) |
Sustaining Capital Expenditure |
23.2 |
2.2 |
30.3 |
39.8 |
9.7 |
105.3 |
31.8 |
137.0 |
| (=) |
Sustaining Cash Cost (Sold) |
175.1 |
32.3 |
16.4 |
64.5 |
0.6 |
288.9 |
41.3 |
330.2 |
| |
Sustaining Cash Cost (Sold) (per ton) |
1,581.2 |
1,970.8 |
308.9 |
1,483.0 |
99.4 |
458.6 |
0.0 |
1,438.7 |
| (+) |
Workers participation & Bonus |
1.6 |
0.8 |
4.1 |
3.3 |
0.6 |
10.3 |
|
10.3 |
| (+) |
Royalties |
1.6 |
1.0 |
0.7 |
1.9 |
0.2 |
5.4 |
|
5.4 |
| (+) |
Corporate G&A |
|
|
|
|
|
|
34.3 |
34.3 |
| (=) |
AISC (Sold) |
|
|
|
|
|
|
|
380.3 |
| (=) |
AISC (Sold) (per ton) |
|
|
|
|
|
|
|
1,656.8 |
| (=) |
AISC (Sold) in US$/lb |
|
|
|
|
|
|
|
0.75 |
Note: Cash cost and AISC per ton sold does not
include the impact of the cost of idleness capacity of US$2.6 million in Atacocha and US$5.2 million in Cerro Lindo in 9M23.
(1) Our cash cost, sustaining cash cost
and AISC are net of by-products credits, measured with respect to zinc sold.
| | 51 |
Earnings Release – 3Q23 | |
9M22
| |
US$ million
(excepted indicated otherwise) |
Vazante |
Morro Agudo |
Cerro Lindo |
El Porvenir |
Atacocha |
Consolidation of Operations |
Corporate & Others |
Mining |
| |
Sales Volume (Zinc content in Products) |
|
|
|
|
|
|
|
|
| |
Tonnes |
97,858 |
14,086 |
66,007 |
39,875 |
6,686 |
224,512 |
|
224,512 |
| (+) |
COGS |
85.9 |
45.8 |
297.5 |
128.7 |
52.1 |
609.9 |
(7.7) |
602.3 |
| (+) |
On-site G&A |
0.9 |
0.7 |
0.3 |
0.5 |
0.3 |
2.6 |
|
2.6 |
| (-) |
By-products revenue |
(5.6) |
(17.1) |
(255.4) |
(82.8) |
(46.2) |
(407.1) |
14.0 |
(393.1) |
| (+) |
Treatment Charges |
66.7 |
7.1 |
30.3 |
21.0 |
3.5 |
128.6 |
|
128.6 |
| (+) |
Selling Expenses |
0.2 |
0.9 |
1.9 |
0.7 |
0.3 |
4.2 |
|
4.2 |
| (-) |
Depreciation, amortization and depletion |
(18.4) |
(7.0) |
(89.7) |
(19.0) |
(11.0) |
(145.2) |
(0.0) |
(145.2) |
| (-) |
Royalties |
(1.5) |
(1.0) |
(4.3) |
(2.9) |
(0.6) |
(10.5) |
|
(10.5) |
| (-) |
Workers participation & Bonus |
(1.2) |
(0.7) |
(12.3) |
(4.4) |
(0.6) |
(19.1) |
|
(19.1) |
| (+) |
Others |
(8.4) |
(1.0) |
0.1 |
(3.9) |
(3.0) |
(16.2) |
|
(16.2) |
| (=) |
Cash Cost (Sold) |
118.5 |
27.6 |
(31.5) |
37.9 |
(5.2) |
147.3 |
6.3 |
153.6 |
| |
Cash Cost (Sold) (per ton) |
1,211.1 |
1,958.6 |
(477.3) |
950.9 |
(779.5) |
656.1 |
0.0 |
684.2 |
| (+) |
Sustaining Capital Expenditure |
28.3 |
4.7 |
27.6 |
19.8 |
3.3 |
83.7 |
42.0 |
125.7 |
| (=) |
Sustaining Cash Cost (Sold) |
146.8 |
32.3 |
(3.9) |
57.7 |
(1.9) |
231.0 |
48.3 |
279.4 |
| |
Sustaining Cash Cost (Sold) (per ton) |
1,500.4 |
2,292.9 |
(59.5) |
1,447.4 |
(280.0) |
373.0 |
0.0 |
1,244.3 |
| (+) |
Workers participation & Bonus |
1.2 |
0.7 |
12.3 |
4.4 |
0.6 |
19.1 |
|
19.1 |
| (+) |
Royalties |
1.5 |
1.0 |
4.3 |
2.9 |
0.6 |
10.5 |
|
10.5 |
| (+) |
Corporate G&A |
|
|
|
|
|
|
39.2 |
39.2 |
| (=) |
AISC (Sold) |
|
|
|
|
|
|
|
348.2 |
| (=) |
AISC (Sold) (per ton) |
|
|
|
|
|
|
|
1,550.8 |
| (=) |
AISC (Sold) in US$/lb |
|
|
|
|
|
|
|
0.70 |
Note: Cash cost and AISC per ton sold does not
include the impact of the cost of idleness capacity of US$2.1 million in Atacocha and US$4.4 million in Vazante in 9M22.
| | 52 |
Earnings Release – 3Q23 | |
Conversion and
All in Sustaining Cash Cost | Smelting (2)
3Q23
| |
US$ million
(excepted indicated otherwise) |
Três Marias |
Juiz de Fora |
Cajamarquilla |
Consolidation of Operations |
Corporate |
Smelting |
| |
Sales Volume (Zinc content in Products) |
|
|
|
|
|
|
| |
Tonnes |
45,415 |
19,213 |
86,970 |
151,598 |
|
151,598 |
| (+) |
COGS |
113.5 |
65.9 |
260.7 |
440.0 |
(1.2) |
438.8 |
| (-) |
Cost of freight |
(6.3) |
(1.7) |
(9.3) |
(17.3) |
|
(17.3) |
| (+) |
On-site G&A |
0.5 |
0.2 |
1.4 |
2.1 |
0.0 |
2.1 |
| (-) |
Depreciation, amortization and depletion |
(5.9) |
(3.2) |
(11.0) |
(20.1) |
|
(20.1) |
| (-) |
By-products revenue |
(4.2) |
(6.5) |
(34.3) |
(45.1) |
1.2 |
(43.8) |
| (-) |
Workers participation & Bonus |
(0.4) |
(0.3) |
(1.4) |
(2.1) |
|
(2.1) |
| (+) |
Others |
(0.3) |
(0.4) |
(19.6) |
(20.2) |
|
(20.2) |
| (=) |
Cash Cost (Sold) |
96.8 |
53.9 |
186.5 |
337.2 |
0.0 |
337.2 |
| |
Cash Cost (Sold) (per ton) |
2,130.9 |
2,803.7 |
2,144.9 |
2,224.2 |
|
2,224.2 |
| (+) |
Sustaining Capital Expenditure |
4.6 |
4.8 |
7.0 |
16.5 |
2.5 |
19.0 |
| (=) |
Sustaining Cash Cost (Sold) |
101.4 |
58.7 |
193.6 |
353.7 |
2.5 |
356.2 |
| |
Sustaining Cash Cost (Sold) (per ton) |
2,232.8 |
3,055.1 |
2,225.8 |
2,333.0 |
|
2,349.7 |
| (+) |
Workers participation & Bonus |
0.4 |
0.3 |
1.4 |
2.1 |
|
2.1 |
| (+) |
Corporate G&A |
|
|
|
|
7.0 |
7.0 |
| (=) |
AISC (Sold) |
|
|
|
|
|
365.3 |
| (=) |
AISC (Sold) (per ton) |
|
|
|
|
|
2,409.7 |
| (=) |
AISC (Sold) in US$/lb |
|
|
|
|
|
1.09 |
Note: Cash cost and AISC per ton sold does
not include the impact of the cost of metal purchased for resale.
| |
US$ million
(excepted indicated otherwise) |
Três Marias |
Juiz de Fora |
Cajamarquilla |
Smelting |
| |
Contained Zinc Sales |
|
|
|
|
| |
Tonnes |
45,415 |
19,213 |
86,970 |
151,598 |
| |
COGS |
113.5 |
65.9 |
260.7 |
440.0 |
| (-) |
Raw Material |
(42.9) |
(36.3) |
(146.7) |
(225.9) |
| (+) |
By product cost |
(17.5) |
(0.1) |
(9.1) |
(26.8) |
| (+/-) |
Consolidation effects |
(5.6) |
2.0 |
(48.5) |
(52.1) |
| (+) |
Others |
(21.3) |
(9.9) |
(5.5) |
(36.7) |
| (=) |
Conversion Cost |
26.2 |
21.5 |
50.8 |
98.5 |
| (=) |
Conversion Cost in US$/t |
576.8 |
1,118.4 |
583.8 |
649.5 |
| (=) |
Conversion Cost in US$/lb |
0.26 |
0.51 |
0.26 |
0.29 |
(2) Our conversion cost, cash cost, sustaining
cash cost and AISC net of by-products credits are measured with respect to zinc sold.
| | 53 |
Earnings Release – 3Q23 | |
3Q22
| |
US$ million
(excepted indicated otherwise) |
Três Marias |
Juiz de Fora |
Cajamarquilla |
Consolidation of Operations |
Corporate |
Smelting |
| |
Sales Volume (Zinc content in Products) |
|
|
|
|
|
|
| |
Tonnes |
45,183 |
22,129 |
91,454 |
158,766 |
|
158,766 |
| (+) |
COGS |
153.2 |
88.4 |
336.7 |
578.3 |
(1.1) |
577.3 |
| (-) |
Cost of freight |
(5.6) |
(2.8) |
(13.9) |
(22.3) |
|
(22.3) |
| (+) |
On-site G&A |
0.5 |
0.3 |
0.7 |
1.5 |
0.0 |
1.5 |
| (-) |
Depreciation, amortization and depletion |
(4.6) |
(3.2) |
(11.8) |
(19.6) |
|
(19.6) |
| (-) |
By-products revenue |
(2.3) |
(9.2) |
(39.3) |
(50.8) |
1.1 |
(49.8) |
| (-) |
Workers participation & Bonus |
(0.4) |
(0.3) |
(2.8) |
(3.5) |
|
(3.5) |
| (+) |
Others |
(4.1) |
(2.2) |
0.2 |
(6.1) |
|
(6.1) |
| (=) |
Cash Cost (Sold) |
136.7 |
70.9 |
269.8 |
477.4 |
0.0 |
477.4 |
| |
Cash Cost (Sold) (per ton) |
3,024.6 |
3,203.8 |
2,950.4 |
3,006.9 |
|
3,006.9 |
| (+) |
Sustaining Capital Expenditure |
11.9 |
6.5 |
12.2 |
30.7 |
(6.9) |
23.8 |
| (=) |
Sustaining Cash Cost (Sold) |
148.6 |
77.4 |
282.1 |
508.1 |
(6.9) |
501.2 |
| |
Sustaining Cash Cost (Sold) (per ton) |
3,288.9 |
3,497.5 |
3,084.2 |
3,200.1 |
|
3,156.6 |
| (+) |
Workers participation & Bonus |
0.4 |
0.3 |
2.8 |
3.5 |
|
3.5 |
| (+) |
Corporate G&A |
|
|
|
|
8.1 |
8.1 |
| (=) |
AISC (Sold) |
|
|
|
|
|
512.8 |
| (=) |
AISC (Sold) (per ton) |
|
|
|
|
|
3,229.9 |
| (=) |
AISC (Sold) in US$/lb |
|
|
|
|
|
1.47 |
Note: Cash cost and AISC per ton sold does
not include the impact of the cost of metal purchased for resale.
| |
US$ million
(excepted indicated otherwise) |
Três Marias |
Juiz de Fora |
Cajamarquilla |
Smelting |
| |
Contained Zinc Sales |
|
|
|
|
| |
Tonnes |
45,183 |
22,129 |
91,454 |
158,766 |
| |
COGS |
153.2 |
88.4 |
336.7 |
578.3 |
| (-) |
Raw Material |
(109.7) |
(60.6) |
(238.3) |
(408.6) |
| (+) |
By product cost |
(14.0) |
(0.6) |
(6.5) |
(21.0) |
| (+/-) |
Consolidation effects |
1.8 |
0.3 |
(40.5) |
(38.5) |
| (+) |
Others |
(12.0) |
(9.3) |
1.5 |
(19.7) |
| (=) |
Conversion Cost |
19.3 |
18.2 |
52.9 |
90.4 |
| (=) |
Conversion Cost in US$/t |
428.2 |
822.6 |
578.3 |
569.6 |
| (=) |
Conversion Cost in US$/lb |
0.19 |
0.37 |
0.26 |
0.26 |
| | 54 |
Earnings Release – 3Q23 | |
9M23
| |
US$ million
(excepted indicated otherwise) |
Três Marias |
Juiz de Fora |
Cajamarquilla |
Consolidation of Operations |
Corporate |
Smelting |
| |
Sales Volume (Zinc content in Products) |
|
|
|
|
|
|
| |
Tonnes |
134,112 |
59,456 |
246,673 |
440,240 |
|
440,240 |
| (+) |
COGS |
383.3 |
203.5 |
739.3 |
1,326.0 |
(3.6) |
1,322.4 |
| (-) |
Cost of freight |
(16.3) |
(6.7) |
(33.2) |
(56.3) |
|
(56.3) |
| (+) |
On-site G&A |
1.1 |
0.5 |
4.0 |
5.6 |
|
5.6 |
| (-) |
Depreciation, amortization and depletion |
(15.4) |
(9.7) |
(32.6) |
(57.7) |
|
(57.7) |
| (-) |
By-products revenue |
(10.8) |
(19.3) |
(101.3) |
(131.3) |
3.6 |
(127.8) |
| (-) |
Workers participation & Bonus |
(1.2) |
(1.2) |
(6.2) |
(8.6) |
|
(8.6) |
| (+) |
Others |
3.3 |
1.6 |
9.6 |
14.4 |
|
14.4 |
| (=) |
Cash Cost (Sold) |
343.8 |
168.7 |
579.6 |
1,092.1 |
0.0 |
1,092.1 |
| |
Cash Cost (Sold) (per ton) |
2,563.7 |
2,836.7 |
2,349.7 |
2,480.7 |
|
2,480.7 |
| (+) |
Sustaining Capital Expenditure |
15.8 |
10.1 |
15.8 |
41.6 |
16.9 |
58.5 |
| (=) |
Sustaining Cash Cost (Sold) |
359.6 |
178.7 |
595.4 |
1,133.7 |
16.9 |
1,150.6 |
| |
Sustaining Cash Cost (Sold) (per ton) |
2,681.4 |
3,006.0 |
2,413.6 |
2,575.2 |
|
2,613.6 |
| (+) |
Workers participation & Bonus |
1.2 |
1.2 |
6.2 |
8.6 |
|
8.6 |
| (+) |
Corporate G&A |
|
|
|
|
19.7 |
19.7 |
| (=) |
AISC (Sold) |
|
|
|
|
|
1,178.9 |
| (=) |
AISC (Sold) (per ton) |
|
|
|
|
|
2,677.8 |
| (=) |
AISC (Sold) in US$/lb |
|
|
|
|
|
1.21 |
Note: Cash cost and AISC per ton sold does
not include the impact of the cost of metal purchased for resale.
| |
US$ million
(excepted indicated otherwise) |
Três Marias |
Juiz de Fora |
Cajamarquilla |
Smelting |
| |
Contained Zinc Sales |
|
|
|
|
| |
Tonnes |
134,112 |
59,455 |
246,673 |
440,240 |
| |
COGS |
383.2 |
203.5 |
739.3 |
1,326.0 |
| (-) |
Raw Material |
(188.6) |
(125.9) |
(502.3) |
(816.8) |
| (+) |
By product cost |
(50.1) |
(1.5) |
(23.5) |
(75.1) |
| (+/-) |
Consolidation effects |
(2.5) |
8.3 |
(63.4) |
(57.7) |
| (+) |
Others |
(62.4) |
(18.5) |
4.4 |
(76.5) |
| (=) |
Conversion Cost |
79.6 |
65.8 |
154.5 |
299.9 |
| (=) |
Conversion Cost in US$/t |
593.4 |
1,107.3 |
626.3 |
681.2 |
| (=) |
Conversion Cost in US$/lb |
0.27 |
0.50 |
0.28 |
0.31 |
(2) Our conversion cost, cash cost, sustaining
cash cost and AISC net of by-products credits are measured with respect to zinc sold.
| | 55 |
Earnings Release – 3Q23 | |
9M22
| |
US$ million
(excepted indicated otherwise) |
Três Marias |
Juiz de Fora |
Cajamarquilla |
Consolidation of Operations |
Corporate |
Smelting |
| |
Sales Volume (Zinc content in Products) |
|
|
|
|
|
|
| |
Tonnes |
129,540 |
61,464 |
241,331 |
432,335 |
|
432,335 |
| (+) |
COGS |
475.8 |
246.6 |
902.4 |
1,624.7 |
(4.4) |
1,620.3 |
| (-) |
Cost of freight |
(14.3) |
(7.7) |
(41.9) |
(64.0) |
|
(64.0) |
| (+) |
On-site G&A |
1.6 |
0.8 |
5.0 |
7.4 |
0.0 |
7.4 |
| (-) |
Depreciation, amortization and depletion |
(14.0) |
(10.0) |
(37.0) |
(61.1) |
|
(61.1) |
| (-) |
By-products revenue |
(6.7) |
(29.6) |
(127.6) |
(163.8) |
4.4 |
(159.4) |
| (-) |
Workers participation & Bonus |
(1.0) |
(0.9) |
(10.8) |
(12.8) |
|
(12.8) |
| (+) |
Others |
(11.0) |
(4.6) |
10.2 |
(5.3) |
|
(5.3) |
| (=) |
Cash Cost (Sold) |
430.3 |
194.6 |
700.2 |
1,325.1 |
0.0 |
1,325.1 |
| |
Cash Cost (Sold) (per ton) |
3,321.7 |
3,166.1 |
2,901.3 |
3,064.9 |
|
3,064.9 |
| (+) |
Sustaining Capital Expenditure |
29.9 |
16.9 |
32.4 |
79.2 |
(13.8) |
65.4 |
| (=) |
Sustaining Cash Cost (Sold) |
460.2 |
211.5 |
732.6 |
1,404.3 |
(13.8) |
1,390.5 |
| |
Sustaining Cash Cost (Sold) (per ton) |
3,552.5 |
3,441.0 |
3,035.6 |
3,248.1 |
|
3,216.2 |
| (+) |
Workers participation & Bonus |
1.0 |
0.9 |
10.8 |
12.8 |
|
12.8 |
| (+) |
Corporate G&A |
|
|
|
|
22.7 |
22.7 |
| (=) |
AISC (Sold) |
|
|
|
|
|
1,426.0 |
| (=) |
AISC (Sold) (per ton) |
|
|
|
|
|
3,298.4 |
| (=) |
AISC (Sold) in US$/lb |
|
|
|
|
|
1.50 |
Note: Cash cost and AISC per ton sold does
not include the impact of the cost of metal purchased for resale and the cost of idleness capacity of US$2.3 million in Três Marias
in 9M22.
| |
US$ million
(excepted indicated otherwise) |
Três Marias |
Juiz de Fora |
Cajamarquilla |
Smelting |
| |
Contained Zinc Sales |
|
|
|
|
| |
Tonnes |
129,540 |
61,464 |
241,331 |
432,335 |
| |
COGS |
475.8 |
246.6 |
902.4 |
1,624.7 |
| (-) |
Raw Material |
(340.9) |
(176.4) |
(709.4) |
(1,226.7) |
| (+) |
By product cost |
(43.1) |
(2.8) |
(19.7) |
(65.6) |
| (+/-) |
Consolidation effects |
(1.4) |
0.9 |
(17.5) |
(18.0) |
| (+) |
Others |
(38.0) |
(17.3) |
(5.4) |
(60.7) |
| (=) |
Conversion Cost |
52.4 |
51.1 |
150.4 |
253.8 |
| (=) |
Conversion Cost in US$/t |
404.3 |
830.7 |
623.0 |
587.0 |
| (=) |
Conversion Cost in US$/lb |
0.18 |
0.38 |
0.28 |
0.27 |
| |
56 |
Nexa Resources (NYSE:NEXA)
Historical Stock Chart
From Mar 2024 to Apr 2024

Nexa Resources (NYSE:NEXA)
Historical Stock Chart
From Apr 2023 to Apr 2024
