Maersk Profit Rises Amid Surging Demand, Freight Rates
February 10 2021 - 2:18AM
Dow Jones News
By Dominic Chopping
A.P. Moeller-Maersk AS said Wednesday that it saw surging demand
in the fourth quarter while freight rates spiked due to bottlenecks
across the entire supply chain, including a shortage of ships and
containers.
As a result, the first quarter of 2021 is expected to be
stronger than the fourth quarter of 2020, the company said.
The Danish shipping giant posted a quarterly net profit
attributable to shareholders of $1.3 billion, compared with a loss
of $72 million a year earlier, and against the $1.39 billion seen
in an analyst forecast from FactSet.
Revenue rose 16% to $11.26 billion against $10.91 billion
expected.
Maersk, which is considered a barometer of global trade, said
shipping volumes rose 3.2% and average freight rates surged 18%,
while fuel costs fell 14% on the year.
"Ocean performed at record level in the quarter as a consequence
of the strong rebound of demand which led to full capacity
utilization but also to bottlenecks, higher costs and difficulties
in meeting our customer reliability promises," said Chief Executive
Soren Skou.
Organic volume growth in its main ocean unit is expected to be
in line with global container demand at an expected 3%-5% in 2021,
with the highest growth seen in the first-half of the year.
Maersk expects underlying earnings before interest, tax,
depreciation and amortization in 2021 at between $8.5 billion-$10.5
billion from $8.3 billion in 2020, with underlying EBIT of $4.3
billion-$6.3 billion from $4.2 billion in 2020 and free cash flow
above $3.5 billion versus $4.2 billion in 2020.
For 2021-22, accumulated capital expenditure is still expected
at $4.5 billion-$5.5 billion.
Write to Dominic Chopping at dominic.chopping@wsj.com
(END) Dow Jones Newswires
February 10, 2021 03:03 ET (08:03 GMT)
Copyright (c) 2021 Dow Jones & Company, Inc.
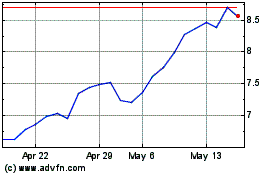
AP Moller Maersk AS (PK) (USOTC:AMKBY)
Historical Stock Chart
From Dec 2024 to Jan 2025

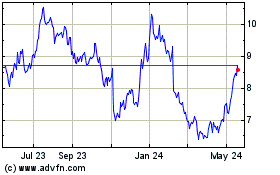
AP Moller Maersk AS (PK) (USOTC:AMKBY)
Historical Stock Chart
From Jan 2024 to Jan 2025
