TIDMASAI
RNS Number : 9863M
ASA International Group PLC
20 September 2023
Press Release
ASA International Group plc August 2023 business update
Amsterdam, The Netherlands, 20 September 2023 - ASA
International, ('ASA International', the 'Company' or the 'Group'),
one of the world's largest international microfinance institutions,
today provides the following update on its business operations as
of 31 August 2023.
-- The Group's Gross OLP increased to USD 352 million (1% higher
than in May 2023 and 5% lower than in August 2022), primarily due
to increased disbursements in India, Ghana and Kenya.
-- All operating subsidiaries except India, achieved collection
efficiency of more than 90% with 11 countries achieving more than
95%.
-- Collection efficiency in Nigeria improved from May 2023 to August 2023, following the end of demonetization and the national election cycle.
-- India collections remained stable at 85% in August 2023
compared to May 2023. Collection efficiency, including regular and
overdue collections as well as advance payments, as a percentage of
the regular, realisable collections, including advance payments,
decreased from 97% in May 2023 to 92% in August 2023.
-- PAR>30 for the Group, including off-book loans and
excluding loans overdue more than 365 days, decreased to 3.6% in
August 2023 from 4.2% in May 2023, primarily due to improving
portfolio quality in Nigeria and Myanmar.
-- The PAR>30 for the Group's operating subsidiaries,
excluding India and Nigeria, decreased to 1.1% in August 2023 from
1.3% in May 2023.
-- Excluding all loans which have been overdue for more than 180
days and, as a result, have been fully provided for, PAR>30
improved to 1.3% in August 2023 from 2.5% in May 2023.
-- Disbursements as a percentage of collections exceeded 100% in
11 countries. The improved percentage in India was due to
additional growth of the BC portfolio following new BC partnership
agreements.
Collection efficiency until 31 August 2023 (1)
 Countries                 Mar/23      Apr/23      May/23      Jun/23     Jul/23     Aug/23
                         ----------  ----------  ----------  ---------  ---------
 Pakistan                    99%         99%        100%        100%       100%       100%
 India (total)               86%         88%         86%        85%        87%        85%
 Sri Lanka                   95%         95%         96%        96%        96%        96%
 The Philippines             99%         99%         99%        99%        99%        99%
 Myanmar                    100%         99%        100%        100%       100%       100%
 Ghana                      100%        100%        100%        100%       100%       100%
 Nigeria                     78%         77%         84%        87%        92%        95%
 Sierra Leone                95%         96%         96%        96%        97%        98%
 Tanzania                   100%         99%         99%        99%        99%        99%
 Kenya                      100%        100%        100%        100%       100%       100%
 Uganda                     100%        100%         99%        99%        99%        100%
 Rwanda                      96%         96%         96%        96%        97%        97%
 Zambia                      98%         98%         98%        99%        99%        99%
-----------------------  ----------  ----------  ----------  ---------  ---------  ---------
 (1) Collection efficiency refers to actual collections from clients
  divided by realisable collections for the period. It is calculated
  as follows: the sum of actual regular collections, actual overdue collections
  and actual advance payments divided by the sum of realisable regular
  collections, actual overdue collections
  and actual advance payments. Under this definition collection efficiency
  cannot exceed 100%.
-- Collection efficiency remained broadly stable in most of our
operating countries compared to May 2023.
-- Adjusted collection efficiency in India, including regular
and overdue collections as well as advance payments, as a
percentage of the regular, realisable collections, including
advance payments decreased from 97% in May 2023 to 92% in August
2023. The substantial difference of this adjusted collection
efficiency metric is related to the Group's policy that any loan
instalment paid is first credited against the oldest outstanding
amount overdue. This has an adverse impact on India's monthly
collection efficiency, which is further aggravated by the
relatively long duration of the loans disbursed in India. This
adjusted collection efficiency metric illustrates that most clients
in India continue to make payments on their loans due.
-- Although market conditions in both Myanmar and Sri Lanka
remained challenging, collection efficiency remained stable in both
markets.
-- Collection efficiency in Nigeria improved from May 2023 to August 2023, following the end of demonetization and the national election cycle.
Loan portfolio quality up to and including August 2023 (2, 3,
4)
                     Gross OLP (in USDm)         Non-overdue loans         PAR>30 less PAR>180
                 -------------------------
                  Jun-23   Jul-23   Aug-23   Jun-23   Jul-23   Aug-23   Jun-23   Jul-23   Aug-23
 Pakistan          66       67          65    99.5%    99.5%    99.6%     0.3%     0.3%     0.2%
 India (total)     50       50          50    68.7%    65.7%    74.8%     3.0%     3.0%     2.8%
 Sri Lanka         4        4            4    88.5%    89.2%    86.9%     3.3%     3.2%     2.8%
 Philippines       52       52          51    97.0%    96.3%    95.7%     1.2%     1.3%     1.3%
 Myanmar           18       18          19    90.7%    91.3%    91.7%     0.0%     0.0%     0.0%
 Ghana             41       43          45    99.4%    99.4%    99.7%     0.1%     0.1%     0.1%
 Nigeria           17       18          18    77.0%    79.2%    79.4%    14.2%    11.6%     9.1%
 Sierra
  Leone            5        5            5    84.0%    84.8%    86.9%     3.7%     2.7%     2.0%
 Tanzania          57       56          57    99.1%    98.9%    98.9%     0.5%     0.5%     0.5%
 Kenya             18       19          20    99.1%    99.1%    99.3%     0.2%     0.2%     0.2%
 Uganda            12       12          12    98.7%    98.8%    98.9%     0.6%     0.7%     0.5%
 Rwanda            4        4            4    91.5%    91.7%    91.5%     4.2%     4.2%     3.9%
 Zambia            4        3            3    94.4%    94.1%    94.1%     1.9%     1.8%     1.5%
                                   -------
 Group             347      351      352      92.5%    92.2%    92.3%     1.7%     1.5%     1.3%


                             PAR>30                      PAR>90                     PAR>180
                  ---------------------------  -------------------------  -------------------------
                    Jun-23    Jul-23   Aug-23   Jun-23   Jul-23   Aug-23   Jun-23   Jul-23   Aug-23
 Pakistan             0.3%      0.3%     0.3%     0.2%     0.2%     0.2%     0.0%     0.1%     0.1%
 India (total)       13.8%     15.3%    13.5%    12.9%    14.2%    12.6%    10.7%    12.3%    10.7%
 Sri Lanka            6.4%      6.2%     5.6%     4.7%     4.3%     4.0%     3.1%     3.0%     2.8%
 Philippines          1.9%      2.0%     2.3%     1.4%     1.5%     1.6%     0.7%     0.8%     1.0%
 Myanmar              1.2%      0.7%     0.3%     1.2%     0.6%     0.3%     1.2%     0.6%     0.3%
 Ghana                0.2%      0.2%     0.1%     0.1%     0.1%     0.1%     0.1%     0.1%     0.1%
 Nigeria             15.5%     13.6%    15.0%     8.9%    10.1%    12.8%     1.3%     2.0%     5.8%
 Sierra
  Leone              11.3%     10.2%     7.9%    10.0%     9.1%     7.0%     7.6%     7.5%     5.9%
 Tanzania             0.7%      0.7%     0.8%     0.4%     0.5%     0.5%     0.2%     0.2%     0.2%
 Kenya                0.5%      0.5%     0.4%     0.5%     0.4%     0.3%     0.3%     0.3%     0.2%
 Uganda               0.9%      1.0%     0.9%     0.5%     0.6%     0.7%     0.3%     0.3%     0.3%
 Rwanda               6.8%      7.1%     7.7%     4.8%     5.1%     6.0%     2.6%     2.9%     3.8%
 Zambia               4.2%      4.3%     4.1%     3.5%     3.7%     3.5%     2.3%     2.5%     2.6%
 Group                3.7%      3.8%     3.6%     3.0%     3.2%     3.1%     2.0%     2.3%     2.2%
 (2) Gross OLP includes the off-book BC and DA model, and loans valued
  at fair value through the P&L ("FVTPL").
  (3) PAR>x is the percentage of outstanding customer loans with at
  least one instalment payment overdue x days, excluding loans more
  than 365 days overdue, to Gross OLP including off-book loans. Loans
  overdue more than 365 days now comprise 3.5% of the Gross OLP.
  (4) The table "PAR>30 less PAR>180" shows the percentage of outstanding
  client loans with a PAR greater than 30 days, less those loans which
  have been fully provided for.
-- Gross OLP in India increased to USD 50 million (10% higher
than in May 2023 and 26% lower than in August 2022).
-- PAR>30 for the Group improved from 4.2% in May 2023 to
3.6% in August 2023, primarily due to improving portfolio quality
in Nigeria and Myanmar .
-- Credit exposure of the India off-book IDFC portfolio of USD
12.1 million is capped at 5%. The included off-book DA portfolio of
USD 1.1 million has no credit exposure.
Disbursements vs collections of loans until 31 August 2023
(5)
 Countries                Mar/23     Apr/23     May/23     Jun/23     Jul/23     Aug/23
                        ---------  ---------  ---------  ---------  ---------
 Pakistan                  107%       108%       115%       109%       107%       118%
 India (total)             87%        77%        61%        141%       125%       130%
 Sri Lanka                 120%       46%        88%        84%        101%       94%
 The Philippines           104%       107%       98%        101%       98%        104%
 Myanmar                   91%        80%        115%       103%       124%       120%
 Ghana                     104%       117%       110%       126%       115%       119%
 Nigeria                   58%        110%       126%       143%       109%       105%
 Sierra Leone              118%       119%       110%       95%        134%       144%
 Tanzania                  106%       118%       110%       116%       104%       112%
 Kenya                     109%       107%       106%       107%       120%       118%
 Uganda                    101%       100%       103%       95%        98%        104%
 Rwanda                    93%        100%       115%       106%       98%        93%
 Zambia                    115%       132%       115%       103%       82%        101%
----------------------  ---------  ---------  ---------  ---------  ---------  ---------
 (5) Disbursements vs collections refers to actual loan disbursements made
  to clients divided by total amounts collected from clients in the period.
-- Disbursements as a percentage of collections exceeded 100% in
11 countries. The improved percentage in India was due to
additional growth of the BC portfolio following new BC partnership
agreements.
Development of Clients and Outstanding Loan Portfolio until 31
August 2023
                                                                                  Gross OLP (in
                  Clients (in thousands)                Delta                         USDm)                             Delta
                                                                                                                                       Jul/23-
                                                                                                       Aug/22-Aug/23   Aug/22-Aug/23    Aug/23
 Countries      Aug/22   Jul/23    Aug/23   Aug/22-Aug/23   Jul/23-Aug/23   Aug/22   Jul/23   Aug/23             USD          CC (6)       USD
 Pakistan          590      610       616              4%              1%       77       67       65            -17%             16%       -3%
 India
  (total)          383      206       229            -40%             11%       67       50       50            -26%            -23%        0%
 Sri Lanka          45       46        45              0%             -1%        4        4        4             23%             10%        3%
 The
  Philippines      321      330       331              3%            0.3%       47       52       51              9%             10%       -2%
 Myanmar           104      103       103             -1%              0%       17       18       19             13%             13%        3%
 Ghana             169      187       197             16%              5%       34       43       45             33%             51%        5%
 Nigeria           242      171       182            -25%              6%       41       18       18            -56%            -20%        1%
 Sierra
  Leone             37       37        40              8%              7%        5        5        5             -7%             44%        7%
 Tanzania          204      228       232             14%              1%       44       56       57             29%             39%        1%
 Kenya             134      183       188             41%              3%       19       19       20              8%             31%        4%
 Uganda            105      107       109              3%              2%       10       12       12             13%             11%     -1.1%
 Rwanda             20       20        20             -1%             -1%        4        4        4             -9%              4%       -2%
 Zambia             20       23        23             16%              0%        3        3        3              0%             26%       -6%
 Total           2,374    2,252     2,314             -3%              3%      371      351      352             -5%           10.9%      0.3%
(6) Constant currency ('CC') implies conversion of local
currency results to USD with the exchange rate from the beginning
of the period.
-- The Group's Gross OLP slightly increased to USD 352 million
(1% higher than in May 2023 and 5% lower than in August 2022),
primarily due to increased disbursements in India, Ghana and
Kenya.
Key events August and September 2023
The Pakistan government, through the Finance Act 2023, has
re-introduced a 10% super tax rate for taxpayers in all sectors
with income in excess of Rs 35 crores (for both 2022 and 2023). In
line with the previous Finance Act 2022, this rate is stipulated to
apply retrospectively on income earned in FY 2022. The
retrospective application of this super tax rate is currently being
contested by different petitioners in Courts in Pakistan. The
matter is also expected to be referred to the Supreme Court for
adjudication.
---
Enquiries:
ASA International Group plc
Investor Relations
Mischa Assink ir @asa-international.com
About ASA International Group plc
ASA International Group plc (ASAI: LN) is one of the world's
largest international microfinance institutions, with a strong
commitment to financial inclusion and socioeconomic progress. The
company provides small, socially responsible loans to low-income,
financially underserved entrepreneurs, predominantly women, across
South Asia, South East Asia, West and East Africa.
This information is provided by RNS, the news service of the
London Stock Exchange. RNS is approved by the Financial Conduct
Authority to act as a Primary Information Provider in the United
Kingdom. Terms and conditions relating to the use and distribution
of this information may apply. For further information, please
contact rns@lseg.com or visit www.rns.com.
RNS may use your IP address to confirm compliance with the terms
and conditions, to analyse how you engage with the information
contained in this communication, and to share such analysis on an
anonymised basis with others as part of our commercial services.
For further information about how RNS and the London Stock Exchange
use the personal data you provide us, please see our Privacy
Policy.
END
TSTKKLFFXKLZBBK
(END) Dow Jones Newswires
September 20, 2023 02:00 ET (06:00 GMT)
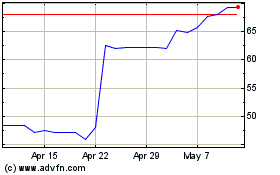
Asa (LSE:ASAI)
Historical Stock Chart
From Mar 2024 to Apr 2024

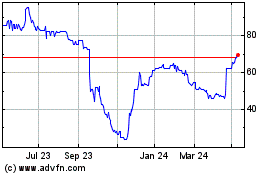
Asa (LSE:ASAI)
Historical Stock Chart
From Apr 2023 to Apr 2024
