XRP Prediction: Analyst Says Bullish Divergences Are Still Present, Here’s Why
August 08 2024 - 12:00AM
NEWSBTC
XRP is currently trading slightly above the $0.50 price level,
having experienced a significant price decline that erased most of
its gains from the previous month. XRP managed to break through the
$0.60 price level in a rally last month, although this surge was
short-lived, lasting only a few days. Despite this setback, crypto
analyst Javon Marks notes that there are still bullish divergence
patterns present in the market, suggesting that another breakout
could be on the horizon. These patterns indicate potential upward
momentum, hinting at a possible recovery and a very optimistic
price surge to new all-time highs. Bullish Divergences Are Still
Present Crypto analyst Javon Marks recently shared an intriguing
XRP technical analysis on the social media platform X with very
bullish price prediction targets for the cryptocurrency.
According to Marks, the crypto asset recently embarked on a bullish
rally, which ultimately turned into an attempted breakout before
reversing. The rally he was talking about was XRP’s price journey
from $0.4321 in July, which saw it peak at $0.6534 on July 31,
according to data from Coinmarketcap. As such, XRP ended up
breaking out of a multi-year descending triangle pattern. Related
Reading: Explosive XRP Prediction: Analyst Foresees 20-Fold Gain
This interesting pattern is shown on Javon Marks’ XRPUSD monthly
candlestick chart. The descending triangle pattern, which has been
in formation since XRP’s all-time high of $3.4 in 2018, is
characterized by a series of lower highs and higher lows. Over the
past six years, this pattern has become smaller, reflecting a
period of consolidation and reduced volatility. This formation has
tightened for the past few months, culminating in the minor
breakout in July and a move towards a more bullish outlook for XRP.
Although the XRP price now finds itself trading within this region
of descending triangular pattern again, Javon Marks remains
optimistic. Furthermore, he pointed out an interesting correlation
between the price action and the Relative Strength Index (RSI),
which is a popular momentum indicator. According to Marks, this
correlation suggests that a successful bullish breakout is on the
horizon. $XRP recently broke out temporarily which looks to have
been only an attempted breakout but, between Price Action and the
RSI, there are patterns still present through bull divergences that
can suggest a successful bullish breakout to be on the horizon! On
a conservative note,… https://t.co/BCrp9CwT6i
pic.twitter.com/XGGiv0nBDp — JAVON⚡️MARKS (@JavonTM1) August 6,
2024 Price Targets For XRP According to Marks, a successful
breakout would translate into a price range between $15 and $18 on
the conservative end. A more intense rally could result in XRP
reaching above the $100 price level. His final target on the price
chart is $260 for XRP, which represents an increase of 41,780% from
the current price level. Rallies of such magnitude are not new to
the crypto industry. As Marks noted, we’ve witnessed full
logarithmic scale follow-throughs of this nature in the past. The
last time the altcoin broke out of a similar multi-year descending
triangle pattern was in 2017, resulting in a 42,000% price increase
that culminated in its current all-time high. Related Reading: XRP
Price Recovery Encounters Hurdles: Will It Prevail? However,
realistically speaking, the crypto market has evolved since then.
XRP is now one of the largest cryptocurrencies in terms of market
cap, and a repeat of such a 40,000% surge is easier said than done.
A lone XRP rally of that magnitude would propel XRP to overtake
even Bitcoin in terms of market cap, which many market participants
would deem impossible. Nevertheless, a sustained XRP rally in the
near future is not out of the question. At the time of writing, XRP
is trading at $0.5162 and is up by 3% in the past 24 hours.
Featured image from Adobe Stock, chart from Tradingview.com
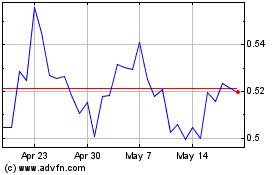
Ripple (COIN:XRPUSD)
Historical Stock Chart
From Dec 2024 to Jan 2025

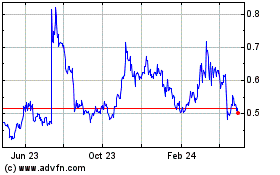
Ripple (COIN:XRPUSD)
Historical Stock Chart
From Jan 2024 to Jan 2025
