
2022 Annual Report Driving value

ALGONQUIN | LIBERTY 2022 Annual Report Corporate profile Algonquin Power & Utilities Corp. (“AQN”,
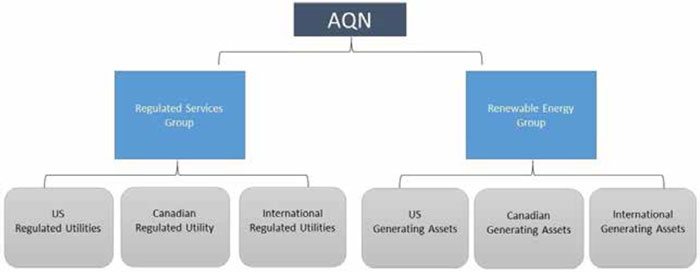
the “Company”, or “we”), parent company of Liberty, is a diversified international generation, transmission, and distribution utility with over $17 billion of total assets. Through its two business groups, the Regulated Services Group and the
Renewable Energy Group, AQN is committed to providing safe, secure, reliable, cost-effective, and sustainable energy and water solutions through its portfolio of electric generation, transmission, and distribution utility investments to over one
million customer connections, largely in the United States and Canada. AQN is a global leader in renewable energy through its portfolio of long-term contracted wind, solar, and hydroelectric generating facilities, together with its pipeline of
renewable energy development projects. AQN owns, operates, and/or has net interests in over 4 GW of installed renewable energy capacity. AlgonquinPowerandUtilities.com TSX/NYSE: AQN ALGONQUIN | LIBERTY II 2022 Annual Report

Forward-looking information This document contains statements that constitute “forward-looking
statements” or “forward-looking information” within the meaning of applicable securities legislation (collectively, “forward-looking information”). The words “aims”, “anticipates”, “expects”, “could”, “intends”, “may”, “plans”, “potential”, “will”,
“would”, “seeks”, “target”, “trends” and similar words and expressions are often intended to identify forward-looking information, although not all forward-looking information contains these identifying words. Specific forward-looking information in
this document includes, but is not limited to: expected future growth, earnings, and operational performance; statements regarding acquisitions, projects, strategies and asset recycling; statements regarding the Company’s use of capital; the expected
generating capacity and completion of the Sandhill RNG project; statements regarding services provided to customers; statements regarding sustainability; statements regarding the Company’s emissions; the Company’s ESG targets, plans and activities,
including its net-zero by 2050 target; and expectations regarding future “greening the fleet” opportunities. Readers are advised that all forward-looking information in this document is provided subject to the “Caution Concerning Forward-Looking
Statements and Forward-Looking Information” section of the Management Discussion & Analysis section of this Annual Report. Algonquin Power & Utilities Corp. 2022 annual report Corporate profile II 2022 stats at a glance IV Renewable Services
Group V Regulated Energy Group V Financial highlights VI Growth Pillar VIII Operational Excellence Pillar XI Sustainability Pillar XII Appendices Management Discussion & Analysis 1 Consolidated Financial Statements 70 Management’s Report 71
Independent Auditor’s Report 72 Notes to the Consolidated 85 Financial Statements Algonquin’s leadership 153 Corporate info BC III
ALGONQUIN | LIBERTY 2022 Annual Report IV ~309,000 electric customer
connections ~375,000 natural gas customer connections ~560,000 water and wastewater customer connections 1,261 wind turbines 1,520,280 solar panels 53 hydroelectric generators Founded in 1988 3,900+ employees Headquartered
in Greater Toronto Area, Ontario Over $17 billion total assets ~$4.4 billion market cap (NYSE) 8,482 miles of gas distribution lines 13,517 miles of electricity distribution lines 6,941 miles of water distribution mains 1. Data in
this report is provided as of December 31, 2022 unless otherwise stated. Dollar figures herein are presented in U.S. dollars unless otherwise stated. At a glance stats1
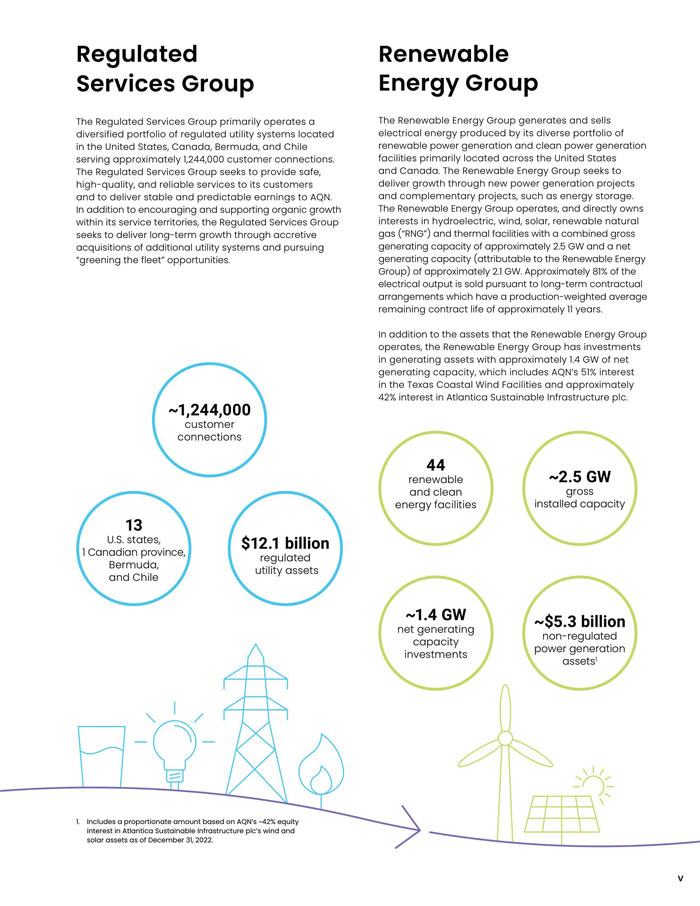
V ~1,244,000 customer connections $12.1 billion regulated utility assets ~2.5 GW gross installed
capacity ~$5.3 billion non-regulated power generation assets1 13 U.S. states, 1 Canadian province, Bermuda, and Chile 44 renewable and clean energy facilities ~1.4 GW net generating capacity investments Regulated Services Group The Regulated Services
Group primarily operates a diversified portfolio of regulated utility systems located in the United States, Canada, Bermuda, and Chile serving approximately 1,244,000 customer connections. The Regulated Services Group seeks to provide safe,
high-quality, and reliable services to its customers and to deliver stable and predictable earnings to AQN. In addition to encouraging and supporting organic growth within its service territories, the Regulated Services Group seeks to deliver
long-term growth through accretive acquisitions of additional utility systems and pursuing “greening the fleet” opportunities. Renewable Energy Group The Renewable Energy Group generates and sells electrical energy produced by its diverse portfolio
of renewable power generation and clean power generation facilities primarily located across the United States and Canada. The Renewable Energy Group seeks to deliver growth through new power generation projects and complementary projects, such as
energy storage. The Renewable Energy Group operates, and directly owns interests in hydroelectric, wind, solar, renewable natural gas (“RNG”) and thermal facilities with a combined gross generating capacity of approximately 2.5 GW and a net
generating capacity (attributable to the Renewable Energy Group) of approximately 2.1 GW. Approximately 81% of the electrical output is sold pursuant to long-term contractual arrangements which have a production-weighted average remaining contract
life of approximately 11 years. In addition to the assets that the Renewable Energy Group operates, the Renewable Energy Group has investments in generating assets with approximately 1.4 GW of net generating capacity, which includes AQN’s 51%
interest in the Texas Coastal Wind Facilities and approximately 42% interest in Atlantica Sustainable Infrastructure plc. 1. Includes a proportionate amount based on AQN’s ~42% equity interest in Atlantica Sustainable Infrastructure plc’s wind and
solar assets as of December 31, 2022.
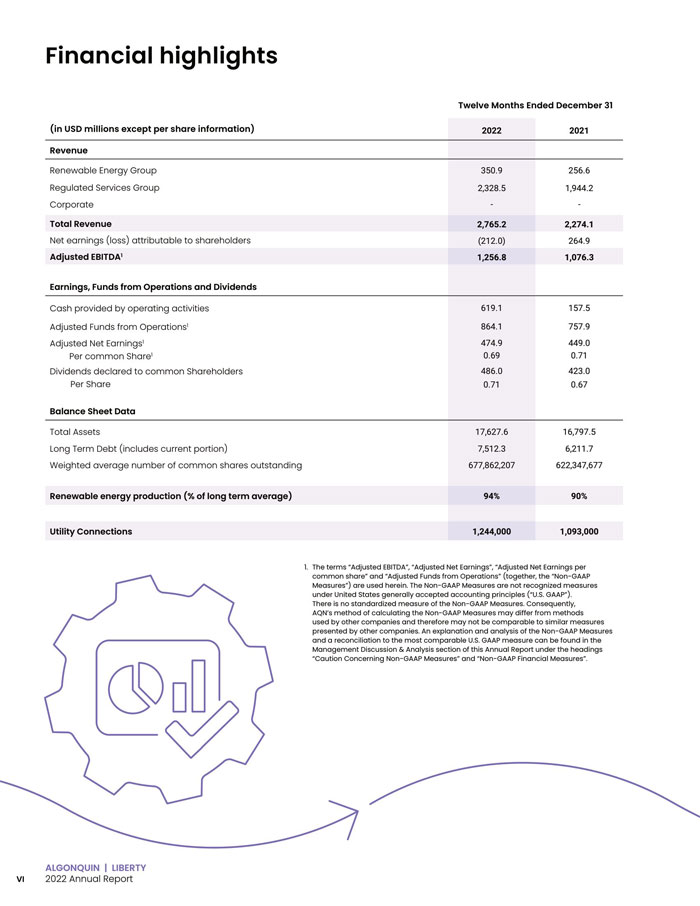
ALGONQUIN | LIBERTY VI 2022 Annual Report Twelve Months Ended December 31 (in USD millions except per
share information) 2022 2021 Revenue Renewable Energy Group 350.9 256.6 Regulated Services Group 2,328.5 1,944.2 Corporate - - Total Revenue 2,765.2 2,274.1 Net earnings (loss) attributable to shareholders (212.0) 264.9 Adjusted EBITDA1 1,256.8
1,076.3 Earnings, Funds from Operations and Dividends Cash provided by operating activities 619.1 157.5 Adjusted Funds from Operations1 864.1 757.9 Adjusted Net Earnings1 474.9 449.0 Per common Share1 0.69 0.71 Dividends declared to common
Shareholders 486.0 423.0 Per Share 0.71 0.67 Balance Sheet Data Total Assets 17,627.6 16,797.5 Long Term Debt (includes current portion) 7,512.3 6,211.7 Weighted average number of common shares outstanding 677,862,207 622,347,677 Renewable energy
production (% of long term average) 94% 90% Utility Connections 1,244,000 1,093,000 1. The terms “Adjusted EBITDA”, “Adjusted Net Earnings”, “Adjusted Net Earnings per common share” and “Adjusted Funds from Operations” (together, the “Non-GAAP
Measures”) are used herein. The Non-GAAP Measures are not recognized measures under United States generally accepted accounting principles (“U.S. GAAP”). There is no standardized measure of the Non-GAAP Measures. Consequently, AQN’s method of
calculating the Non-GAAP Measures may differ from methods used by other companies and therefore may not be comparable to similar measures presented by other companies. An explanation and analysis of the Non-GAAP Measures and a reconciliation to the
most comparable U.S. GAAP measure can be found in the Management Discussion & Analysis section of this Annual Report under the headings “Caution Concerning Non-GAAP Measures” and “Non-GAAP Financial Measures”. Financial highlights
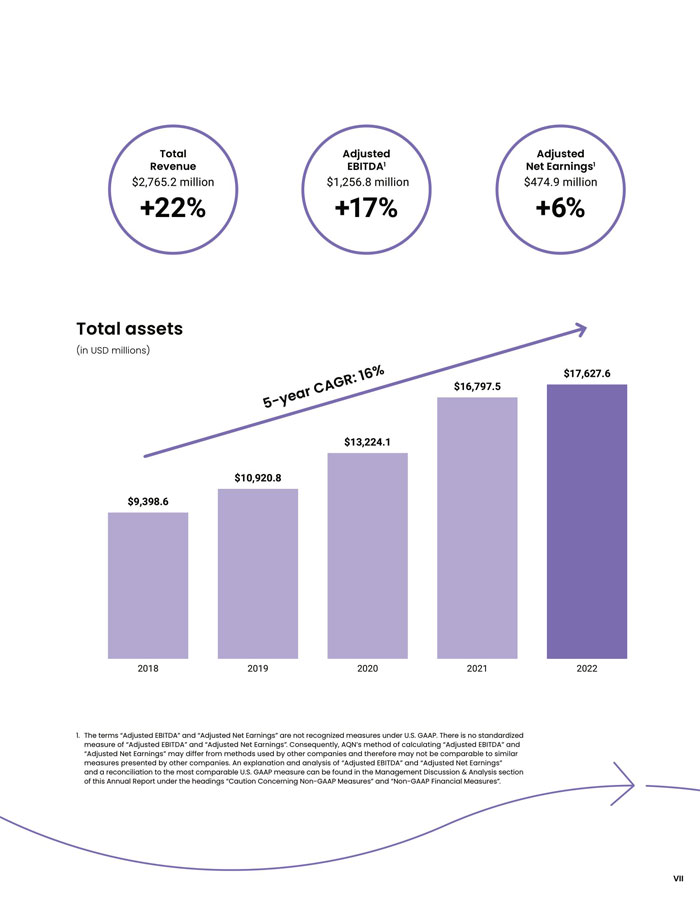
VII +17% Adjusted EBITDA1 $1,256.8 million +6% Adjusted Net Earnings1 $474.9 million +22% Total Revenue
$2,765.2 million Total assets (in USD millions) 2018 $9,398.6 2021 $16,797.5 2020 $13,224.1 2019 $10,920.8 2022 $17,627.6 1. The terms “Adjusted EBITDA” and “Adjusted Net Earnings” are not recognized measures under U.S. GAAP. There is no standardized
measure of “Adjusted EBITDA” and “Adjusted Net Earnings”. Consequently, AQN’s method of calculating “Adjusted EBITDA” and “Adjusted Net Earnings” may differ from methods used by other companies and therefore may not be comparable to similar measures
presented by other companies. An explanation and analysis of “Adjusted EBITDA” and “Adjusted Net Earnings” and a reconciliation to the most comparable U.S. GAAP measure can be found in the Management Discussion & Analysis section of this Annual
Report under the headings “Caution Concerning Non-GAAP Measures” and “Non-GAAP Financial Measures”. 5-year CAGR: 16%

Growth Pillar Pursuing long-term profitable growth Despite our recent commitment to reducing our
capital intensity, long-term profitable growth remains an important component of our strategy. In 2022, we successfully closed the New York Water transaction, and have now fully integrated the business into Liberty operations. Liberty New York Water
is a regulated water and wastewater utility serving approximately 127,000 customer connections across eight counties in southeastern New York state. On the renewable side, the Company completed its acquisition of Sandhill Advanced Biofuels, LLC
(“Sandhill”) in August 2022. Sandhill is a developer of RNG anaerobic digestion projects located on dairy farms with a portfolio of four projects in the state of Wisconsin. Two of the projects achieved commercial operation in August 2022. Once fully
constructed, the portfolio is expected to produce RNG at a rate of approximately 500 million British thermal units per day. The acquisition represents the Company’s first investment in the non-regulated RNG space. In 2022, the Company continued to
execute on its partnerships with commercial and industrial customers to help them achieve their corporate targets for cleaner energy. In the fourth quarter, site preparation commenced at the Carvers Creek Solar project, a 150 MW project in Virginia.
Additional advancements on renewable projects included the delivery and installation of wind turbines at our Deerfield II, Sandy Ridge II, and Shady Oaks II wind projects. We currently have over 600 MW of wind and solar projects in various stages of
construction. Finally, we ended the year with the announcement of our inaugural asset recycling transaction, in which we sold a 49% ownership interest in three operating wind facilities totaling 551 MW in the U.S. and an 80% ownership interest in the
175 MW operating Blue Hill Wind Facility in Saskatchewan to InfraRed Capital Partners. This announcement represents a meaningful step in achieving the asset recycling financing strategy described out at our 2021 Investor Day. ALGONQUIN | LIBERTY VIII
2022 Annual Report

IX

ALGONQUIN | LIBERTY X 2022 Annual Report
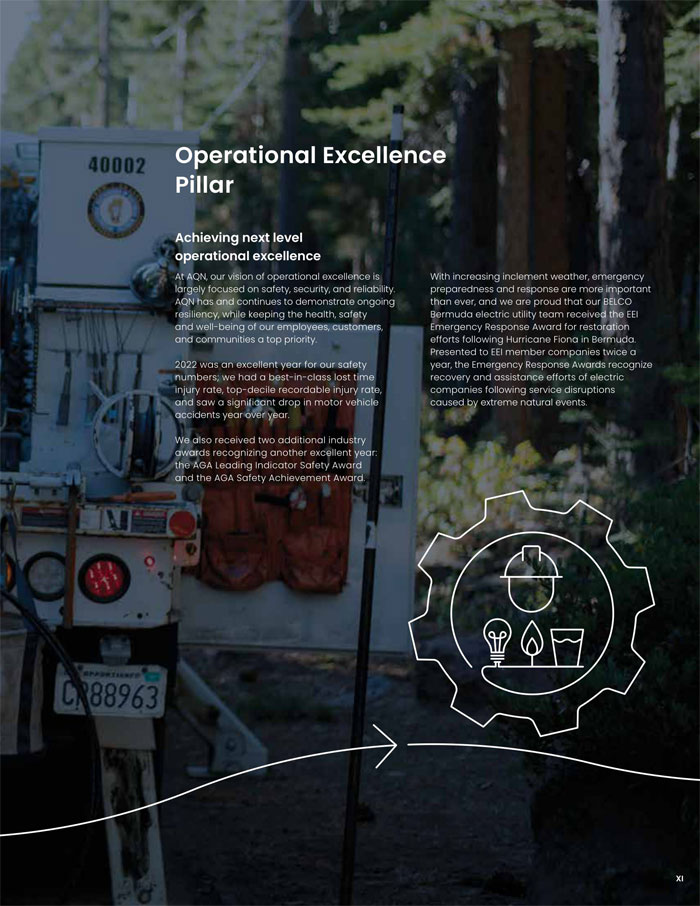
Operational Excellence Pillar Achieving next level operational excellence At AQN, our vision of
operational excellence is largely focused on safety, security, and reliability. AQN has and continues to demonstrate ongoing resiliency, while keeping the health, safety and well-being of our employees, customers, and communities a top priority. 2022
was an excellent year for our safety numbers; we had a best-in-class lost time injury rate, top-decile recordable injury rate, and saw a significant drop in motor vehicle accidents year over year. We also received two additional industry awards
recognizing another excellent year: the AGA Leading Indicator Safety Award and the AGA Safety Achievement Award. With increasing inclement weather, emergency preparedness and response are more important than ever, and we are proud that our BELCO
Bermuda electric utility team received the EEI Emergency Response Award for restoration efforts following Hurricane Fiona in Bermuda. Presented to EEI member companies twice a year, the Emergency Response Awards recognize recovery and assistance
efforts of electric companies following service disruptions caused by extreme natural events. XI

Sustainability Pillar Leader in sustainability With more than 30 years of experience developing and
operating renewable and clean energy facilities, sustainability has long been in AQN’s DNA and is part of the Company’s business strategy. We continue to include environmental, social, and governance (“ESG”) activities across our business and as part
of our key metrics. Our 2022 ESG report, published in the fourth quarter of 2022, included a more quantitative-focused approach to ESG across the enterprise. We also continued our journey to operationalizing net-zero by rolling out transition plans
across our top five emitting facilities and advancing work on our Task Force on Climate-Related Financial Disclosures risks for these. Our overall emissions intensity continues to trend downward. We also continue to make progress on our 2023 ESG
targets, including an 8% improvement towards our employee engagement target. We are pleased that our ESG efforts are being recognized, as evidenced by AQN’s inclusion in the Bloomberg Gender Equity Index for the fourth consecutive year and
recognition on the Globe and Mail’s 2022 Report on Business Women Lead Here list, an annual benchmark program that ranks Canadian companies on achieving or nearing gender parity in their executive ranks. Additionally, we were recently awarded the
Sustainable Markets Initiative’s Terra Carta Seal, in recognition of AQN’s commitment and leadership in sustainability. ALGONQUIN | LIBERTY XII 2022 Annual Report

Management Discussion & Analysis
Management of Algonquin Power & Utilities Corp. (“AQN” or the “Company” or the “Corporation”) has prepared the following discussion and analysis to provide
information to assist its shareholders’ understanding of the financial results for the three and twelve months ended December 31, 2022. This Management Discussion & Analysis (“MD&A”) should be read in conjunction with AQN’s annual consolidated
financial statements for the years ended December 31, 2022 and 2021. This material is available on SEDAR at www.sedar.com, on EDGAR at www.sec.gov/edgar, and on the AQN website at www.AlgonquinPowerandUtilities.com. Additional
information about AQN, including the most recent Annual Information Form (“AIF”), can be found on SEDAR at www.sedar.com and on EDGAR at www.sec.gov/edgar.
Unless otherwise indicated, financial information provided for the years ended December 31, 2022 and 2021 has been prepared in accordance with generally accepted
accounting principles in the United States (“U.S. GAAP”). As a result, the Company’s financial information may not be comparable with financial information of other Canadian companies that provide financial information on another basis.
All monetary amounts are in U.S. dollars, except where otherwise noted. We denote any amounts denominated in Canadian dollars with “C$” immediately prior to the stated
amount.
Capitalized terms used herein and not otherwise defined have the meanings assigned to them in the Company’s most recent AIF.
Unless noted otherwise, this MD&A is based on information available to management as of March 16, 2023.
Contents
| Management Discussion & Analysis |
1 |
Caution Concerning Forward-Looking Statements and Forward-Looking
Information
This document may contain statements that constitute “forward-looking information” within the meaning of applicable securities laws in each of the provinces and
territories of Canada and the respective policies, regulations and rules under such laws or “forward-looking statements” within the meaning of the U.S. Private Securities Litigation Reform Act of 1995 (collectively, “forward-looking information”). The
words “aims”, “anticipates”, “believes”, “budget”, “could”, “estimates”, “expects”, “forecasts”, “intends”, “may”, “might”, “plans”, “projects”, “schedule”, “should”, “will”, “would”, “seeks”, “strives”, “targets” (and grammatical variations of such
terms) and similar expressions are often intended to identify forward-looking information, although not all forward-looking information contains these identifying words. Specific forward-looking information in this document includes, but is not limited
to, statements relating to: expected future growth, earnings (including 2023 Adjusted Net Earnings per common share) and results of operations; liquidity, capital resources and operational requirements; sources of funding, including adequacy and
availability of credit facilities, cash flows from operations, capital markets financing, and asset recycling initiatives (including the 2023 Asset Recycling Plan (as defined herein)); expectations regarding the use of proceeds from financings; ongoing
and planned acquisitions, dispositions, projects, initiatives or other transactions, including expectations regarding timing, costs, financing, results, ownership structures, regulatory matters, in-service dates and completion dates; financing plans,
including the Company’s expectation that it will not undertake any new common equity financing through the end of 2024; expectations regarding future macroeconomic conditions; expectations regarding the anticipated closing of the Kentucky Power
Transaction (as defined herein); expectations regarding the purchase price for the Kentucky Power Transaction; expectations regarding the financial impacts of the flooding that occurred in Kentucky Power’s service territory in late July 2022;
expectations regarding financing of the Kentucky Power Transaction; expectations regarding the Company’s corporate development activities and the results thereof, including the expected business mix between the Regulated Services Group and Renewable
Energy Group; expectations regarding regulatory hearings, motions, filings, appeals and approvals, including rate reviews, and the timing, impacts and outcomes thereof; expected future generation, capacity and production of the Company’s energy
facilities; expectations regarding future capital investments, including expected timing, investment plans, sources of funds and impacts; joint ventures; expectations regarding the outcome of legal claims and disputes; strategy and goals; dividends to
shareholders, including expectations regarding the sustainability thereof and the Company’s ability to achieve its targeted annual dividend payout ratio; expectations regarding future “greening the fleet” initiatives, including with respect to Kentucky
Power; credit ratings and equity credit from rating agencies; expectations regarding debt repayment and refinancing; the future impact on the Company of actual or proposed laws, regulations and rules; the expected impact of changes in customer usage on
the Regulated Services Group’s revenue; accounting estimates; interest rates, including the anticipated effect of an increase thereof; the implementation of new technology systems and infrastructure, including the expected timing thereof; financing
costs; and currency exchange rates. All forward-looking information is given pursuant to the “safe harbour” provisions of applicable securities legislation.
The forecasts and projections that make up the forward-looking information contained herein are based on certain factors or assumptions which include, but are not
limited to: the receipt of applicable regulatory approvals and requested rate decisions; the absence of a material increase in the costs of compliance with environmental laws following the completion of the Kentucky Power Transaction; the absence of
material adverse regulatory decisions being received and the expectation of regulatory stability; the absence of any material equipment breakdown or failure; availability of financing (including tax equity financing and self-monetization transactions
for U.S. federal tax credits) on commercially reasonable terms and the stability of credit ratings of the Corporation and its subsidiaries; the absence of unexpected material liabilities or uninsured losses; the continued availability of commodity
supplies and stability of commodity prices; the absence of interest rate increases or significant currency exchange rate fluctuations; the absence of significant operational, financial or supply chain disruptions or liability, including relating to
import controls and tariffs; the continued ability to maintain systems and facilities to ensure their continued performance; the absence of a severe and prolonged downturn in general economic, credit, social or market conditions; the successful and
timely development and construction of new projects; the closing of pending acquisitions substantially in accordance with the expected timing for such acquisitions; the absence of capital project or financing cost overruns; sufficient liquidity and
capital resources; the continuation of long term weather patterns and trends; the absence of significant counterparty defaults; the continued competitiveness of electricity pricing when compared with alternative sources of energy; the realization of
the anticipated benefits of the Corporation’s acquisitions and joint ventures; the absence of a change in applicable laws, political conditions, public policies and directions by governments, materially negatively affecting the Corporation; the ability
to obtain and maintain licenses and permits; maintenance of adequate insurance coverage; the absence of material fluctuations in market energy prices; the absence of material disputes with taxation authorities or changes to applicable tax laws;
continued maintenance of information technology infrastructure and the absence of a material breach of cybersecurity; the successful implementation of new information technology systems and infrastructure; favourable relations with external
stakeholders; favourable labour relations; the realization of the anticipated benefits of the Kentucky Power Transaction, including that it will be accretive to the Corporation’s Adjusted Net Earnings per common share; that the Corporation will be able
to successfully integrate newly acquired entities, and the absence of any material adverse changes to such entities prior to closing; the successful transfer of operational control over the Mitchell Plant (as defined herein) to Wheeling Power
| 2 |
ALGONQUIN | LIBERTY
2022 Annual Report
|
Company; the Mitchell Plant being transferred or retired in accordance with the Corporation’s expectations; the absence of undisclosed liabilities of entities being
acquired; that such entities will maintain constructive regulatory relationships with state regulatory authorities; the ability of the Corporation to retain key personnel of acquired entities and the value of such employees; no adverse developments in
the business and affairs of the sellers during the period when transitional services are provided to the Corporation in connection with any acquisition; the ability of the Corporation to satisfy its liabilities and meet its debt service obligations
following completion of any acquisition; the absence of any reputational harm to the Corporation as a result of any acquisition; and the ability of the Corporation to successfully execute future “greening the fleet” initiatives.
The forward-looking information contained herein is subject to risks, uncertainties and other factors that could cause actual results to differ materially from
historical results or results anticipated by the forward-looking information. Factors which could cause results or events to differ materially from current expectations include, but are not limited to: changes in general economic, credit, social or
market conditions; changes in customer energy usage patterns and energy demand; reductions in the liquidity of energy markets; global climate change; the incurrence of environmental liabilities; natural disasters, diseases, pandemics, public health
emergencies and other force majeure events; critical equipment breakdown or failure; supply chain disruptions; the imposition of import controls or tariffs; the failure of information technology infrastructure and other cybersecurity measures to
protect against data, privacy and cybersecurity breaches; failure to successfully implement, and cost overruns and delays in connection with, new information technology systems and infrastructure; physical security breach; the loss of key personnel
and/or labour disruptions; seasonal fluctuations and variability in weather conditions and natural resource availability; reductions in demand for electricity, natural gas and water due to developments in technology; reliance on transmission systems
owned and operated by third parties; issues arising with respect to land use rights and access to the Corporation’s facilities; terrorist attacks; fluctuations in commodity and energy prices; capital expenditures; reliance on subsidiaries; the
incurrence of an uninsured loss; a credit rating downgrade; an increase in financing costs or limits on access to credit and capital markets; significant inflation; increases and fluctuations in interest rates and failure to manage exposure to credit
and financial instrument risk; currency exchange rate fluctuations; restricted financial flexibility due to covenants in existing credit agreements; an inability to refinance maturing debt on favourable terms; disputes with taxation authorities or
changes to applicable tax laws; failure to identify, acquire, develop or timely place in service projects to maximize the value of tax credits; requirement for greater than expected contributions to post-employment benefit plans; default by a
counterparty; inaccurate assumptions, judgments and/or estimates with respect to asset retirement obligations; failure to maintain required regulatory authorizations; changes in, or failure to comply with, applicable laws and regulations; failure of
compliance programs; failure to identify attractive acquisition or development candidates necessary to pursue the Corporation’s growth strategy; failure to dispose of assets (at all or at a competitive price) to fund the Company’s operations and growth
plans; delays and cost overruns in the design and construction of projects, including as a result of COVID-19; loss of key customers; failure to complete or realize the anticipated benefits of acquisitions or joint ventures; Atlantica (as defined
herein) or a third party joint venture partner acting in a manner contrary to the Corporation’s interests; a drop in the market value of Atlantica’s ordinary shares; facilities being condemned or otherwise taken by governmental entities; increased
external stakeholder activism adverse to the Corporation’s interests; fluctuations in the price and liquidity of the Corporation’s common shares and the Corporation’s other securities; the severity and duration of the COVID-19 pandemic, including the
potential resurgence of COVID-19 and/ or new strains of COVID-19, and collateral consequences thereof, including the disruption of economic activity, volatility in capital and credit markets and legislative and regulatory responses; impact of
significant demands placed on the Corporation as a result of pending acquisitions or growth strategies; potential undisclosed liabilities of any entities being acquired by the Corporation; uncertainty regarding the length of time required to complete
pending acquisitions; the failure to implement the Corporation’s strategic objectives or achieve expected benefits relating to acquisitions; Kentucky Power’s failure to receive regulatory approval for the construction of new renewable generation
facilities; indebtedness of any entity being acquired by the Corporation; reputational harm and increased costs of compliance with environmental laws as a result of announced or completed acquisitions; unanticipated expenses and/or cash payments as a
result of change of control and/or termination for convenience provisions in agreements to which any entity being acquired is a party; and the reliance on third parties for certain transitional services following the completion of an acquisition.
Although the Corporation has attempted to identify important factors that could cause actual actions, events or results to differ materially from those described in forward-looking information, there may be other factors that cause actions, events or
results not to be as anticipated, estimated or intended. Some of these and other factors are discussed in more detail under the heading Enterprise Risk Management in this MD&A and under the heading Enterprise Risk Factors in the Corporation’s most
recent AIF.
Forward-looking information contained herein (including any financial outlook) is provided for the purposes of assisting the reader in understanding the Corporation
and its business, operations, risks, financial performance, financial position and cash flows as at and for the periods indicated and to present information about management’s current expectations and plans relating to the future, and the reader is
cautioned that such information may not be appropriate for other purposes. Forward-looking information contained herein is made as of the date of this document and based on the plans, beliefs, estimates, projections, expectations, opinions and
assumptions of management on the date hereof. There can be no
| Management Discussion & Analysis |
3 |
assurance that forward-looking information will prove to be accurate, as actual results and future events could differ materially from those anticipated in such
forward-looking information. Accordingly, readers should not place undue reliance on forward-looking information. While subsequent events and developments may cause the Corporation’s views to change, the Corporation disclaims any obligation to update
any forward-looking information or to explain any material difference between subsequent actual events and such forward-looking information, except to the extent required by applicable law. All forward-looking information contained herein is qualified
by these cautionary statements.
Caution Concerning Non-GAAP Measures
AQN uses a number of financial measures to assess the performance of its business lines. Some measures are calculated in accordance with U.S. GAAP, while other
measures do not have a standardized meaning under U.S. GAAP. These non-GAAP measures include non-GAAP financial measures and non-GAAP ratios, each as defined in Canadian National Instrument 52-112 Non-GAAP and Other Financial Measures Disclosure.
AQN’s method of calculating these measures may differ from methods used by other companies and therefore may not be comparable to similar measures presented by other companies.
The terms “Adjusted Net Earnings”, “Adjusted Earnings Before Interest, Taxes, Depreciation and Amortization” (“Adjusted EBITDA”), “Adjusted Funds from Operations”,
“Net Energy Sales”, “Net Utility Sales” and “Divisional Operating Profit”, which are used throughout this MD&A, are non-GAAP financial measures. An explanation of each of these non-GAAP financial measures is set out below and a reconciliation to
the most directly comparable U.S. GAAP measure, in each case, can be found in this MD&A. In addition, “Adjusted Net Earnings” is presented throughout this MD&A on a per common share basis. Adjusted Net Earnings per common share is a non-GAAP
ratio and is calculated by dividing Adjusted Net Earnings by the weighted average number of common shares outstanding during the applicable period.
AQN does not provide reconciliations for forward-looking non-GAAP financial measures as AQN is unable to provide a meaningful or accurate calculation or estimation of
reconciling items and the information is not available without unreasonable effort. This is due to the inherent difficulty of forecasting the timing or amount of various events that have not yet occurred, are out of AQN’s control and/or cannot be
reasonably predicted, and that would impact the most directly comparable forward-looking U.S. GAAP financial measure. For these same reasons, AQN is unable to address the probable significance of the unavailable information. Forward-looking non-GAAP
financial measures may vary materially from the corresponding U.S. GAAP financial measures.
Adjusted EBITDA
Adjusted EBITDA is a non-GAAP financial measure used by many investors to compare companies on the basis of ability to generate cash from operations. AQN uses these
calculations to monitor the amount of cash generated by AQN. AQN uses Adjusted EBITDA to assess the operating performance of AQN without the effects of (as applicable): depreciation and amortization expense, income tax expense or recoveries,
acquisition and transition costs, certain litigation expenses, interest expense, gain or loss on derivative financial instruments, write down of intangibles and property, plant and equipment, earnings attributable to non-controlling interests,
non-service pension and post-employment costs, cost related to tax equity financing, costs related to management succession and executive retirement, costs related to prior period adjustments due to changes in tax law, costs related to condemnation
proceedings, financial impacts on the Company’s Senate Wind Facility from the significantly elevated pricing that persisted in the Electric Reliability Council of Texas (“ERCOT”) market over several days (the “Market Disruption Event”) as a result of
the February 2021 extreme winter storm conditions experienced in Texas and parts of the central U.S. (the “Midwest Extreme Weather Event”), gain or loss on foreign exchange, earnings or loss from discontinued operations, changes in value of investments
carried at fair value, and other typically non-recurring or unusual items. AQN adjusts for these factors as they may be non-cash, unusual in nature and are not factors used by management for evaluating the operating performance of the Company. AQN
believes that presentation of this measure will enhance an investor’s understanding of AQN’s operating performance. Adjusted EBITDA is not intended to be representative of cash provided by operating activities or results of operations determined in
accordance with U.S. GAAP, and can be impacted positively or negatively by these items. For a reconciliation of Adjusted EBITDA to net earnings, see Non-GAAP Financial Measures starting on page 36 of this MD&A.
Adjusted Net Earnings
Adjusted Net Earnings is a non-GAAP financial measure used by many investors to compare net earnings from operations without the effects of certain volatile primarily
non-cash items that generally have no current economic impact or items such as acquisition expenses or certain litigation expenses that are viewed as not directly related to a company’s operating performance. AQN uses Adjusted Net Earnings to assess
its performance without the effects of (as applicable): gains or losses on foreign exchange, foreign exchange forward contracts, interest rate swaps, acquisition and transition costs, one-time costs of arranging tax equity financing, certain litigation
expenses and write down of intangibles and property, plant and equipment, earnings or loss from discontinued operations (excluding sale of assets in the course of normal operations), unrealized mark-to-market revaluation impacts (other than those
realized in connection with the sales of development assets), costs related to management succession and executive retirement, costs related to prior period adjustments due to changes in tax law, costs related to condemnation proceedings, financial
impacts from the Market Disruption Event on the
| 4 |
ALGONQUIN | LIBERTY
2022 Annual Report
|
Company’s Senate Wind Facility, changes in value of investments carried at fair value, and other typically non-recurring or unusual items as these are not reflective
of the performance of the underlying business of AQN. AQN believes that analysis and presentation of net earnings or loss on this basis will enhance an investor’s understanding of the operating performance of its businesses. Adjusted Net Earnings is
not intended to be representative of net earnings or loss determined in accordance with U.S. GAAP, and can be impacted positively or negatively by these items. For a reconciliation of Adjusted Net Earnings to net earnings, see Non-GAAP Financial
Measures starting on page 37 of this MD&A.
Adjusted Funds from Operations
Adjusted Funds from Operations is a non-GAAP financial measure used by investors to compare cash provided by operating activities without the effects of certain
volatile items that generally have no current economic impact or items such as acquisition expenses that are viewed as not directly related to a company’s operating performance. AQN uses Adjusted Funds from Operations to assess its performance without
the effects of (as applicable): changes in working capital balances, acquisition and transition costs, certain litigation expenses, cash provided by or used in discontinued operations, financial impacts from the Market Disruption Event on the Company’s
Senate Wind Facility, and other typically non- recurring items affecting cash from operations as these are not reflective of the long-term performance of the underlying businesses of AQN. AQN believes that analysis and presentation of funds from
operations on this basis will enhance an investor’s understanding of the operating performance of its businesses. Adjusted Funds from Operations is not intended to be representative of cash provided by operating activities as determined in accordance
with U.S. GAAP, and can be impacted positively or negatively by these items. For a reconciliation of Adjusted Funds from Operations to cash provided by operating activities, see Non-GAAP Financial Measures starting on page 38 of this MD&A.
Net Energy Sales
Net Energy Sales is a non-GAAP financial measure used by investors to identify revenue after commodity costs used to generate revenue where such revenue generally
increases or decreases in response to increases or decreases in the cost of the commodity used to produce that revenue. AQN uses Net Energy Sales to assess its revenues without the effects of fluctuating commodity costs as such costs are predominantly
passed through either directly or indirectly in the rates that are charged to customers. AQN believes that analysis and presentation of Net Energy Sales on this basis will enhance an investor’s understanding of the revenue generation of the Renewable
Energy Group. It is not intended to be representative of revenue as determined in accordance with U.S. GAAP. For a reconciliation of Net Energy Sales to revenue, see Renewable Energy Group - 2022 Renewable Energy Group Operating Results on page
31 of this MD&A.
Net Utility Sales
Net Utility Sales is a non-GAAP financial measure used by investors to identify utility revenue after commodity costs, either natural gas or electricity, where these
commodity costs are generally included as a pass through in rates to its utility customers. AQN uses Net Utility Sales to assess its utility revenues without the effects of fluctuating commodity costs as such costs are predominantly passed through and
paid for by utility customers. AQN believes that analysis and presentation of Net Utility Sales on this basis will enhance an investor’s understanding of the revenue generation of the Regulated Services Group. It is not intended to be representative of
revenue as determined in accordance with U.S. GAAP. For a reconciliation of Net Utility Sales to revenue, see Regulated Services Group - 2022 Regulated Services Group Operating Results on page 21 of this MD&A.
Divisional Operating Profit
Divisional Operating Profit is a non-GAAP financial measure. AQN uses Divisional Operating Profit to assess the operating performance of its business groups without
the effects of (as applicable): depreciation and amortization expense, corporate administrative expenses, income tax expense or recoveries, acquisition costs, certain litigation expenses, interest expense, gain or loss on derivative financial
instruments, write down of intangibles and property, plant and equipment, gain or loss on foreign exchange, earnings or loss from discontinued operations (excluding the sale of assets in the course of normal operations), non-service pension and
post-employment costs, financial impacts from the Market Disruption Event on the Company’s Senate Wind Facility, and other typically non-recurring or unusual items. AQN adjusts for these factors as they may be non-cash, unusual in nature and are not
factors used by management for evaluating the operating performance of the divisional units. Divisional Operating Profit is calculated inclusive of interest, dividend and equity income earned from indirect investments, and Hypothetical Liquidation at
Book Value (“HLBV”) income, which represents the value of net tax attributes earned in the period from electricity generated by certain of its U.S. wind power and U.S. solar generation facilities. AQN believes that presentation of this measure will
enhance an investor’s understanding of AQN’s divisional operating performance. Divisional Operating Profit is not intended to be representative of cash provided by operating activities or results of operations determined in accordance with U.S. GAAP,
and can be impacted positively or negatively by these items. For a reconciliation of Divisional Operating Profit to revenue for AQN’s main business units, see Regulated Services Group - 2022 Regulated Services Group Operating Results on page
21 and Renewable Energy Group - 2022 Renewable Energy Group Operating Results on page 31 of this MD&A.
| Management Discussion & Analysis |
5 |
Overview and Business Strategy
AQN is incorporated under the Canada Business Corporations Act. AQN owns and operates a diversified portfolio of regulated and non-regulated generation, distribution,
and transmission assets which are expected to deliver predictable earnings and cash flows. AQN seeks to maximize total shareholder value through new investments in renewable power generating facilities, regulated utilities and other complementary
infrastructure projects, supported by the Company’s focus on operational excellence and sustainability. Through these activities, the Company aims to drive growth in earnings and cash flows to support a sustainable dividend and share price
appreciation. AQN strives to achieve these results while also seeking to maintain a business risk profile consistent with its BBB flat investment grade credit ratings and a strong focus on Environmental, Social and Governance factors.
In light of the current macroenvironment, including elevated interest and inflation rates, as well as Company specific challenges and the Company’s desire to
effectively allocate capital and drive value creation for shareholders, the Company has reset the quarterly dividend to shareholders to $0.1085 per common share, or $0.4340 per common share on an annualized basis. AQN believes that, on a long-term
basis, its targeted annual dividend payout will allow for both a return on investment for shareholders and retention of cash within AQN to partially fund growth opportunities. Changes in the level of dividends paid by AQN are at the discretion of AQN’s
Board of Directors (the “Board”), with dividend levels being reviewed periodically by the Board in the context of AQN’s financial performance and growth prospects.
In addition, the Company has announced that it is targeting approximately $1 billion of asset sales (the “2023 Asset Recycling Plan”) and that no new common equity
financings are expected through the end of 2024.
AQN’s operations are organized across two primary business units consisting of: the Regulated Services Group, which primarily owns and operates a portfolio of
regulated assets in the United States, Canada, Bermuda and Chile; and the Renewable Energy Group, which primarily operates a diversified portfolio of owned renewable generation assets.
AQN pursues investment opportunities with an objective of maintaining the current business mix between its Regulated Services Group and Renewable Energy Group and with
leverage consistent with its current credit ratings.1 The business mix target may from time to time require AQN to grow its Regulated Services Group or implement other
strategies in order to pursue investment opportunities within its Renewable Energy Group.
The Company also undertakes business development activities for both business units, primarily in North America, working to identify, develop, acquire, invest in, or
divest of renewable energy facilities, regulated utilities and other complementary infrastructure projects.
Summary Structure of the Business
The following chart depicts, in summary form, AQN’s key businesses. A more detailed description of AQN’s organizational structure can be found in the most recent AIF.
1 See Treasury Risk Management
-Downgrade in the Company’s Credit Rating Risk.
| 6 |
ALGONQUIN | LIBERTY
2022 Annual Report
|
Regulated Services Group
The Regulated Services Group operates a diversified portfolio of regulated utility systems located in the United States, Canada, Bermuda and Chile serving
approximately 1,244,000 customer connections as at December 31, 2022 (using an average of 2.5 customers per connection, this translates into approximately 3,110,000 customers). The Regulated Services Group seeks to provide safe, high quality, and
reliable services to its customers and to deliver stable and predictable earnings to AQN. In addition to encouraging and supporting organic growth within its service territories, the Regulated Services Group seeks to deliver long-term growth through
accretive acquisitions of additional utility systems and pursuing “greening the fleet” opportunities.
The Regulated Services Group’s regulated electrical distribution utility systems and related generation assets are located in the U.S. States of California, New
Hampshire, Missouri, Kansas, Oklahoma, and Arkansas, as well as in Bermuda, which together served approximately 309,000 electric customer connections as at December 31, 2022. The group also owns and operates generating assets with a gross capacity of
approximately 2.0 GW and has investments in generating assets with approximately 0.3 GW of net generation capacity.
The Regulated Services Group’s regulated water distribution and wastewater collection utility systems are located in the U.S. States of Arizona, Arkansas, California,
Illinois, Missouri, New York, and Texas as well as in Chile which together served approximately 560,000 customer connections as at December 31, 2022.
The Regulated Services Group’s regulated natural gas distribution utility systems are located in the U.S. States of Georgia, Illinois, Iowa, Massachusetts, New
Hampshire, Missouri, and New York, and in the Canadian Province of New Brunswick, which together served approximately 375,000 natural gas customer connections as at December 31, 2022.
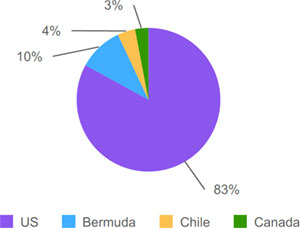
Below is a breakdown of the Regulated Services Group’s Revenue by geographic area for the twelve months ended December 31, 2022.
Regulated Revenue by Geographic Area
| Management Discussion & Analysis |
7 |
Renewable Energy Group
The Renewable Energy Group generates and sells electrical energy produced by its diverse portfolio of renewable power generation and clean power generation facilities
primarily located across the United States and Canada. The Renewable Energy Group seeks to deliver growth through new power generation projects and complementary projects, such as energy storage.
The Renewable Energy Group operates, and directly owns interests in hydroelectric, wind, solar, renewable natural gas (“RNG”) and thermal facilities with a combined
gross generating capacity of approximately 2.5 GW and a net generating capacity (attributable to the Renewable Energy Group) of approximately 2.1 GW. Approximately 81% of the electrical output is sold pursuant to long term contractual arrangements
which as of December 31, 2022 had a production-weighted average remaining contract life of approximately 11 years (see Market Price Risk).
In addition to the assets that the Renewable Energy Group operates, the Renewable Energy Group has investments in generating assets with approximately 1.4 GW of net
generating capacity, which includes the Company’s 51% interest in the Texas Coastal Wind Facilities (as defined herein) and approximately 42% interest in Atlantica Sustainable Infrastructure plc (“Atlantica”). Atlantica owns and operates a portfolio of
international clean energy and water infrastructure assets under long term contracts with a Cash Available for Distribution weighted average remaining contract life of approximately 14 years as of December 31, 2022.
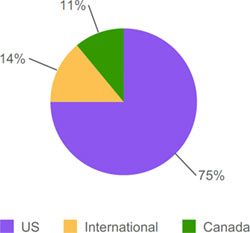
Below is a breakdown of the Renewable Energy Group’s generating capacity by geographic area as of December 31, 2022, which was comprised of net generating capacity of
facilities owned and operated and net generating capacity of investments, including the Company’s 51% interest in the Texas Coastal Wind Facilities and approximately 42% interest in Atlantica.
Renewable Generation by Geographic Area
| 8 |
ALGONQUIN | LIBERTY
2022 Annual Report
|
Significant Updates
Operating Results
AQN operating results relative to the same period last year are as follows:
| |
Three months ended |
Twelve months ended |
| |
December 31 |
December 31 |
| (all dollar amounts in $ millions except per share
information) |
2022 |
2021 |
Change |
2022 |
2021 |
Change |
| Net earnings (loss) attributable to shareholders |
$(74.4) |
$175.6 |
(142)% |
$(212.0) |
$264.9 |
(180)% |
| Adjusted Net Earnings1 |
$151.0 |
$137.0 |
10% |
$474.9 |
$449.0 |
6% |
| Adjusted EBITDA1 |
$358.3 |
$298.3 |
20% |
$1,256.8 |
$1,076.3 |
17% |
| Net earnings (loss) per common share |
$(0.11) |
$0.27 |
(141)% |
$(0.33) |
$0.41 |
(180)% |
| Adjusted Net Earnings per common share1 |
$0.22 |
$0.21 |
5% |
$0.69 |
$0.71 |
(3)% |
| 1 |
See Caution Concerning Non-GAAP Measures. |
Declaration of 2023 First Quarter Dividend of $0.1085 (C$0.1495) per Common Share
AQN currently targets annual growth in dividends payable to shareholders
underpinned by increases in earnings and cash flow.
The Board has declared a first quarter 2023 dividend of $0.1085 per common
share payable on April 14, 2023 to shareholders of record on March 31, 2023.
The Canadian dollar equivalent for the first quarter 2023 dividend is C$0.1495 per common share.
The previous four quarter U.S. and Canadian dollar equivalent dividends per common share have been
as follows:
| |
|
Q2 2022 |
|
Q3 2022 |
|
Q4 2022 |
|
Q1 2023 |
Total |
| U.S. dollar dividend |
$ |
0.1808 |
$ |
0.1808 |
$ |
0.1808 |
$ |
0.1085 |
$0.6509 |
| Canadian dollar equivalent |
$ |
0.2345 |
$ |
0.2312 |
$ |
0.2438 |
$ |
0.1495 |
$0.8590 |
Pending Acquisition of Kentucky Power Company and AEP Kentucky Transmission Company, Inc.
On October 26, 2021, Liberty Utilities Co. (“Liberty Utilities”), an indirect
subsidiary of AQN, entered into an agreement (“the Kentucky Acquisition Agreement”) with American Electric Power Company, Inc. (“AEP”) and AEP Transmission Company, LLC (“AEP Transmission”) to acquire Kentucky Power Company (“Kentucky Power”) and AEP
Kentucky Transmission Company, Inc. (“Kentucky TransCo”) for a total purchase price of approximately $2.846 billion, including the assumption of approximately $1.221 billion in debt (the “Kentucky Power Transaction”). On September 29, 2022, the
parties entered into an amendment to the Kentucky Acquisition Agreement that, among other things, reduces the purchase price by $200 million to approximately $2.646 billion, including the assumption of approximately $1.221 billion in debt.
Kentucky Power is a state rate-regulated electricity generation, distribution
and transmission utility serving customers in 20 eastern Kentucky counties and operating under a cost of service framework. Kentucky TransCo is an electricity transmission business operating in the Kentucky portion of the transmission infrastructure
that is part of the Pennsylvania – New Jersey – Maryland regional transmission organization, PJM Interconnection, L.L.C. Kentucky Power and Kentucky TransCo are both regulated by the U.S. Federal Energy Regulatory Commission (“FERC”).
Closing of the Kentucky Power Transaction remains subject to the satisfaction
or waiver of certain conditions precedent, which include the approval of the Kentucky Power Transaction by FERC and clearance pursuant to the Hart-Scott-Rodino Antitrust Improvements Act of 1976 (as the clearance received previously has now lapsed).
On December 15, 2022, FERC issued an order denying, without prejudice, authorization for the proposed transaction. On February 14, 2023, a new application was filed with FERC for approval of the Kentucky Power Transaction. If the Kentucky Power
Transaction has not closed by April 26, 2023, either party may, if certain requirements are met, terminate the Kentucky Acquisition Agreement in accordance with its terms.
Inaugural Asset Recycling Transaction
On December 29, 2022, the Company closed the previously-announced sale of
ownership interests in a portfolio of operating wind facilities in the United States and Canada to InfraRed Capital Partners, an international infrastructure investment manager that is part of SLC Management, the institutional alternatives and
traditional asset management business of Sun Life Financial Inc. (the “Disposition Transaction”). The Disposition Transaction consisted of the sale of (1) a 49% ownership interest in three operating wind facilities in the United States totaling 551
MW of installed capacity: the Odell Wind Facility in Minnesota, the Deerfield Wind Facility in Michigan, and the Sugar Creek Wind Facility in Illinois; and
| Management Discussion & Analysis |
9 |
(2) an 80% ownership interest in the operating 175 MW Blue Hill Wind Facility
in Saskatchewan. Total cash proceeds to the Company were approximately $277.5 million for the U.S. facilities and approximately C$108.6 million for the Blue Hill Wind Facility (subject to certain potential future post-closing adjustments). A gain on
disposition of $62.8 million was recognized and included in gain on sale of renewable assets on the Company’s consolidated statement of operations. The Company will continue to oversee day-to-day operations and provide management services to the
facilities.
Issuance of approximately $1.1 Billion of Subordinated Notes
On January 18, 2022, the Company closed (i) an underwritten public offering in
the United States (the “U.S. Note Offering”) of $750 million aggregate principal amount of 4.75% fixed-to-fixed reset rate junior subordinated notes series 2022-B due January 18, 2082 (the “U.S. Notes”); and (ii) an underwritten public offering in
Canada (the “Canadian Note Offering” and, together with the U.S. Note Offering, the “Note Offerings”) of C$400 million aggregate principal amount of 5.25% fixed-to-fixed reset rate junior subordinated notes series 2022-A due January 18, 2082 (the
“Canadian Notes” and, together with the U.S. Notes, the “Notes”). The Company intends to use the net proceeds of the Note Offerings to partially finance the Kentucky Power Transaction, provided that, in the short-term, prior to closing of the
Kentucky Power Transaction, the Company has used such net proceeds to repay certain indebtedness of the Corporation and its subsidiaries. As a result, the Company expects to draw from the credit facilities of the Company and certain of its
subsidiaries in connection with the closing of the Kentucky Power Transaction. Concurrent with the pricing of the Note Offerings, the Company entered into a cross currency interest rate swap, to convert the Canadian dollar denominated proceeds from
the Canadian Note Offering into U.S. dollars and a forward starting swap to fix the interest rate for the second five year term of the U.S. Notes, resulting in an anticipated effective interest rate to the Company of approximately 4.95% throughout
the first ten year period of the Notes.
Acquisition of Liberty NY Water (formerly New York American Water Company, Inc.)
Effective January 1, 2022, Liberty Utilities (Eastern Water Holdings) Corp., a
wholly-owned subsidiary of Liberty Utilities, closed the acquisition of Liberty Utilities (New York Water) Corp. (formerly New York American Water Company Inc.) (“Liberty NY Water”) from American Water Works Company, Inc. for a purchase price of
approximately $609 million. Headquartered in Merrick, NY, Liberty NY Water is a regulated water and wastewater utility serving approximately 127,000 customer connections across eight counties in southeastern New York. Liberty NY Water’s operations
include approximately 1,270 miles of water mains and distribution lines, with 98% of customers located in Nassau County on Long Island. The Company has incorporated the operations of Liberty NY Water into its East Region.
Outlook
The following discussion should be read in conjunction with the Caution
Concerning Forward-Looking Statements and Forward-Looking Information section in this MD&A. Actual results may differ materially from the estimates below. Accordingly, investors are cautioned not to place undue reliance on these estimates.
Estimated 2023 Adjusted Net Earnings Per Common Share
The Company estimates that its Adjusted Net Earnings per common share for the
2023 fiscal year will be within a range of $0.55-$0.61 (see Caution Concerning Non-GAAP Measures). Estimated 2023 Adjusted Net Earnings per common share is calculated excluding the impact of gains and losses from asset dispositions, but is otherwise
calculated in a manner consistent with the description set out under Caution Concerning Non-GAAP Measures - Adjusted Net Earnings.
The Company’s 2023 Adjusted Net Earnings per common share estimate is based on
the following key assumptions, as well as those set out under Caution Concerning Forward-Looking Statements and Forward-Looking Information:
|
● |
normalized weather patterns in the geographical areas in which the Company operates or has projects; |
|
● |
renewable energy production consistent with long-term average and realized pricing in line with expectations; |
|
● |
capital projects, including renewable energy generation projects, being completed on time and
substantially in line with budgeted costs; |
|
● |
the absence of significant changes in the macroeconomic environment, including with respect to
interest rates and inflation; |
|
● |
rate decisions in line with expectations; |
|
● |
closing of the Kentucky Power Transaction in late April 2023; |
|
● |
a Canadian dollar/U.S. dollar exchange rate and a Chilean Peso/U.S. dollar exchange rate in line with expectations; |
|
● |
operating expense savings in line with expectations; |
|
● |
a low single-digit percent effective tax rate, including tax credits and excluding an expected
one-time 2017 tax reform adjustment related primarily to the Kentucky Power Transaction; and |
|
● |
timing of the close of the 2023 Asset Recycling Plan in line with expectations. |
Capital Investment Expectations
Assuming closing of the $2.646 billion Kentucky Power Transaction, the Company
anticipates making capital investments of approximately $3.6 billion in 2023. See Summary of Property, Plant and Equipment Expenditures for a more detailed discussion of the Company’s 2023 capital investment estimates.
In light of the current macroenvironment, including elevated interest and
inflation rates, as well as Company specific challenges and the Company’s desire to effectively allocate capital, the Company expects reduced capital intensity from the Company’s previously-disclosed expectation of $12.4 billion in capital
investments for the period from 2022 through the end of 2026.
| Management Discussion & Analysis |
11 |
2022 Fourth Quarter Results From Operations
| Key Financial Information |
|
Three months ended December 31 |
|
| (all dollar amounts in $ millions except per share information) |
|
2022 |
|
|
2021 |
|
| Revenue |
|
$ |
748.0 |
|
|
$ |
592.0 |
|
| Net earnings (loss) attributable to shareholders |
|
|
(74.4 |
) |
|
|
175.6 |
|
| Cash provided by operating activities |
|
|
214.6 |
|
|
|
126.5 |
|
| Adjusted Net Earnings1 |
|
|
151.0 |
|
|
|
137.0 |
|
| Adjusted EBITDA1 |
|
|
358.3 |
|
|
|
298.3 |
|
| Adjusted Funds from Operations1 |
|
|
258.4 |
|
|
|
221.2 |
|
| Dividends declared to common shareholders |
|
|
123.7 |
|
|
|
115.5 |
|
| Weighted average number of common shares outstanding |
|
|
683,281,170 |
|
|
|
653,728,621 |
|
| Per share |
|
|
|
|
|
|
|
|
| Basic net earnings (loss) |
|
$ |
(0.11 |
) |
|
$ |
0.27 |
|
| Diluted net earnings (loss) |
|
$ |
(0.11 |
) |
|
$ |
0.26 |
|
| Adjusted Net Earnings1 |
|
$ |
0.22 |
|
|
$ |
0.21 |
|
| Dividends declared to common shareholders |
|
$ |
0.18 |
|
|
$ |
0.17 |
|
| 1 |
See Caution Concerning Non-GAAP Measures. |
For the three months ended December 31, 2022, AQN reported a basic net loss
per common share of $0.11 as compared to basic net earnings per common share of $0.27 during the same period in 2021, a decrease of $0.38. This loss was primarily driven by the change in value of investments carried at fair value of $75.7 million
primarily related to the Company’s investment in Atlantica, and non-cash losses on asset impairment charges of $159.6 million, mainly on the Senate Wind Facility (which began commercial operations in 2012) due to declining forecasted energy prices in
ERCOT, and an impairment of $75.9 million on the equity-method investment in the Texas Coastal Wind Facilities primarily as a result of continued challenges with congestion at the facilities (collectively the “2022 Impairment”).
For the three months ended December 31, 2022, AQN reported Adjusted Net
Earnings per common share of $0.22 as compared to $0.21 per common share during the same period in 2021, an increase of $0.01 (see Caution Concerning Non-GAAP Measures). Adjusted Net Earnings increased by $14.0 million year over year. The
Company grew year over year Adjusted EBITDA by $60.0 million (see Caution Concerning Non-GAAP Measures), primarily as a result of increased gains on asset sales of $33.7 million in the Renewable Energy Group, and the acquisition of Liberty NY
Water, and implementation of new rates at the Empire, Bermuda and Granite State Electric Systems in the Regulated Services Group which contributed $10.1 million and $14.7 million of Adjusted EBITDA, respectively. This growth was partially offset by
increased depreciation of $4.0 million, increased interest of $27.9 million, driven by higher interest rates as well as increased borrowings to support growth initiatives, lower recognition of investment tax credits (“ITCs”) and production tax
credits (“PTCs”) of $9.4 million, and an increase in the weighted average number of common shares outstanding.
For the three months ended December 31, 2022, AQN experienced an average
exchange rate of Canadian to U.S. dollars of approximately 0.7364 as compared to 0.7937 in the same period in 2021, and an average exchange rate of Chilean pesos to U.S. dollars of approximately 0.0011 for the three months ended December 31, 2022 as
compared to 0.0012 for the same period in 2021. As such, any year over year variance in revenue or expenses, in local currency, at any of AQN’s Canadian and Chilean entities is affected by a change in the average exchange rate upon conversion to
AQN’s reporting currency.
For the three months ended December 31, 2022, AQN reported total revenue of
$748.0 million as compared to $592.0 million during the same period in 2021, an increase of $156.0 million or 26.4%. The major factors impacting AQN’s revenue in the three months ended December 31, 2022 as compared to the same period in 2021 are set
out as follows:
| |
|
Three months ended |
| (all dollar amounts in $ millions) |
|
December 31 |
| Comparative Prior Period Revenue |
|
$ |
592.0 |
|
| REGULATED SERVICES GROUP |
|
|
|
|
| Existing Facilities |
|
|
|
|
| Electricity: Increase is primarily due to higher pass through costs at the Empire and Granite State Electric Systems and favourable weather versus prior year at the Empire Electric
System. |
|
|
52.6 |
|
| Natural Gas: Increase is primarily due to higher pass through commodity costs. |
|
|
46.0 |
|
| Water: Increase is primarily due to the inflationary rate increase mechanism at the ESSAL Water System and the tuck-in addition of the Bolivar Water System. |
|
|
3.3 |
|
| Other: Increase is primarily due to an increase in projects at Ft. Benning. |
|
|
0.9 |
|
| |
|
|
102.8 |
|
| New Facilities |
|
|
|
|
| Water: Acquisition of Liberty NY Water (January 2022). |
|
|
30.8 |
|
| |
|
|
30.8 |
|
| Rate Reviews |
|
|
|
|
| Electricity: Increase is primarily due to implementation of new rates at the Empire, Bermuda and Granite State Electric Systems. |
|
|
11.5 |
|
| Natural Gas: Increase is primarily due to implementation of new rates at the EnergyNorth and Peach State Gas Systems. |
|
|
3.2 |
|
| |
|
|
14.7 |
|
| Foreign Exchange |
|
|
(2.1 |
) |
| RENEWABLE ENERGY GROUP |
|
|
|
|
| Existing Facilities |
|
|
|
|
| Hydro: Increase is primarily due to higher production. |
|
|
0.5 |
|
| Wind Canada: Increase is primarily due to higher production at the St. Damase and Amherst Island Wind Facilities. |
|
|
1.2 |
|
| Wind U.S.: Increase is primarily due to favourable renewable energy certificate (“REC”) revenue, favourable energy market pricing, as well as higher availability revenue at the
Maverick and Sugar Creek Wind Facilities. |
|
|
7.5 |
|
| Solar: Decrease is primarily due to unfavourable weather conditions at the Great Bay I, Great Bay II, and Altavista Solar Facilities. |
|
|
(1.7 |
) |
| Thermal: Decrease is primarily driven by lower production at the Sanger Thermal Facility as it had reached the annual target limit of run hours. |
|
|
(0.9 |
) |
| Other: Increase is primarily due to higher Congestion Revenue Rights (“CRRs”) revenue at the Texas Coastal Wind Facilities. |
|
|
4.7 |
|
| |
|
|
11.3 |
|
| New Facilities |
|
|
|
|
| Solar: Increase is due to the Croton Solar Facility (full commercial operations (“COD”) in December 2021). |
|
|
0.2 |
|
| Other: |
|
|
0.1 |
|
| |
|
|
0.3 |
|
| Foreign Exchange |
|
|
(1.8 |
) |
| Current Period Revenue |
|
$ |
748.0 |
|
| Management Discussion & Analysis |
13 |
2022 Annual Results From Operations
| Key Financial Information |
|
Twelve months ended December 31 |
|
| (all dollar amounts in $ millions except per share information) |
|
2022 |
|
|
2021 |
|
|
2020 |
|
| Revenue |
|
$ |
2,765.2 |
|
|
$ |
2,274.1 |
|
|
$ |
1,677.0 |
|
| Net earnings (loss) attributable to shareholders |
|
|
(212.0 |
) |
|
|
264.9 |
|
|
|
782.5 |
|
| Cash provided by operating activities |
|
|
619.1 |
|
|
|
157.5 |
|
|
|
505.2 |
|
| Adjusted Net Earnings1 |
|
|
474.9 |
|
|
|
449.0 |
|
|
|
365.8 |
|
| Adjusted EBITDA1 |
|
|
1,256.8 |
|
|
|
1,076.3 |
|
|
|
869.5 |
|
| Adjusted Funds from Operations1 |
|
|
864.1 |
|
|
|
757.9 |
|
|
|
600.2 |
|
| Dividends declared to common shareholders |
|
|
486.0 |
|
|
|
423.0 |
|
|
|
344.4 |
|
| Weighted average number of common shares outstanding |
|
|
677,862,207 |
|
|
|
622,347,677 |
|
|
|
559,633,275 |
|
| Per share |
|
|
|
|
|
|
|
|
|
|
|
|
| Basic net earnings (loss) |
|
$ |
(0.33 |
) |
|
$ |
0.41 |
|
|
$ |
1.38 |
|
| Diluted net earnings (loss) |
|
$ |
(0.33 |
) |
|
$ |
0.41 |
|
|
$ |
1.37 |
|
| Adjusted Net Earnings1 |
|
$ |
0.69 |
|
|
$ |
0.71 |
|
|
$ |
0.64 |
|
| Dividends declared to common shareholders |
|
$ |
0.71 |
|
|
$ |
0.67 |
|
|
$ |
0.61 |
|
| Total assets |
|
|
17,627.6 |
|
|
|
16,797.5 |
|
|
|
13,224.1 |
|
| Long term debt2 |
|
|
7,512.3 |
|
|
|
6,211.7 |
|
|
|
4,538.8 |
|
| 1 |
See Caution Concerning Non-GAAP Measures. |
| 2 |
Includes current and long-term portion of debt and convertible debentures per the annual consolidated financial statements. |
For the twelve months ended December 31, 2022, AQN reported a basic net loss
per common share of $0.33 as compared to net earnings per common share of $0.41 during the same period in 2021, a decrease of $0.74. This loss was primarily driven by the change in value of investments carried at fair value of $376.7 million
primarily related to the Company’s investment in Atlantica, and the 2022 Impairment. These impaired assets operate within the ERCOT market, and the 2022 Impairment recorded is primarily due to declining forecasted energy prices in ERCOT for the
Senate Wind Facility (which began commercial operations in 2012) and continued challenges with congestion at the Texas Costal Wind Facilities.
For the twelve months ended December 31, 2022, AQN reported Adjusted Net
Earnings per common share of $0.69 as compared to $0.71 per share during the same period in 2021, a decrease of $0.02 (see Caution Concerning Non-GAAP Measures). Adjusted Net Earnings increased by $25.9 million year over year. The Company grew
year over year Adjusted EBITDA by $180.5 million,(see Caution Concerning Non-GAAP Measures), primarily as a result of increased gains on asset sales of $34.9 million and $45.0 million in additional contributions from existing facilities in
the Renewable Energy Group mainly driven by increased production, and the acquisition of Liberty NY Water and implementation of new rates at the Empire, Bermuda and Granite State Electric Systems in the Regulated Services Group which contributed
$37.4 million and $42.3 million of Adjusted EBITDA, respectively. This growth was offset by increased depreciation of $52.5 million, increased interest expense of $69.0 million, driven by higher interest rates and higher borrowings to support growth
initiatives, lower recognition of ITCs and PTCs of $31.0 million, and an increase in the weighted average number of common shares outstanding.
For the twelve months ended December 31, 2022, AQN experienced an average
exchange rate of Canadian to U.S. dollars of approximately 0.7682 as compared to 0.7976 in the same period in 2021, and an average exchange rate of Chilean pesos to U.S. dollars of approximately 0.0011 for the twelve months ended December 31, 2022 as
compared to 0.0014 for the same period in 2021. As such, any year-over-year variance in revenue or expenses, in local currency, at any of AQN’s Canadian and Chilean entities is affected by a change in the average exchange rate upon conversion to
AQN’s reporting currency.
For the twelve months ended December 31, 2022, AQN reported total revenue of
$2,765.2 million as compared to $2,274.1 million during the same period in 2021, an increase of $491.1 million or 21.6%. The major factors resulting in the increase in AQN revenue for the twelve months ended December 31, 2022 as compared to the same
period in 2021 are as follows:
| |
|
Twelve months |
|
| (all dollar amounts in $ millions) |
|
ended December 31 |
|
| Comparative Prior Period Revenue |
|
$ |
2,274.1 |
|
| REGULATED SERVICES GROUP |
|
|
|
|
| Existing Facilities |
|
|
|
|
| Electricity: Increase is primarily due to higher pass through costs at the Empire, Granite State and Bermuda Electric Systems and favourable weather at the Empire Electric System. |
|
|
61.4 |
|
| Natural Gas: Increase is primarily due to higher pass through commodity costs. |
|
|
152.8 |
|
| Water: Increase is primarily due to the inflationary rate increase mechanism at the ESSAL Water System. |
|
|
15.2 |
|
| Other: Increase is primarily due to an increase in projects at Ft. Benning. |
|
|
1.1 |
|
| |
|
|
230.5 |
|
| New Facilities |
|
|
|
|
| Water: Acquisition of Liberty NY Water (January 2022). |
|
|
125.6 |
|
| |
|
|
125.6 |
|
| Rate Reviews |
|
|
|
|
| Electricity: Increase is primarily due to implementation of new rates at the Empire, Bermuda and Granite State Electric Systems. |
|
|
33.2 |
|
| Natural Gas: Increase is primarily due to implementation of new rates at the EnergyNorth and Peach State Gas Systems. |
|
|
7.3 |
|
| Water: Increase is due to the implementation of new rates at the Park Water System. |
|
|
1.8 |
|
| |
|
|
42.3 |
|
| Foreign Exchange |
|
|
(11.7 |
) |
| |
|
|
|
|
| RENEWABLE ENERGY GROUP |
|
|
|
|
| Existing Facilities |
|
|
|
|
| Hydro: Increase is primarily due to higher overall production as well as favourable pricing at one of the Company’s hydro facilities. |
|
|
7.5 |
|
| Wind Canada: Increase is primarily due to higher overall production. |
|
|
5.0 |
|
| Wind U.S.: Increase is primarily due to the non-recurring impact of the Market Disruption Event, higher production, favourable energy market pricing and favourable REC revenue across the U.S. wind
facilities. |
|
|
71.0 |
|
| Solar: Increase is primarily due to favourable REC revenue at the Great Bay I Solar Facility and favourable energy market pricing at the Great Bay II Solar Facility. |
|
|
2.7 |
|
| Thermal: Increase is primarily due to favourable overall energy market pricing and favourable REC revenue at the Windsor Locks Thermal Facility. |
|
|
11.9 |
|
| Other: Increase is primarily due to higher CRR revenue at the Texas Coastal Wind Facilities. |
|
|
8.2 |
|
| |
|
|
|
|
| |
|
|
106.3 |
|
| New Facilities |
|
|
|
|
| Wind U.S.: Decrease is driven by unfavourable pricing, partially offset by higher production at the Maverick Creek Wind Facility. This facility achieved partial completion on November 6, 2020 and COD
on April 21, 2021. |
|
|
(1.6 |
) |
| Solar: Increase is primarily driven by the Altavista Solar Facility (full COD June 2021) and the Croton Solar Facility (full COD Dec 2021). |
|
|
3.5 |
|
| Other: |
|
|
0.2 |
|
| |
|
|
2.1 |
|
| Foreign Exchange |
|
|
(4.0 |
) |
| Current Period Revenue |
|
$ |
2,765.2 |
|
| Management Discussion & Analysis |
15 |
2022 Net Earnings Summary
Net loss attributable to shareholders for the three months ended December 31,
2022 totaled $74.4 million as compared to net earnings of $175.6 million during the same period in 2021, a decrease of $250.0 million or 142.4%. Net loss attributable to shareholders for the twelve months ended December 31, 2022 totaled $212.0
million as compared to net earnings of $264.9 million during the same period in 2021, a decrease of $476.9 million or 180.0%. The following table outlines the changes to net earnings (loss) attributable to shareholders for the three and twelve months
ended December 31, 2022 as compared to the same periods in 2021. A more detailed analysis of these factors can be found under AQN: Corporate and Other Expenses.
| Change in Net Earnings (loss) attributable to shareholders |
|
Three months ended |
|
|
Twelve months ended |
| |
|
December 31 |
|
|
December 31 |
| (all dollar amounts in $ millions) |
|
2022 |
|
|
2022 |
| Net earnings attributable to shareholders - Prior Period Balance |
|
$ |
175.6 |
|
|
$ |
264.9 |
|
| Adjusted EBITDA1 |
|
|
60.0 |
|
|
|
180.5 |
|
| Net earnings attributable to the non-controlling interest, exclusive of |
|
|
|
|
|
|
|
|
| HLBV |
|
|
(3.7 |
) |
|
|
(2.8 |
) |
| Income tax |
|
|
30.4 |
|
|
|
18.1 |
|
| Interest expense |
|
|
(27.9 |
) |
|
|
(69.0 |
) |
| Other net losses |
|
|
9.8 |
|
|
|
1.5 |
|
| Asset impairment charge |
|
|
(159.6 |
) |
|
|
(159.6 |
) |
| Impairment of equity-method investee |
|
|
(75.9 |
) |
|
|
(75.9 |
) |
| Unrealized loss (gain) on energy derivatives included in revenue |
|
|
2.7 |
|
|
|
4.5 |
|
| Pension and post-employment non-service costs |
|
|
0.3 |
|
|
|
5.3 |
|
| Change in value of investments carried at fair value |
|
|
(75.7 |
) |
|
|
(376.7 |
) |
| Impacts from the Market Disruption Event on the Senate Wind Facility |
|
|
— |
|
|
|
53.4 |
|
| Costs related to tax equity financing |
|
|
1.4 |
|
|
|
5.7 |
|
| Loss on derivative financial instruments |
|
|
5.3 |
|
|
|
— |
|
| Foreign exchange |
|
|
(13.1 |
) |
|
|
(9.4 |
) |
| Depreciation and amortization |
|
|
(4.0 |
) |
|
|
(52.5 |
) |
| Net loss attributable to shareholders - Current Period Balance |
|
$ |
(74.4 |
) |
|
$ |
(212.0 |
) |
| Change in Net Earnings ($) |
|
$ |
(250.0 |
) |
|
$ |
(476.9 |
) |
| Change in Net Earnings (%) |
|
|
(142.4 |
)% |
|
|
(180.0 |
)% |
| 1 |
See Caution Concerning Non-GAAP Measures. |
During the three months ended December 31, 2022, cash provided by operating
activities totaled $214.6 million as compared to $126.5 million during the same period in 2021, an increase of $88.1 million. During the three months ended December 31, 2022, Adjusted Funds from Operations totaled $258.4 million as compared to
Adjusted Funds from Operations of $221.2 million during the same period in 2021, an increase of $37.2 million (see Caution Concerning Non-GAAP Measures).
During the three months ended December 31, 2022, Adjusted EBITDA totaled
$358.3 million as compared to $298.3 million during the same period in 2021, an increase of $60.0 million or 20.1% (see Caution Concerning Non-GAAP Measures). A more detailed analysis of this variance is presented within the reconciliation of
Adjusted EBITDA to net earnings set out below under Non-GAAP Financial Measures.
During the twelve months ended December 31, 2022, cash provided by operating
activities totaled $619.1 million as compared to $157.5 million during the same period in 2021, an increase of $461.6 million. During the twelve months ended December 31, 2022, Adjusted Funds from Operations totaled $864.1 million as compared to
$757.9 million the same period in 2021, an increase of $106.2 million (see Caution Concerning Non-GAAP Measures).
During the twelve months ended December 31, 2022, Adjusted EBITDA totaled
$1,256.8 million as compared to $1,076.3 million during the same period in 2021, an increase of $180.5 million or 16.8% (see Caution Concerning Non-
GAAP Measures). A more detailed analysis of this variance is presented
within the reconciliation of Adjusted EBITDA to net earnings set out below under Non-GAAP Financial Measures.
2022 Adjusted EBITDA Summary
Adjusted EBITDA (see Caution Concerning Non-GAAP Measures) for the
three months ended December 31, 2022 totaled $358.3 million as compared to $298.3 million during the same period in 2021, an increase of $60.0 million or 20.1%. Adjusted EBITDA for the twelve months ended December 31, 2022 totaled $1,256.8 million as
compared to $1,076.3 million during the same period in 2021, an increase of $180.5 million or 16.8%. The breakdown of Adjusted EBITDA by the Company’s main business units and a summary of changes are shown below.
| |
|
Three months ended |
|
|
Twelve months ended |
|
| Adjusted EBITDA by business units |
|
December 31 |
|
|
December 31 |
|
| (all dollar amounts in $ millions) |
|
2022 |
|
|
2021 |
|
|
2022 |
|
|
2021 |
|
| Divisional Operating Profit for Regulated Services Group1 |
|
$ |
214.4 |
|
|
$ |
191.4 |
|
|
$ |
863.6 |
|
|
$ |
758.8 |
|
| Divisional Operating Profit for Renewable Energy Group1 |
|
|
163.2 |
|
|
|
123.2 |
|
|
|
472.2 |
|
|
|
383.6 |
|
| Administrative Expenses |
|
|
(21.2 |
) |
|
|
(17.8 |
) |
|
|
(80.2 |
) |
|
|
(66.7 |
) |
| Other Income & Expenses |
|
|
1.9 |
|
|
|
1.5 |
|
|
|
1.2 |
|
|
|
0.6 |
|
| Total AQN Adjusted EBITDA |
|
$ |
358.3 |
|
|
$ |
298.3 |
|
|
$ |
1,256.8 |
|
|
$ |
1,076.3 |
|
| Change in Adjusted EBITDA ($) |
|
$ |
60.0 |
|
|
|
|
|
|
$ |
180.5 |
|
|
|
|
|
| Change in Adjusted EBITDA (%) |
|
|
20.1 |
% |
|
|
|
|
|
|
16.8 |
% |
|
|
|
|
| 1 |
See Caution Concerning Non-GAAP Measures. |
| Change in Adjusted EBITDA |
|
Three months ended December 31, 2022 |
|
| |
|
Regulated |
|
|
Renewable |
|
|
|
|
|
|
|
| (all dollar amounts in $ millions) |
|
Services |
|
|
Energy |
|
|
Corporate |
|
|
Total |
|
| Prior period balances |
|
$ |
191.4 |
|
|
$ |
123.2 |
|
|
$ |
(16.3 |
) |
|
$ |
298.3 |
|
| Existing Facilities and Investments |
|
|
(1.2 |
) |
|
|
9.5 |
|
|
|
0.4 |
|
|
|
8.7 |
|
| New Facilities and Investments |
|
|
10.1 |
|
|
|
(1.3 |
) |
|
|
— |
|
|
|
8.8 |
|
| Rate Reviews |
|
|
14.7 |
|
|
|
— |
|
|
|
— |
|
|
|
14.7 |
|
| Asset Dispositions |
|
|
— |
|
|
|
33.7 |
|
|
|
— |
|
|
|
33.7 |
|
| Foreign Exchange Impact |
|
|
(0.6 |
) |
|
|
(1.9 |
) |
|
|
— |
|
|
|
(2.5 |
) |
| Administrative Expenses |
|
|
— |
|
|
|
— |
|
|
|
(3.4 |
) |
|
|
(3.4 |
) |
| Total change during the period |
|
$ |
23.0 |
|
|
$ |
40.0 |
|
|
$ |
(3.0 |
) |
|
$ |
60.0 |
|
| Current period balances |
|
$ |
214.4 |
|
|
$ |
163.2 |
|
|
$ |
(19.3 |
) |
|
$ |
358.3 |
|
| Change in Adjusted EBITDA |
|
Twelve months ended December 31, 2022 |
|
| |
|
Regulated |
|
|
Renewable |
|
|
|
|
|
|
|
| (all dollar amounts in $ millions) |
|
Services |
|
|
Energy |
|
|
Corporate |
|
|
Total |
|
| Prior period balances |
|
$ |
758.8 |
|
|
$ |
383.6 |
|
|
$ |
(66.1 |
) |
|
$ |
1,076.3 |
|
| Existing Facilities and Investments |
|
|
29.3 |
|
|
|
45.0 |
|
|
|
0.6 |
|
|
|
74.9 |
|
| New Facilities and Investments |
|
|
37.4 |
|
|
|
12.5 |
|
|
|
— |
|
|
|
49.9 |
|
| Rate Reviews |
|
|
42.3 |
|
|
|
— |
|
|
|
— |
|
|
|
42.3 |
|
| Asset Dispositions |
|
|
— |
|
|
|
34.9 |
|
|
|
— |
|
|
|
34.9 |
|
| Foreign Exchange Impact |
|
|
(4.2 |
) |
|
|
(3.8 |
) |
|
|
— |
|
|
|
(8.0 |
) |
| Administrative Expenses |
|
|
— |
|
|
|
— |
|
|
|
(13.5 |
) |
|
|
(13.5 |
) |
| Total change during the period |
|
$ |
104.8 |
|
|
$ |
88.6 |
|
|
$ |
(12.9 |
) |
|
$ |
180.5 |
|
| Current period balances |
|
$ |
863.6 |
|
|
$ |
472.2 |
|
|
$ |
(79.0 |
) |
|
$ |
1,256.8 |
|
| Management Discussion & Analysis |
17 |
REGULATED SERVICES GROUP
The Regulated Services Group operates rate-regulated utilities that as of
December 31, 2022 provided distribution services to approximately 1,244,000 customer connections in the electric, natural gas, and water and wastewater sectors which is an increase of approximately 151,000 customer connections as compared to December
31, 2021, including the approximately 127,000 customers in the state of New York that were added effective January 1, 2022 with the acquisition of Liberty NY Water.
The Regulated Services Group seeks to grow its business organically and
through business development activities while using prudent acquisition criteria. The Regulated Services Group believes that its business results are maximized by building constructive regulatory and customer relationships, and enhancing customer
connections in the communities in which it operates.
| Utility System Type |
|
As at December 31 |
|
| |
|
2022 |
|
|
2021 |
|
| |
|
|
|
|
|
|
|
Total |
|
|
|
|
|
|
|
|
Total |
|
| |
|
|
|
|
Net Utility |
|
|
Customer |
|
|
|
|
|
Net Utility |
|
|
Customer |
|
| (all dollar amounts in $ millions) |
|
Assets |
|
|
Sales1 |
|
|
Connections2 |
|
|
Assets |
|
|
Sales1 |
|
|
Connections2 |
|
| Electricity |
|
|
4,772.1 |
|
|
|
811.9 |
|
|
|
309,000 |
|
|
|
4,721.6 |
|
|
|
707.6 |
|
|
|
307,000 |
|
| Natural Gas |
|
|
1,728.9 |
|
|
|
345.9 |
|
|
|
375,000 |
|
|
|
1,573.4 |
|
|
|
331.7 |
|
|
|
373,000 |
|
| Water and Wastewater |
|
|
1,732.9 |
|
|
|
346.1 |
|
|
|
560,000 |
|
|
|
842.5 |
|
|
|
222.3 |
|
|
|
413,000 |
|
| Other |
|
|
321.0 |
|
|
|
55.7 |
|
|
|
|
|
|
|
256.7 |
|
|
|
53.4 |
|
|
|
|
|
| Total |
|
$ |
8,554.9 |
|
|
$ |
1,559.6 |
|
|
|
1,244,000 |
|
|
$ |
7,394.2 |
|
|
$ |
1,315.0 |
|
|
|
1,093,000 |
|
| Accumulated Deferred Income |
|
|
|
|
|
|
|
|
|
|
|
|
|
|
|
|
|
|
|
|
|
|
|
|
| Taxes Liability |
|
$ |
689.1 |
|
|
|
|
|
|
|
|
|
|
$ |
600.2 |
|
|
|
|
|
|
|
|
|
| 1 |
Net Utility Sales for the twelve months ended December 31, 2022 and 2021. See Caution Concerning Non-GAAP Measures. |
| 2 |
Total Customer Connections represents the sum of all active and vacant customer connections. |
The Regulated Services Group aggregates the performance of its utility
operations by utility system type – electricity, natural gas, and water and wastewater systems.
The electric distribution systems are comprised of regulated electrical
distribution utility systems and served approximately 309,000 customer connections in the U.S. States of California, New Hampshire, Missouri, Kansas, Oklahoma and Arkansas and in Bermuda as at December 31, 2022.
The natural gas distribution systems are comprised of regulated natural gas
distribution utility systems and served approximately 375,000 customer connections located in the U.S. States of New Hampshire, Illinois, Iowa, Missouri, Georgia, Massachusetts and New York and in the Canadian Province of New Brunswick as at December
31, 2022.
The water and wastewater distribution systems are comprised of regulated water
distribution and wastewater collection utility systems and served approximately 560,000 customer connections located in the U.S. States of Arkansas, Arizona, California, Illinois, Missouri, New York, and Texas, and in Chile as at December 31, 2022.
2022 Annual Usage Results
| Electric Distribution Systems |
|
Three months ended December 31 |
|
|
Twelve months ended December 31 |
|
| |
|
2022 |
|
|
2021 |
|
|
2022 |
|
|
2021 |
|
| Average Active Electric Customer Connections For The Period |
|
|
|
|
|
|
|
|
|
|
|
|
| Residential |
|
|
262,500 |
|
|
|
261,100 |
|
|
|
261,900 |
|
|
|
260,600 |
|
| Commercial and industrial |
|
|
43,200 |
|
|
|
42,300 |
|
|
|
42,800 |
|
|
|
42,100 |
|
| Total Average Active Electric Customer Connections For The Period |
|
|
305,700 |
|
|
|
303,400 |
|
|
|
304,700 |
|
|
|
302,700 |
|
| |
|
|
|
|
|
|
|
|
|
|
|
|
|
|
|
|
| Customer Usage (GW-hrs) |
|
|
|
|
|
|
|
|
|
|
|
|
|
|
|
|
| Residential |
|
|
653.3 |
|
|
|
581.7 |
|
|
|
2,899.6 |
|
|
|
2,769.7 |
|
| Commercial and industrial |
|
|
924.2 |
|
|
|
899.3 |
|
|
|
3,849.3 |
|
|
|
3,701.1 |
|
| Total Customer Usage (GW-hrs) |
|
|
1,577.5 |
|
|
|
1,481.0 |
|
|
|
6,748.9 |
|
|
|
6,470.8 |
|
For the three months ended December 31, 2022, the electric distribution
systems’ usage totaled 1,577.5 GW-hrs as compared to 1,481.0 GW-hrs for the same period in 2021, an increase of 96.5 GW-hrs or 6.5%. The increase in electricity consumption is primarily due to more favourable weather.
For the twelve months ended December 31, 2022, the electric distribution
systems’ usage totaled 6,748.9 GW-hrs as compared to 6,470.8 GW-hrs for the same period in 2021, an increase of 278.1 GW-hrs or 4.3%. The increase in electricity consumption is primarily due to more favourable weather.
Approximately 47% of the Regulated Services Group’s electric distribution
systems’ revenues are not expected to be impacted by changes in customer usage, as they are subject to volumetric decoupling or represent fixed fee billings.
| Natural Gas Distribution Systems |
|
Three months ended December 31 |
|
|
Twelve months ended December 31 |
|
| |
|
2022 |
|
|
2021 |
|
|
2022 |
|
|
2021 |
|
| Average Active Natural Gas Customer Connections For The Period |
|
|
|
|
|
|
|
|
|
|
|
|
|
|
|
|
| Residential |
|
|
321,100 |
|
|
|
318,000 |
|
|
|
320,300 |
|
|
|
318,600 |
|
| Commercial and industrial |
|
|
39,100 |
|
|
|
38,100 |
|
|
|
38,800 |
|
|
|
38,100 |
|
| Total Average Active Natural Gas Customer Connections For The Period |
|
|
360,200 |
|
|
|
356,100 |
|
|
|
359,100 |
|
|
|
356,700 |
|
| |
|
|
|
|
|
|
|
|
|
|
|
|
|
|
|
|
| Customer Usage (MMBTU) |
|
|
|
|
|
|
|
|
|
|
|
|
|
|
|
|
| Residential |
|
|
5,433,000 |
|
|
|
5,750,000 |
|
|
|
20,912,000 |
|
|
|
20,703,000 |
|
| Commercial and industrial |
|
|
5,723,000 |
|
|
|
5,077,000 |
|
|
|
20,607,000 |
|
|
|
18,696,000 |
|
| Total Customer Usage (MMBTU) |
|
|
11,156,000 |
|
|
|
10,827,000 |
|
|
|
41,519,000 |
|
|
|
39,399,000 |
|
For the three months ended December 31, 2022, usage at the natural gas
distribution systems totaled 11,156,000 MMBTU as compared to 10,827,000 MMBTU during the same period in 2021, an increase of 329,000 MMBTU, or 3.0%. The increase in customer usage was primarily driven by customer growth in the New Brunswick Gas
System and favourable weather at the Mid-States Gas System.
For the twelve months ended December 31, 2022, usage at the natural gas
distribution systems totaled 41,519,000 MMBTU as compared to 39,399,000 MMBTU during the same period in 2021, an increase of 2,120,000 MMBTU or 5.4%. The increase in customer usage was primarily driven by favourable weather at the Mid-States,
EnergyNorth and New Brunswick Gas Systems.
Approximately 86% of the Regulated Services Group’s gas distribution systems’
revenues are not expected to be impacted by changes in customer usage, as they are subject to volumetric decoupling or represent fixed fee billings.
| Management Discussion & Analysis |
19 |
Water and Wastewater Distribution
| Systems |
|
Three months ended December 31 |
|
|
Twelve months ended December 31 |
|
| |
|
2022 |
|
|
2021 |
|
|
2022 |
|
|
2021 |
|
| Average Active Customer Connections For The Period |
|
|
|
|
|
|
|
|
|
|
|
|
| Wastewater customer connections |
|
|
49,100 |
|
|
|
47,800 |
|
|
|
48,100 |
|
|
|
47,500 |
|
| Water distribution customer connections |
|
|
501,800 |
|
|
|
358,300 |
|
|
|
497,500 |
|
|
|
359,100 |
|
| Total Average Active Customer Connections For The Period |
|
|
550,900 |
|
|
|
406,100 |
|
|
|
545,600 |
|
|
|
406,600 |
|
| Gallons Provided (millions of gallons) |
|
|
|
|
|
|
|
|
|
|
|
|
|
|
|
|
| Wastewater treated |
|
|
822 |
|
|
|
726 |
|
|
|
3,233 |
|
|
|
2,768 |
|
| Water provided |
|
|
9,851 |
|
|
|
7,297 |
|
|
|
41,619 |
|
|
|
28,197 |
|
| Total Gallons Provided (millions of gallons) |
|
|
10,673 |
|
|
|
8,023 |
|
|
|
44,852 |
|
|
|
30,965 |
|
For the three months ended December 31, 2022, the water and wastewater
distribution systems provided approximately 9,851 million gallons of water to customers and treated approximately 822 million gallons of wastewater. This is compared to 7,297 million gallons of water provided and 726 million gallons of wastewater
treated during the same period in 2021, an increase in total gallons provided of 2,554 million or 35.0% and an increase in total gallons treated of 96 million or 13.2%. This is primarily due to the acquisition of Liberty NY Water.
For the twelve months ended December 31, 2022, the water and wastewater
distribution systems provided approximately 41,619 million gallons of water to customers and treated approximately 3,233 million gallons of wastewater. This is compared to 28,197 million gallons of water provided and 2,768 million gallons of
wastewater treated during the same period in 2021, an increase in total gallons provided of 13,422 million or 47.6% and an increase in total gallons treated of 465 million or 16.8%. This is primarily due to the acquisition of Liberty NY Water.
Approximately 50% of the Regulated Services Group’s water and wastewater
distribution systems’ revenues are not expected to be impacted by changes in customer usage, as they are subject to volumetric decoupling or represent fixed fee billings.
2022 Regulated Services Group Operating Results
| |
|
Three months ended |
|
|
Twelve months ended |
|
| |
|
December 31 |
|
|
December 31 |
|
| (all dollar amounts in $ millions) |
|
2022 |
|
|
2021 |
|
|
2022 |
|
|
2021 |
|
| Revenue |
|
|
|
|
|
|
|
|
|
|
|
|
| Regulated electricity distribution |
|
$ |
326.3 |
|
|
$ |
261.3 |
|
|
$ |
1,277.4 |
|
|
$ |
1,183.4 |
|
| Less: Regulated electricity purchased |
|
|
(124.2 |
) |
|
|
(93.0 |
) |
|
|
(465.5 |
) |
|
|
(475.8 |
) |
| Net Utility Sales - electricity1 |
|
|
202.1 |
|
|
|
168.3 |
|
|
|
811.9 |
|
|
|
707.6 |
|
| Regulated gas distribution |
|
|
221.8 |
|
|
|
172.0 |
|
|
|
686.7 |
|
|
|
525.9 |
|
| Less: Regulated gas purchased |
|
|
(125.5 |
) |
|
|
(80.2 |
) |
|
|
(340.8 |
) |
|
|
(194.2 |
) |
| Net Utility Sales - natural gas1 |
|
|
96.3 |
|
|
|
91.8 |
|
|
|
345.9 |
|
|
|
331.7 |
|
| Regulated water reclamation and distribution |
|
|
89.0 |
|
|
|
58.3 |
|
|
|
364.4 |
|
|
|
234.9 |
|
| Less: Regulated water purchased |
|
|
(8.6 |
) |
|
|
(2.6 |
) |
|
|
(18.3 |
) |
|
|
(12.6 |
) |
| Net Utility Sales - water reclamation and distribution1 |
80.4 |
|
|
|
55.7 |
|
|
|
346.1 |
|
|
|
222.3 |
|
| Other revenue2 |
|
|
14.0 |
|
|
|
13.4 |
|
|
|
55.7 |
|
|
|
53.4 |
|
| Net Utility Sales1,3 |
|
|
392.8 |
|
|
|
329.2 |
|
|
|
1,559.6 |
|
|
|
1,315.0 |
|
| Operating expenses |
|
|
(185.8 |
) |
|
|
(149.0 |
) |
|
|
(736.5 |
) |
|
|
(597.9 |
) |
| Other income |
|
|
5.2 |
|
|
|
3.9 |
|
|
|
21.9 |
|
|
|
18.3 |
|
| HLBV4 |
|
|
2.2 |
|
|
|
7.3 |
|
|
|
18.6 |
|
|
|
23.4 |
|
| Divisional Operating Profit1,5,6 |
|
$ |
214.4 |
|
|
$ |
191.4 |
|
|
$ |
863.6 |
|
|
$ |
758.8 |
|
| 1 |
See Caution Concerning Non-GAAP Measures. |
| 2 |
See Note 21 in the annual consolidated financial statements. |
| 3 |
This table contains a reconciliation of Net Utility Sales to revenue. The relevant sections of the table are derived from and should be read in conjunction with the
consolidated statement of operations and Note 21 in the annual consolidated financial statements, “Segmented Information”. This supplementary disclosure is intended to more fully explain disclosures related to Net Utility Sales and
provides additional information related to the operating performance of the Regulated Services Group. Investors are cautioned that Net Utility Sales should not be construed as an alternative to revenue. |
| 4 |
HLBV income represents the value of net tax attributes monetized by the Regulated Services Group in the period at the Luning and Turquoise Solar Facilities and the Neosho
Ridge, Kings Point and North Fork Ridge Wind Facilities (collectively the “Empire Wind Facilities”). |
| 5 |
This table contains a reconciliation of Divisional Operating Profit to revenue for the Regulated Services Group. The relevant sections of the table are derived from and
should be read in conjunction with the consolidated statement of operations and Note 21 in the annual consolidated financial statements, “Segmented Information”. This supplementary disclosure is intended to more fully explain
disclosures related to Divisional Operating Profit and provides additional information related to the operating performance of the Regulated Services Group. Investors are cautioned that Divisional Operating Profit should not be construed as an
alternative to revenue. |
| 6 |
Certain prior year items have been reclassified to conform with current year presentation. |
| Management Discussion & Analysis |
21 |
2022 Fourth Quarter Operating Results
For the three months ended December 31, 2022, the Regulated Services
Group reported revenue of $637.0 million (i.e., $326.3 million of regulated electricity distribution, $221.8 million of regulated gas distribution and $89.0 million of regulated water reclamation and distribution) as compared to revenue of $491.6
million in the comparable period in the prior year (i.e., $261.3 million of regulated electricity distribution, $172.0 million of regulated gas distribution and $58.3 million of regulated water reclamation and distribution).
For the three months ended December 31, 2022, the Regulated Services
Group reported a Divisional Operating Profit (excluding corporate administration expenses) of $214.4 million as compared to $191.4 million for the comparable period in the prior year (see Caution Concerning Non-GAAP Measures).
Highlights of the changes are summarized in the following table:
| |
|
Three months ended |
|
| (all dollar amounts in $ millions) |
|
December 31 |
|
| Prior Period Divisional Operating Profit1 |
|
$ |
191.4 |
|
| Existing Facilities |
|
|
|
|
| Electricity: Increase is primarily due to favourable weather at the Empire Electric System. |
|
|
5.4 |
|
| Gas: Decrease is primarily due to higher operating expenses driven by inflationary pressure as well as increased bad debt, and property tax expenses. |
|
|
(8.2 |
) |
| Water: Decrease is primarily due to higher operating costs at the Park Water System. |
|
|
(0.6 |
) |
| Other: |
|
|
2.2 |
|
| |
|
|
(1.2 |
) |
| New Facilities |
|
|
|
|
| Water: Acquisition of Liberty NY Water (January 2022). |
|
|
10.1 |
|
| |
|
|
10.1 |
|
| Rate Reviews |
|
|
|
|
| Electricity: Increase is primarily due to implementation of new rates at the Empire, Bermuda and Granite State Electric Systems. |
|
|
11.5 |
|
| Gas: Increase is primarily due to implementation of new rates at the EnergyNorth and Peach State Gas Systems. |
|
|
3.2 |
|
| |
|
|
14.7 |
|
| Foreign Exchange |
|
|
(0.6 |
) |
| Current Period Divisional Operating Profit1 |
|
$ |
214.4 |
|
|
1 |
See Caution Concerning Non-GAAP Measures. |
ALGONQUIN | LIBERTY
2022 Annual Operating Results
For the twelve months ended December 31, 2022, the Regulated Services
Group reported revenue of $2,328.5 million (i.e., $1,277.4 million of regulated electricity distribution, $686.7 million of regulated natural gas distribution and $364.4 million of regulated water reclamation and distribution) as compared to revenue
of $1,944.2 million in the prior year (i.e., $1,183.4 million of regulated electricity distribution, $525.9 million of regulated natural gas distribution and $234.9 million of regulated water reclamation and distribution).
For the twelve months ended December 31, 2022, the Regulated Services
Group reported a Divisional Operating Profit (excluding corporate administration expenses) of $863.6 million as compared to $758.8 million in the prior year (see Caution Concerning Non-GAAP Measures).
Highlights of the changes are summarized in the following table:
| (all dollar amounts in $ millions) |
|
Twelve months
ended December 31 |
|
| Prior Period Divisional Operating Profit1 |
|
$ |
758.8 |
|
| Existing Facilities |
|
|
|
|
| Electricity: Increase is primarily due to higher than usual non-pass through fuel cost increases associated with the Midwest Extreme Weather Event that were recorded in the
comparative period at the Empire Electric System and favourable weather at the Empire Electric System. |
|
|
35.9 |
|
| Natural Gas: Decrease is primarily due to higher operating expenses. |
|
|
(9.6 |
) |
| Water: Increase is primarily due to higher revenue at the ESSAL Water System. |
|
|
0.3 |
|
| Other: Increase is primarily due to increased carrying charges on regulatory assets. |
|
|
2.7 |
|
| |
|
|
29.3 |
|
| New Facilities |
|
|
|
|
| Water: Acquisition of Liberty NY Water (January 2022). |
|
|
37.4 |
|
| |
|
|
37.4 |
|
| Rate Reviews |
|
|
|
|
| Electricity: Increase is primarily due to implementation of new rates at the Empire, Bermuda and Granite State Electric Systems. |
|
|
33.2 |
|
| Natural Gas: Increase is primarily due to implementation of new rates at the EnergyNorth and Peach State Gas Systems. |
|
|
7.3 |
|
| Water: Increase is primarily due to the implementation of new rates at the Park Water System. |
|
|
1.8 |
|
| |
|
|
42.3 |
|
| Foreign Exchange |
|
|
(4.2 |
) |
| Current Period Divisional Operating Profit1 |
|
$ |
863.6 |
|
|
1 |
See Caution Concerning Non-GAAP Measures. |
| Management Discussion & Analysis |
23 |
Regulatory Proceedings
The following table summarizes the major regulatory proceedings
currently underway or completed in 2022 within the Regulated Services Group.1
| Utility |
Jurisdiction |
Regulatory Proceeding Type |
Rate Request (millions) |
Current Status |
| Completed Rate Reviews |
|
|
|
|
| Empire Electric |
Missouri |
General Rate Case (“GRC”) and Securitization |
$79.9 |
On May 28, 2021, filed a rate review based on a 12 month historical test year ending
September 30, 2020, with an update period through June 30, 2021, seeking to recover an annual revenue deficiency of $50.0 million, or a 7.61% increase in total base rate operating revenue, based on a rate base of $2.6 billion, which
includes the Empire Wind Facilities and the retirement of the Asbury generating plant, and $29.9 million in costs associated with the impact of the Midwest Extreme Weather Event. On March 9, 2022 the Missouri Public Service Commission (the
“MPSC”) approved four stipulation agreements resolving all issues, except rate design, and resulting in an annual base rate revenue increase of $35.5 million, as well as another $4 million in revenues associated with the Empire Wind
Facilities. On April 6, 2022, the MPSC issued its Report and Order resolving all issues. Empire Electric filed updated tariffs in May 2022 for new rates to become effective in June 2022. |
| |
|
|
|
|
| |
|
|
|
On January 19, 2022, Empire Electric filed a petition for securitization of the costs associated with the
impact of the Midwest Extreme Weather Event. On March 21, 2022, Empire Electric filed a petition for securitization of the costs associated with the retirement of the Asbury generating plant. On August 18, 2022, and September 22, 2022,
the MPSC issued and amended, respectively, a Report and Order authorizing Empire Electric to securitize approximately $290.4 million in qualified extraordinary costs (Midwest Extreme Weather Event), energy transition costs (Asbury)
and upfront financing costs associated with the proposed securitization. The amounts authorized by the securitization order are generally consistent with the costs deferred by the Company in relation to these matters. Empire
Electric filed an appeal of the MPSC order on November 10, 2022. See – Regulatory Proceedings related to the Midwest Extreme Weather Event and the Retirement of Asbury for a more detailed description. |
| |
|
|
|
|
| BELCO |
Bermuda |
GRC |
$34.8 |
On September 30, 2021, BELCO filed its revenue allowance application in which
it requested a $34.8 million increase for 2022 and a $6.1 million increase for 2023. On March 18, 2022, the Regulatory Authority (“RA”) approved an annual increase of $22.8 million, for a revenue allowance of $224.1 million for 2022 and $226.2
million for 2023. The RA authorized a 7.16% rate of return, comprised of a 62% equity and an 8.92% return on equity (“ROE”). In April 2022, BELCO filed an appeal in the Supreme Court of Bermuda challenging the decisions made by the RA through
the recent Retail Tariff Review. |
ALGONQUIN | LIBERTY
Utility |
Jurisdiction |
Regulatory Proceeding Type |
Rate Request (millions) |
Current Status |
| Empire Electric |
Kansas |
GRC |
$4.5 |
On May 27, 2021, submitted an abbreviated rate review seeking to recover costs
associated with the addition of the Empire Wind Facilities, the retirement of Asbury and non-growth related plant investments since the 2019 rate review. In May 2022, the Commission approved the unanimous partial settlement resolving
the rate treatment of the Asbury retirement and the non-wind investments, and resulting in a base rate decrease of $0.6 million. Withdrawal of the request to recover the Empire Wind Facilities through base rates results in an estimated
benefit to Empire Electric of $3.9 million. New base rates became effective in July 2022. |
| |
|
|
|
|
| Empire District Gas Company |
Missouri |
GRC |
$1.4 |
On August 23, 2021, filed an application requesting a revenue increase of $1.4
million based on an ROE of 10% and on a 52% equity capital structure. In January 2022, MPSC staff filed its testimony, recommending a $1.0 million revenue increase based on an ROE of 9.5%. On April 12, 2022 the Company, MPSC staff,
consumer advocate group and industrial customer group filed a stipulation and agreement resolving most of the issues in the case. An evidentiary hearing was held in April 2022. In June 2022, the MPSC approved the stipulation and agreement
providing for an annual increase of $1.0 million in base rate revenues. New rates became effective in August 2022. |
| |
|
|
|
|
| Empire Electric |
Oklahoma |
GRC |
$6.2 |
On February 28, 2022, filed an application seeking a base revenue increase of
$6.2 million, offset by estimated fuel savings associated with the Empire Wind Facilities of $2.1 million, for an estimated net revenue increase of $4.1 million based on an ROE of 10% and a 52.79% equity capital structure. On December
29, 2022, the Commission approved a joint stipulation and agreement filed by the Company and Staff authorizing an annual base rate revenue increase of $5.1 million. |
| |
|
|
|
|
| New Brunswick Gas |
Canada |
GRC |
-$3.9 |
On November 22, 2021, filed its 2022 general rate application for a revenue decrease
based on the Energy & Utilities Board’s recent decision authorizing a capital structure of 45% equity and an ROE of 8.5%. In January 2022, New Brunswick Gas appealed the Energy & Utilities Board’s cost of capital decision. In May
2022, the Energy & Utilities Board issued a partial decision approving a decrease in annual revenues of $1.0 million to become effective in July 2022. In June 2022, the Court of Appeal found in favour of New Brunswick Gas and remanded
the cost of capital case back to the Energy & Utilities Board. On December 22, 2022 the Energy & Utilities Board issued a Final Order and approved an annual revenue increase of $1.3 million based on an ROE of 9.8%. New
rates became effective January 1, 2023. |
| |
|
|
|
|
| Apple Valley Ranchos Water System |
California |
GRC |
$2.9 |
On July 2, 2021, filed an application requesting revenue increases of $2.9 million
for 2022, $2.1 million for 2023, and $2.3 million for 2024 based on an ROE of 9.4% and on a 57% equity capital structure. The California Public Utilities Commission (“CPUC”) Public Advocates Office issued its report in January
2022. Rebuttal testimony was filed in February 2022 and a hearing was held in March 2022. On February 3, 2023, the Commission issued a Final Order authorizing an annual revenue increase of $1.5 million. New rates are expected to become
effective in March 2023 retroactive to July 1, 2022. |
| Management Discussion & Analysis |
25 |
Utility |
Jurisdiction |
Regulatory Proceeding Type |
Rate Request (millions) |
Current Status |
| Park Water System |
California |
GRC |
$5.5 |
On July 2, 2021, filed an application requesting revenue increases of $5.5 million
for 2022, $1.8 million for 2023, and $1.8 million for 2024 based on an ROE of 9.4% and on a 57% equity capital structure. CPUC Public Advocates Office issued its report in January 2022. Rebuttal testimony was filed in February 2022 and a
hearing was held in March 2022. On February 3, 2023, the CPUC issued a Final Order authorizing an annual revenue increase of $1.1 million. New rates will become effective in March 2023 retroactive to July 1, 2022. |
| |
|
|
|
|
| Pending Rate Reviews |
|
|
|
|
| CalPeco Electric System |
California |
GRC |
$35.7 |
On May 28, 2021, filed an application requesting a revenue increase of $35.7 million
for 2022 based on an ROE of 10.5% and on a 54% equity capital structure. CPUC Public Advocates Office issued its report on February 23, 2022 and CalPeco filed its rebuttal testimony in March 2022. In May 2022, a settlement was
reached resolving all issues except ROE. A final decision is expected in the second quarter of 2023. |
| |
|
|
|
|
| St. Lawrence Gas |
New York |
GRC |
$4.1 |
On November 24, 2021, filed an application requesting a revenue increase of $3.4
million based on an ROE of 10.5% and a capital structure of 50% equity. On January 31, 2022, filed a supplemental filing to update the requested revenue increase to $4.1 million. New York State Department of Public Service staff
filed testimony on June 3, 2022 recommending an increase of $1.2 million in annual distribution revenues. St. Lawrence Gas filed rebuttal testimony on June 24, 2022 and updated request for an increase in distribution base revenues of
$3.6 million. Settlement discussions began in July 2022 and a decision is expected in the second quarter of 2023. |
| |
|
|
|
|
| Pine Bluff Water |
Arkansas |
GRC |
$5.9 |
On September 30, 2022, filed an application seeking an increase in revenues of $5.9
million based on an ROE of 10.5% and an equity ratio of 52% to be phased in over three years. |
| |
|
|
|
|
| Various |
Various |
Various |
$0.1 |
Other pending rate review requests across two wastewater utilities. |
|
1 |
All rate requests do not include step-up adjustments. |
ALGONQUIN | LIBERTY
Proceedings related to the Midwest Extreme Weather Event and the Retirement of Asbury
The Midwest Extreme Weather Event resulted in an extraordinary increase
in costs incurred by Empire Electric for the purchase of fuel and power on behalf of its customers.
When Empire Electric filed its most recent Missouri rate case (the
“Empire Rate Case”) in May 2021, a request to recover the costs related to the Midwest Extreme Weather Event was included. In July 2021, Missouri House Bill 734 was signed into law, creating an option for utilities to finance the recovery of
extraordinary weather event costs through securitization (the “Securitization Statute”). When it filed its surrebuttal testimony in January 2022, Empire Electric removed all costs related to the Midwest Extreme Weather Event from its rate request.
Pursuant to the Securitization Statute, Empire Electric sought authorization for the issuance of approximately $222 million in securitized utility tariff bonds associated with the Midwest Extreme Weather Event.
In addition, as part of its 2017 and 2019 Integrated Resource Plans
(“IRPs”), Empire Electric analyzed the effects of retiring Asbury, a coal-fired generation unit that was constructed in 1970, and determined that doing so would generate significant savings to customers. Asbury was retired on March 1, 2020. On July
23, 2020, the MPSC issued an Administrative Accounting Order (“AAO”) that directed Empire Electric to establish regulatory asset and liability accounts, beginning January 1, 2020, to reflect the impact of the closure of Asbury on operating and
capital expenses in Missouri.
Empire Electric initially sought to recover its Asbury related revenues
and expenses, along with the balance of the AAO, in the Empire Rate Case. Following the passage of the Securitization Statute, all Asbury related balances were removed from the Empire Rate Case and, on March 21, 2022, Empire Electric filed a petition
to securitize the Asbury related balances pursuant to the Securitization Statute. Empire Electric sought authority to issue approximately $141 million, in securitized utility tariff bonds for its Asbury costs, which include approximately $21 million
in Asset Retirement Obligations, which are estimates of costs that Empire Electric will recover from the Asbury retirement but which have not yet been incurred.
On April 27, 2022, the MPSC issued an order consolidating, for purposes
of hearing, the cases regarding the quantum financeable through securitization for Asbury and the Midwest Extreme Weather Event, which hearing was held the week of June 13, 2022. On August 18, 2022, and September 22, 2022, the MPSC issued and
amended, respectively, a Report and Order authorizing Empire Electric to securitize approximately $290.4 million in qualified extraordinary costs (Midwest Extreme Weather Event), energy transition costs (Asbury) and upfront financing costs associated
with the proposed securitization. The amounts authorized by the securitization order are generally consistent with the costs deferred by the Company in relation to these matters. Empire Electric filed a request for rehearing seeking reconsideration
of the MPSC’s denial of recovery of five percent of the Midwest Extreme Weather Event costs, its calculation of accumulated deferred income taxes, and the exclusion of certain carrying charges associated with the Asbury plant, among other issues. On
October 12, 2022, the MPSC denied all rehearing motions. Empire Electric appealed to the Missouri Court of Appeals – Western District on November 10, 2022. The Office of Public Counsel also filed an appeal, but withdrew that appeal on February 28,
2023. Briefing of the case is expected to be complete in April 2023.
Regulatory Proceedings related to Acquisitions:
Kentucky Power Transaction
Closing of the Kentucky Power Transaction is subject to receipt of
certain regulatory and governmental approvals. During the first quarter of 2022, the applicable waiting period under the Hart-Scott-Rodino Antitrust Improvements Act of 1976 expired (which clearance has now lapsed) and the Committee on Foreign
Investment in the United States cleared the Kentucky Power Transaction. On May 4, 2022, the Kentucky Public Service Commission (the “KPSC”) issued an order approving the Kentucky Power Transaction, subject to certain conditions set forth in the
order, including those agreed to by Liberty Utilities in the course of the docket. On May 3, 2022, the KPSC issued an order that required certain changes to the proposed operating and ownership agreements (collectively, the “Mitchell Agreements”)
relating to the Mitchell coal generating facility (in which Kentucky Power owns a 50% interest, representing 780 MW) (the “Mitchell Plant”). On July 1, 2022, the Public Service Commission of West Virginia (the “WVPSC”) issued an order on the Mitchell
Agreements that is inconsistent with the KPSC’s order on the Mitchell Agreements. The closing of the Kentucky Power Transaction is subject to the satisfaction or waiver of certain conditions precedent, which include the approval of the Kentucky Power
Transaction by FERC, renewed clearance pursuant to the Hart-Scott-Rodino Antitrust Improvements Act of 1976 and those relating to the approval of the Mitchell Agreements by the KPSC, WVPSC and FERC. On September 29, 2022, Liberty Utilities, AEP and
AEP Transmission entered into an amendment to the Kentucky Acquisition Agreement that provides a path towards closing. Among other things, the amendment reduces the purchase price by $200 million. On December 15, 2022, FERC issued an order denying,
without prejudice, authorization for the proposed transaction. On February 14, 2023, a new application was filed with FERC for the approval of the Kentucky Power Transaction.
| Management Discussion & Analysis |
27 |
RENEWABLE ENERGY GROUP
2022 Electricity Generation Performance
| |
|
Long Term
Average |
|
|
Three months ended
December 31 |
|
|
Long Term
Average |
|
|
Twelve months ended
December 31
|
|
| (Performance in GW-hrs sold) |
|
Resource
|
|
|
2022 |
|
|
2021 |
|
|
Resource
|
|
|
2022 |
|
|
2021 |
|
| Hydro Facilities: |
|
|
|
|
|
|
|
|
|
|
|
|
|
|
|
|
|
|
|
|
|
|
|
|
| Maritime Region |
|
|
37.6 |
|
|
|
48.2 |
|
|
|
36.7 |
|
|
|
148.2 |
|
|
|
149.1 |
|
|
|
124.2 |
|
| Quebec Region |
|
|
72.6 |
|
|
|
74.1 |
|
|
|
74.4 |
|
|
|
273.3 |
|
|
|
292.0 |
|
|
|
266.6 |
|
| Ontario Region |
|
|
26.2 |
|
|
|
27.9 |
|
|
|
21.8 |
|
|
|
120.4 |
|
|
|
116.0 |
|
|
|
91.2 |
|
| Western Region |
|
|
12.6 |
|
|
|
10.2 |
|
|
|
9.1 |
|
|
|
65.0 |
|
|
|
52.1 |
|
|
|
49.9 |
|
| |
|
|
149.0 |
|
|
|
160.4 |
|
|
|
142.0 |
|
|
|
606.9 |
|
|
|
609.2 |
|
|
|
531.9 |
|
| Canadian Wind Facilities: |
|
|
|
|
|
|
|
|
|
|
|
|
|
|
|
|
|
|
|
|
|
|
|
|
| St. Damase |
|
|
22.7 |
|
|
|
23.4 |
|
|
|
18.3 |
|
|
|
76.9 |
|
|
|
77.7 |
|
|
|
70.8 |
|
| St. Leon |
|
|
121.4 |
|
|
|
125.4 |
|
|
|
127.5 |
|
|
|
430.2 |
|
|
|
435.0 |
|
|
|
422.5 |
|
| Red Lily1 |
|
|
24.1 |
|
|
|
25.3 |
|
|
|
26.3 |
|
|
|
88.5 |
|
|
|
90.8 |
|
|
|
91.2 |
|
| Morse |
|
|
30.5 |
|
|
|
26.1 |
|
|
|
31.0 |
|
|
|
108.8 |
|
|
|
103.7 |
|
|
|
107.2 |
|
| Amherst |
|
|
67.9 |
|
|
|
67.6 |
|
|
|
62.8 |
|
|
|
229.8 |
|
|
|
219.5 |
|
|
|
198.4 |
|
| Blue Hill2 |
|
|
200.4 |
|
|
|
140.2 |
|
|
|
— |
|
|
|
558.3 |
|
|
|
464.2 |
|
|
|
— |
|
| EBR3 |
|
|
21.0 |
|
|
|
21.1 |
|
|
|
— |
|
|
|
74.4 |
|
|
|
71.0 |
|
|
|
— |
|
| |
|
|
488.0 |
|
|
|
429.1 |
|
|
|
265.9 |
|
|
|
1,566.9 |
|
|
|
1,461.9 |
|
|
|
890.1 |
|
| U.S. Wind Facilities: |
|
|
|
|
|
|
|
|
|
|
|
|
|
|
|
|
|
|
|
|
|
|
|
|
| Sandy Ridge |
|
|
43.6 |
|
|
|
11.7 |
|
|
|
41.7 |
|
|
|
158.3 |
|
|
|
105.5 |
|
|
|
134.8 |
|
| Minonk |
|
|
189.8 |
|
|
|
208.5 |
|
|
|
194.7 |
|
|
|
673.7 |
|
|
|
696.9 |
|
|
|
622.1 |
|
| Senate |
|
|
140.0 |
|
|
|
114.2 |
|
|
|
144.1 |
|
|
|
520.4 |
|
|
|
490.0 |
|
|
|
480.5 |
|
| Shady Oaks |
|
|
100.5 |
|
|
|
114.9 |
|
|
|
100.7 |
|
|
|
355.6 |
|
|
|
362.2 |
|
|
|
319.2 |
|
| Odell |
|
|
238.0 |
|
|
|
250.9 |
|
|
|
214.7 |
|
|
|
831.8 |
|
|
|
869.3 |
|
|
|
720.3 |
|
| Deerfield |
|
|
167.9 |
|
|
|
168.8 |
|
|
|
150.8 |
|
|
|
546.0 |
|
|
|
554.9 |
|
|
|
515.9 |
|
| Sugar Creek4 |
|
|
212.6 |
|
|
|
193.0 |
|
|
|
189.4 |
|
|
|
724.8 |
|
|
|
661.4 |
|
|
|
426.4 |
|
| Maverick Creek5 |
|
|
480.2 |
|
|
|
362.6 |
|
|
|
483.0 |
|
|
|
1,920.6 |
|
|
|
1,620.9 |
|
|
|
1,519.2 |
|
| |
|
|
1,572.6 |
|
|
|
1,424.6 |
|
|
|
1,519.1 |
|
|
|
5,731.2 |
|
|
|
5,361.1 |
|
|
|
4,738.4 |
|
| Solar Facilities: |
|
|
|
|
|
|
|
|
|
|
|
|
|
|
|
|
|
|
|
|
|
|
|
|
| Cornwall |
|
|
2.2 |
|
|
|
2.4 |
|
|
|
2.1 |
|
|
|
14.7 |
|
|
|
14.7 |
|
|
|
14.6 |
|
| Bakersfield |
|
|
13.0 |
|
|
|
9.9 |
|
|
|
9.1 |
|
|
|
77.2 |
|
|
|
67.2 |
|
|
|
66.0 |
|
| Great Bay |
|
|
37.6 |
|
|
|
44.1 |
|
|
|
40.8 |
|
|
|
205.7 |
|
|
|
214.7 |
|
|
|
208.4 |
|
| Altavista6 |
|
|
31.4 |
|
|
|
33.0 |
|
|
|
32.1 |
|
|
|
164.4 |
|
|
|
167.7 |
|
|
|
127.5 |
|
| Croton7 |
|
|
0.9 |
|
|
|
1.1 |
|
|
|
0.2 |
|
|
|
5.4 |
|
|
|
5.4 |
|
|
|
0.2 |
|
| |
|
|
85.1 |
|
|
|
90.5 |
|
|
|
84.3 |
|
|
|
467.4 |
|
|
|
469.7 |
|
|
|
416.7 |
|
| Renewable Energy Performance |
|
|
2,294.7 |
|
|
|
2,104.6 |
|
|
|
2,011.3 |
|
|
|
8,372.4 |
|
|
|
7,901.9 |
|
|
|
6,577.1 |
|
| |
|
|
|
|
|
|
|
|
|
|
|
|
|
|
|
|
|
|
|
|
|
|
|
|
| Thermal Facilities: |
|
|
|
|
|
|
|
|
|
|
|
|
|
|
|
|
|
|
|
|
|
|
|
|
| Windsor Locks |
|
|
N/A |
8 |
|
|
29.7 |
|
|
|
31.0 |
|
|
|
N/A |
7 |
|
|
127.5 |
|
|
|
128.8 |
|
| Sanger |
|
|
N/A |
8 |
|
|
— |
|
|
|
34.5 |
|
|
|
N/A |
7 |
|
|
149.1 |
|
|
|
145.4 |
|
| |
|
|
|
|
|
|
29.7 |
|
|
|
65.5 |
|
|
|
|
|
|
|
276.6 |
|
|
|
274.2 |
|
| Total Performance |
|
|
|
|
|
|
2,134.3 |
|
|
|
2,076.8 |
|
|
|
|
|
|
|
8,178.5 |
|
|
|
6,851.3 |
|
ALGONQUIN | LIBERTY
| 1 |
AQN owns a 75% equity interest but accounts for the facility using the equity method. Figures show full energy produced by the facility. |
| 2 |
The Blue Hill Wind Facility achieved COD on April 14, 2022. AQN owns a 20% equity interest but accounts for the facility using the equity method. Figures show expected
long-term average resources (“LTAR”) and actual energy produced by the facility during the quarter. |
| 3 |
The EBR Wind Facility achieved COD on December 31, 2021. AQN owns a 50% equity interest but accounts for the facility using the equity method. Figures show full energy
produced by the facility. |
| 4 |
The Sugar Creek Wind Facility achieved COD on November 9, 2020. Prior to January 29, 2021, AQN owned a 50% equity interest in the facility. On January 29, 2021, AQN
acquired the remaining 50% equity interest that it did not previously own. Figures show full energy produced by the facility. As a result of a blade manufacturing error 26 of 40 turbines were initially shut down. All impacted turbines were back
in service as of September 29, 2021. |
| 5 |
The Maverick Creek Wind Facility achieved partial completion on November 6, 2020 and COD on April 21, 2021. Prior to January 19, 2021, AQN owned a 50% equity interest in
the facility. On January 19, 2021, AQN acquired the remaining 50% equity interest that it did not previously own. Figures show full energy produced by the facility. As a result of a blade manufacturing error 26 of 73 turbines were initially
shut down. All impacted turbines were back in service as of June 7, 2021. |
| 6 |
The Altavista Solar Facility achieved partial completion on March 8, 2021 and COD on June 1, 2021. Prior to April 9, 2021, AQN owned a 50% equity interest in the facility.
On April 9, 2021, AQN acquired the remaining 50% equity interest that it did not previously own. Figures show full energy produced by the facility. |
| 7 |
The Croton Solar Facility achieved COD on December 8, 2021. |
| 8 |
Natural gas fired co-generation facility. |
2022 Fourth Quarter Renewable Energy Group Performance
For the three months ended December 31, 2022, the Renewable Energy
Group generated 2,134.3 GW-hrs of electricity as compared to 2,076.8 GW-hrs during the same period in 2021.
For the three months ended December 31, 2022, the hydro facilities
generated 160.4 GW-hrs of electricity as compared to 142.0 GW-hrs produced in the same period in 2021, an increase of 13.0%. Electricity generated represented 107.7% of LTAR as compared to 95.3% during the same period in 2021.
For the three months ended December 31, 2022, the wind facilities
produced 1,853.7 GW-hrs of electricity as compared to 1,785.0 GW-hrs produced in the same period in 2021, an increase of 3.8%. The increase in production is primarily due to the addition of the EBR Wind Facility which achieved COD on December 31,
2021, and the Blue Hill Wind Facility which achieved COD on April 14, 2022. Excluding the Sugar Creek, EBR, and Blue Hill Wind Facilities, production was 6.0% below the same period last year. The wind facilities, including new facilities, generated
electricity equal to 90.0% of LTAR as compared to 97.1% during the same period in 2021.
For the three months ended December 31, 2022, the solar facilities
generated 90.5 GW-hrs of electricity as compared to 84.3 GW-hrs of electricity in the same period in 2021, an increase of 7.4%. The increase in production is partially due to the Croton Solar Facility achieving COD on December 8, 2021. Excluding the
new facilities, production was 6.3% above the same period last year. The solar facilities, including new facilities, generated electricity equal to 106.3% of LTAR as compared to 99.9% in the same period in 2021.
For the three months ended December 31, 2022, the thermal facilities
generated 29.7 GW-hrs of electricity as compared to 65.5 GW-hrs of electricity during the same period in 2021. During the same period, the Windsor Locks Thermal Facility generated 130.5 billion lbs of steam as compared to 132.1 billion lbs of steam
during the same period in 2021.
| Management Discussion & Analysis |
29 |
2022 Annual Renewable Energy Group Performance
For the twelve months ended December 31, 2022, the Renewable Energy
Group generated 8,178.5 GW-hrs of electricity as compared to 6,851.3 GW-hrs during the same period in 2021.
For the twelve months ended December 31, 2022, the hydro facilities
generated 609.2 GW-hrs of electricity as compared to 531.9 GW-hrs produced in the same period in 2021, an increase of 14.5%. Electricity generated represented 100.4% of LTAR as compared to 87.6% during the same period in 2021.
For the twelve months ended December 31, 2022, the wind facilities
produced 6,823.0 GW-hrs of electricity as compared to 5,628.5 GW-hrs produced in the same period in 2021, an increase of 21.2%. The increase in production is primarily due to the addition of the Maverick Creek Wind Facility which achieved COD on
April 21, 2021, the EBR Wind Facility which achieved COD on December 31, 2021, and the Blue Hill Wind Facility which achieved COD on April 14, 2022. In addition, the Sugar Creek Wind Facility and the Maverick Creek Wind Facility experienced lower
production in 2021 due to the shutdown of turbines resulting from a blade manufacturing error. Excluding the new facilities, production was 8.8% above the same period last year. The wind facilities generated electricity equal to 93.5% of LTAR as
compared to 90.1% during the same period in 2021.
For the twelve months ended December 31, 2022, the solar facilities
generated 469.7 GW-hrs of electricity as compared to 416.7 GW-hrs of electricity produced in the same period in 2021, an increase of 12.7%. The increase in production is primarily due to the Altavista Solar Facility which achieved partial completion
on March 8, 2021 and COD on June 1, 2021. In addition, the Croton Solar Facility achieved COD on December 8, 2021. Excluding the new facilities, production was 2.6% above the same period last year. The solar facilities generated electricity equal to
100.5% of LTAR as compared to 95.3% in the same period in 2021.
For the twelve months ended December 31, 2022, the thermal facilities
generated 276.6 GW-hrs of electricity as compared to 274.2 GW-hrs of electricity during the same period in 2021. For the twelve months ended December 31, 2022, the Windsor Locks Thermal Facility generated 520.3 billion lbs of steam as compared to
507.0 billion lbs of steam during the same period in 2021.
ALGONQUIN | LIBERTY
2022 Renewable Energy Group Operating Results
| |
|
Three months ended
December 31 |
|
|
Twelve months ended
December 31 |
|
| (all dollar amounts in $ millions) |
|
2022 |
|
|
2021 |
|
|
2022 |
|
|
2021 |
|
| Revenue1 |
|
|
|
|
|
|
|
|
|
|
|
|
|
|
|
|
| Hydro |
|
$ |
11.7 |
|
|
$ |
8.5 |
|
|
$ |
51.6 |
|
|
$ |
36.8 |
|
| Wind |
|
|
65.9 |
|
|
|
59.8 |
|
|
|
221.4 |
|
|
|
156.4 |
|
| Solar |
|
|
2.8 |
|
|
|
5.6 |
|
|
|
29.9 |
|
|
|
26.9 |
|
| Thermal |
|
|
8.2 |
|
|
|
9.0 |
|
|
|
48.0 |
|
|
|
36.5 |
|
| Total Non-Regulated Energy Sales |
|
$ |
88.6 |
|
|
$ |
82.9 |
|
|
$ |
350.9 |
|
|
$ |
256.6 |
|
| Less: |
|
|
|
|
|
|
|
|
|
|
|
|
|
|
|
|
| Cost of Sales - Energy2 |
|
|
(0.2 |
) |
|
|
(1.5 |
) |
|
|
(7.2 |
) |
|
|
(7.3 |
) |
| Cost of Sales - Thermal |
|
|
(5.2 |
) |
|
|
(7.0 |
) |
|
|
(34.5 |
) |
|
|
(23.9 |
) |
| Net Energy Sales 3,4 |
|
$ |
83.2 |
|
|
$ |
74.4 |
|
|
$ |
309.2 |
|
|
$ |
225.4 |
|
| Renewable Energy Credits5 |
|
|
7.6 |
|
|
|
3.7 |
|
|
|
27.8 |
|
|
|
17.5 |
|
| Other Revenue |
|
|
0.3 |
|
|
|
0.1 |
|
|
|
0.6 |
|
|
|
0.8 |
|
| Total Net Revenue |
|
$ |
91.1 |
|
|
$ |
78.2 |
|
|
$ |
337.6 |
|
|
$ |
243.7 |
|
| Expenses & Other Income |
|
|
|
|
|
|
|
|
|
|
|
|
|
|
|
|
| Operating expenses |
|
|
(31.7 |
) |
|
|
(24.8 |
) |
|
|
(114.5 |
) |
|
|
(104.3 |
) |
| Gain on sale of renewable assets |
|
|
62.8 |
|
|
|
29.1 |
|
|
|
64.0 |
|
|
|
29.1 |
|
| Dividend, interest, equity and other income6 |
|
|
21.6 |
|
|
|
13.5 |
|
|
|
91.2 |
|
|
|
84.0 |
|
| Impacts from the Market Disruption Event on the Senate Wind Facility |
|
|
— |
|
|
|
— |
|
|
|
— |
|
|
|
53.4 |
|
| HLBV income7 |
|
|
19.4 |
|
|
|
27.2 |
|
|
|
93.9 |
|
|
|
77.7 |
|
| Divisional Operating Profit3,8,9 |
|
$ |
163.2 |
|
|
$ |
123.2 |
|
|
$ |
472.2 |
|
|
$ |
383.6 |
|
| 1 |
Many of the Renewable Energy Group’s power purchase agreements (“PPAs”) include annual rate increases. However, a change to the weighted average production levels resulting
from higher average production from facilities that earn lower energy rates can result in a lower weighted average energy rate earned by the division as compared to the same period in the prior year. Includes the impacts from the Market
Disruption Event on the Senate Wind Facility. |
| 2 |
Cost of Sales - Energy consists of energy purchases in the Maritime Region to manage the energy sales from the Tinker Hydro Facility which is sold to retail and industrial
customers under multi-year contracts. |
| 3 |
See Caution Concerning Non-GAAP Measures. |
| 4 |
This table contains a reconciliation of Net Energy Sales to revenue. The relevant sections of the table are derived from and should be read in conjunction with the
consolidated statement of operations and Note 21 in the annual consolidated financial statements, “Segmented information”. This supplementary disclosure is intended to more fully explain disclosures related to Net Energy Sales and
provides additional information related to the operating performance of AQN. Investors are cautioned that Net Energy Sales should not be construed as an alternative to revenue. |
| 5 |
Qualifying renewable energy projects receive RECs for the generation and delivery of renewable energy to the power grid. The RECs represent proof that 1 MW-hr of
electricity was generated from an eligible energy source. |
| 6 |
Includes dividends received from Atlantica and related parties (see Notes 8 and 16 in the annual consolidated financial statements) as well as the equity investment
in the Stella, Cranell, East Raymond and West Raymond Wind Facilities (collectively, the “Texas Coastal Wind Facilities”). |
| 7 |
HLBV income represents the value of net tax attributes earned by the Renewable Energy Group in the period primarily from electricity generated by certain of its U.S. wind
and U.S. solar generation facilities. |
PTCs are earned as wind energy is generated based
on a dollar per kW-hr rate prescribed in applicable federal and state statutes. For the twelve months ended December 31, 2022, the Renewable Energy Group’s eligible facilities generated 4,998.9 GW-hrs representing approximately $125.0 million in PTCs
earned as compared to 2,473.6 GW-hrs representing $61.8 million in PTCs earned during the same period in 2021. The majority of the PTCs have been allocated to tax equity investors to monetize the value to AQN of the PTCs and other tax attributes
which are the primary drivers of HLBV income offset by the return earned by the investor. Some PTCs have been utilized directly by the Company to lower its overall effective tax rate.
| 8 |
Certain prior year items have been reclassified to conform to current year presentation. |
| 9 |
This table contains a reconciliation of Divisional Operating Profit to revenue for the Renewable Energy Group. The relevant sections of the table are derived from and
should be read in conjunction with the consolidated statement of operations and Note 21 in the annual consolidated financial statements, “Segmented Information”. This supplementary disclosure is intended to more fully explain
disclosures related to Divisional Operating Profit and provides additional information related to the operating performance of the Renewable Energy Group. Investors are cautioned that Divisional Operating Profit should not be construed as an
alternative to revenue. |
| Management Discussion & Analysis |
31 |
2022 Fourth Quarter Operating Results
For the three months ended December 31, 2022, the Renewable Energy
Group’s facilities generated operating revenue of $88.6 million (i.e., non-regulated energy sales) as compared to $82.9 million in the comparable period in the prior year.
For the three months ended December 31, 2022, the Renewable Energy
Group’s facilities generated $163.2 million of Divisional Operating Profit as compared to $123.2 million during the same period in 2021, which represents an increase of $40.0 million or 32.5% (see Caution Concerning Non-GAAP Measures).
Highlights of the changes are summarized in the following table:
| (all dollar amounts in $ millions) |
|
Three months ended December 31 |
|
| Prior Period Divisional Operating Profit1 |
|
$ |
123.2 |
|
| Existing Facilities and Investments |
|
|
|
|
| Hydro: Increase is primarily due to higher overall production. |
|
|
1.6 |
|
| Wind Canada: Increase is primarily due to higher production at the St. Damase and Amherst Island Wind Facilities. |
|
|
1.0 |
|
| Wind US: Decrease is primarily due to lower HLBV income as a result of lower production, and higher operating expenses across the U.S. wind facilities partially offset by
favourable renewable energy certificate (“REC”) revenue, favourable energy market pricing, as well as higher availability revenue at the Maverick and Sugar Creek Wind Facilities. |
|
|
(5.2 |
) |
| Solar: Decrease is primarily due to unfavourable weather conditions at the Great Bay I, Great Bay II, and Altavista Solar Facilities. |
|
|
(1.2 |
) |
| Thermal: Increase is primarily driven by favourable energy market pricing at the Windsor Locks Thermal Facility. |
|
|
0.7 |
|
| Investments: Decrease is primarily due to timing of dividends from the Company’s investments.2 |
|
|
(0.9 |
) |
| Other: Increase is primarily due to higher equity income from the Texas Coastal Wind Facilities and the Val-Eo Wind Facility. |
|
|
13.5 |
|
| |
|
|
9.5 |
|
| New Facilities and Investments |
|
|
|
|
| Solar: Increase is primarily due to Croton Solar Facility (full COD in December 2021). |
|
|
0.3 |
|
| Other: Decrease is primarily due to start-up costs at the RNG facilities. |
|
|
(1.6 |
) |
| |
|
|
(1.3 |
) |
| Asset Dispositions |
|
|
33.7 |
|
| Foreign Exchange |
|
|
(1.9 |
) |
| Current Period Divisional Operating Profit1 |
|
$ |
163.2 |
|
|
1 |
See Caution Concerning Non-GAAP Measures. |
|
2 |
See Notes 8 and 16 in the annual consolidated financial statements. |
ALGONQUIN | LIBERTY
2022 Annual Operating Results
For the twelve months ended December 31, 2022, the Renewable Energy
Group’s facilities generated operating revenue of $350.9 million (i.e., non-regulated energy sales) as compared to $256.6 million in the comparable period in the prior year.
For the twelve months ended December 31, 2022, the Renewable Energy
Group’s facilities generated $472.2 million of Divisional Operating Profit as compared to $383.6 million during the same period in 2021, which represents an increase of $88.6 million or 23.1% (see Caution Concerning Non-GAAP Measures).
Highlights of the changes are summarized in the following table:
| (all dollar amounts in $ millions) |
|
Twelve months ended December 31 |
|
| Prior Period Divisional Operating Profit1 |
|
$ |
383.6 |
|
| Existing Facilities |
|
|
|
|
| Hydro: Increase is primarily due to higher overall production as well as favourable pricing at one of the Company’s hydro facilities. |
|
|
4.6 |
|
| Wind Canada: Increase is primarily due to higher overall production. |
|
|
4.8 |
|
| Wind U.S.: Increase is primarily due to higher production, favourable energy market pricing, REC revenue and HLBV income. |
|
|
19.3 |
|
| Solar: Increase is primarily due to favourable REC revenue at the Great Bay I Solar Facility. |
|
|
0.7 |
|
| Thermal: Increase is primarily due to favourable overall energy market pricing and favourable REC revenue at the Windsor Locks Thermal Facility. |
|
|
1.7 |
|
| Investments: Increase is primarily due to higher dividends from AQN’s investment in Atlantica.2 |
|
|
5.7 |
|
| Other: Increase is primarily due to higher equity income from the Val-Eo Wind Facility. |
|
|
8.2 |
|
| |
|
|
45.0 |
|
| New Facilities and Investments |
|
|
|
|
| Wind U.S.: Increase is primarily due to higher production, higher HLBV income partially offset by unfavourable pricing at the Maverick Creek Wind Facility. This facility
achieved partial completion on November 6, 2020 and COD on April 21, 2021. |
|
|
11.3 |
|
| Solar: Increase is primarily due to the Great Bay II Solar Facility (full COD in August 2020), the Altavista Solar Facility (full COD in June 2021), and the Croton Solar
Facility (full COD in December 2021). |
|
|
2.3 |
|
| Other: Decrease is primarily due to start-up costs at the RNG facilities. |
|
|
(1.1 |
) |
| |
|
|
12.5 |
|
| Asset Dispositions |
|
|
34.9 |
|
| Foreign Exchange |
|
|
(3.8 |
) |
| Current Period Divisional Operating Profit1 |
|
$ |
472.2 |
|
|
1 |
See Caution Concerning Non-GAAP Measures. |
|
2 |
See Notes 8 and 16 in the annual consolidated financial statements. |
| Management Discussion & Analysis |
33 |
AQN: CORPORATE AND OTHER EXPENSES
| |
|
Three months ended
December 31 |
|
|
Twelve months ended
December 31 |
|
| (all dollar amounts in $ millions) |
|
2022 |
|
|
2021 |
|
|
2022 |
|
|
2021 |
|
| Corporate and other expenses: |
|
|
|
|
|
|
|
|
|
|
|
|
|
|
|
|
| Administrative expenses |
|
$ |
21.2 |
|
|
$ |
17.8 |
|
|
$ |
80.2 |
|
|
$ |
66.7 |
|
| Loss on foreign exchange |
|
|
14.1 |
|
|
|
1.0 |
|
|
|
13.8 |
|
|
|
4.4 |
|
| Interest expense |
|
|
78.0 |
|
|
|
50.1 |
|
|
|
278.6 |
|
|
|
209.6 |
|
| Depreciation and amortization |
|
|
114.8 |
|
|
|
110.8 |
|
|
|
455.5 |
|
|
|
403.0 |
|
| Change in value of investments carried at fair value |
|
|
14.7 |
|
|
|
(61.0 |
) |
|
|
499.1 |
|
|
|
122.4 |
|
| Interest, dividend, equity, and other loss1 |
|
|
17.7 |
|
|
|
0.6 |
|
|
|
3.2 |
|
|
|
6.4 |
|
| Pension and other post-employment non-service costs |
|
|
4.6 |
|
|
|
4.9 |
|
|
|
11.0 |
|
|
|
16.3 |
|
| Other net losses |
|
|
2.1 |
|
|
|
11.9 |
|
|
|
21.4 |
|
|
|
22.9 |
|
| Gain on derivative financial instruments |
|
|
(6.4 |
) |
|
|
(1.1 |
) |
|
|
(4.4 |
) |
|
|
(4.4 |
) |
| Income tax expense (recovery) |
|
|
(28.6 |
) |
|
|
1.8 |
|
|
|
(61.5 |
) |
|
|
(43.4 |
) |
| 1 |
Excludes income directly pertaining to the Regulated Services and Renewable Energy Groups (disclosed in the relevant sections). |
2022 Fourth Quarter Corporate and Other Expenses
For the three months ended December 31, 2022, administrative expenses
totaled $21.2 million as compared to $17.8 million in the same period in 2021. The increase was primarily due to higher staffing expenses as a result of increased headcount to support growth initiatives and drive operational excellence, and
inflationary increases.
For the three months ended December 31, 2022, interest expense totaled
$78.0 million as compared to $50.1 million in the same period in 2021 due to the funding of capital deployed in 2022 primarily related to the acquisition of Liberty NY Water and the development of renewable energy projects as well as an increase in
interest rates on variable rate borrowings.
For the three months ended December 31, 2022, depreciation expense
totaled $114.8 million as compared to $110.8 million in the same period in 2021. The increase was primarily due to higher overall property, plant and equipment and the acquisition of Liberty NY Water.
For the three months ended December 31, 2022, change in investments
carried at fair value totaled a loss of $14.7 million as compared to a gain of $61.0 million in the same period in 2021. The Company records certain of its investments, including Atlantica, using the fair value method and accordingly any change in
the fair value of the investment is recorded in the consolidated statement of operations (see Note 8 in the annual consolidated financial statements).
For the three months ended December 31, 2022, pension and
post-employment non-service costs totaled $4.6 million as compared to $4.9 million in the same period in 2021. The decrease was primarily due to lower amortization of actuarial losses.
For the three months ended December 31, 2022, other net losses were
$2.1 million as compared to $11.9 million in the same period in 2021. The decrease was primarily due to timing of acquisition and transition-related costs. See Note 19 in the annual consolidated financial statements.
For the three months ended December 31, 2022, the gain on derivative
financial instruments totaled $6.4 million as compared to a gain of $1.1 million in the same period in 2021. AQN uses derivative instruments to manage exposure to changes in commodity prices, foreign exchange rates, and interest rates. The gain in
the fourth quarter of both 2022 and 2021 was primarily related to mark-to-markets on interest rate derivatives.
For the three months ended December 31, 2022, an income tax recovery of
$28.6 million was recorded as compared to an income tax expense of $1.8 million during the same period in 2021. The decrease in income tax expense was primarily due to the tax benefits associated with the 2022 Impairment and the change in fair value
of the investment in Atlantica. These tax recoveries were partially offset by the valuation allowance recorded on the Renewable Energy Group and lower tax credits accrued. For the three months ended December 31, 2022, the Company accrued $4.7 million
of ITCs and PTCs primarily associated with renewable energy projects that were placed in service by the end of 2022 as compared to $14.1 million recorded in the same period in 2021.
ALGONQUIN | LIBERTY
2022 Annual Corporate and Other Expenses
During the twelve months ended December 31, 2022, administrative
expenses totaled $80.2 million as compared to $66.7 million in the same period in 2021. The increase was primarily due to higher staffing expenses as a result of increased headcount to support growth initiatives and drive operational excellence, and
inflationary increases.
For the twelve months ended December 31, 2022, interest expense totaled
$278.6 million as compared to $209.6 million in the same period in 2021. The increase was primarily due to the funding of capital deployed in 2022 primarily related to the acquisition of Liberty NY Water and the development of renewable energy
projects as well as an increase in interest rates on variable rate borrowings.
For the twelve months ended December 31, 2022, depreciation expense
totaled $455.5 million as compared to $403.0 million in the same period in 2021. The increase was primarily due to higher overall property, plant and equipment and the acquisition of Liberty NY Water.
For the twelve months ended December 31, 2022, change in investments
carried at fair value totaled a loss of $499.1 million as compared to a loss of $122.4 million in the same period in 2021. The Company records certain of its investments, including Atlantica, using the fair value method and accordingly any change in
the fair value of the investment is recorded in the consolidated statement of operations (see Note 8 in the annual consolidated financial statements).
For the twelve months ended December 31, 2022, pension and
post-employment non-service costs totaled $11.0 million as compared to $16.3 million in the same period in 2021. The decrease was primarily due to lower amortization of actuarial losses.
For the twelve months ended December 31, 2022, other net losses were
$21.4 million as compared to $22.9 million in the same period in 2021. The net losses for the twelve months ended December 31, 2022 were primarily due acquisition and transition-related costs. The net losses for the twelve months ended December 31,
2021 were primarily due to acquisition and transition-related costs, an adjustment to a regulatory liability pertaining to the true-up of prior period tracking accounts and certain asset write-downs.
For the twelve months ended December 31, 2022, the gain on derivative
financial instruments totaled $4.4 million as compared to a gain of $4.4 million in the same period in 2021. AQN uses derivative instruments to manage exposure to changes in commodity prices, foreign exchange rates, and interest rates. The gain for
both the twelve months ended December 31, 2022 and for the twelve months ended December 31, 2021 were primarily related to mark-to-markets on interest rate derivatives.
For the twelve months ended December 31, 2022, an income tax recovery
of $61.5 million was recorded as compared to an income tax recovery of $43.4 million during the same period in 2021. The increase in income tax recovery was primarily due to the tax benefits associated with the 2022 Impairment and change in fair
value of the investment in Atlantica. These tax recoveries were partially offset by the valuation allowance recorded on the Renewable Energy Group, lower tax credits accrued, the tax impact of the Midwest Extreme Weather Event in 2021, and
remeasurement of state deferred tax adjustments related to the acquisition of Liberty NY Water. For the twelve months ended December 31, 2022, the Company accrued $18.4 million of ITCs and PTCs primarily associated with renewable energy projects that
were placed in service by the end of 2022 as compared to $49.4 million recorded in the same period in 2021.
| Management Discussion & Analysis |
35 |
NON-GAAP FINANCIAL MEASURES
Reconciliation of Adjusted EBITDA to Net Earnings
The following table is derived from and should be read in conjunction
with the consolidated statement of operations. This supplementary disclosure is intended to more fully explain disclosures related to Adjusted EBITDA and provides additional information related to the operating performance of AQN. Investors are
cautioned that this measure should not be construed as an alternative to U.S. GAAP consolidated net earnings.
| |
|
Three months ended
December 311 |
|
|
Twelve months ended
December 31 |
|
| (all dollar amounts in $ millions) |
|
2022 |
|
|
2021 |
|
|
2022 |
|
|
2021 |
|
| Net earnings (loss) attributable to shareholders |
|
$ |
(74.4 |
) |
|
$ |
175.6 |
|
|
$ |
(212.0 |
) |
|
$ |
264.9 |
|
| Add (deduct): |
|
|
|
|
|
|
|
|
|
|
|
|
|
|
|
|
| Net earnings attributable to the non-controlling interest, exclusive of HLBV |
|
|
6.0 |
|
|
|
2.3 |
|
|
|
18.9 |
|
|
|
16.1 |
|
| Income tax expense (recovery) |
|
|
(28.6 |
) |
|
|
1.8 |
|
|
|
(61.5 |
) |
|
|
(43.4 |
) |
| Interest expense |
|
|
78.0 |
|
|
|
50.1 |
|
|
|
278.6 |
|
|
|
209.6 |
|
| Other net losses2 |
|
|
2.1 |
|
|
|
11.9 |
|
|
|
21.4 |
|
|
|
22.9 |
|
| Unrealized loss (gain) on energy derivatives included in revenue |
|
|
(2.1 |
) |
|
|
0.6 |
|
|
|
0.9 |
|
|
|
5.4 |
|
| Asset impairment charge |
|
|
159.6 |
|
|
|
— |
|
|
|
159.6 |
|
|
|
— |
|
| Impairment of equity-method investee |
|
|
75.9 |
|
|
|
— |
|
|
|
75.9 |
|
|
|
— |
|
| Pension and post-employment non-service costs |
|
|
4.6 |
|
|
|
4.9 |
|
|
|
11.0 |
|
|
|
16.3 |
|
| Change in value of investments carried at fair value3 |
|
|
14.7 |
|
|
|
(61.0 |
) |
|
|
499.1 |
|
|
|
122.4 |
|
| Impacts from the Market Disruption Event on the Senate Wind |
|
|
|
|
|
|
|
|
|
|
|
|
|
|
|
|
| Facility |
|
|
— |
|
|
|
— |
|
|
|
— |
|
|
|
53.4 |
|
| Costs related to tax equity financing |
|
|
— |
|
|
|
1.4 |
|
|
|
— |
|
|
|
5.7 |
|
| Gain on derivative financial instruments |
|
|
(6.4 |
) |
|
|
(1.1 |
) |
|
|
(4.4 |
) |
|
|
(4.4 |
) |
| Loss on foreign exchange |
|
|
14.1 |
|
|
|
1.0 |
|
|
|
13.8 |
|
|
|
4.4 |
|
| Depreciation and amortization |
|
|
114.8 |
|
|
|
110.8 |
|
|
|
455.5 |
|
|
|
403.0 |
|
| Adjusted EBITDA4 |
|
$ |
358.3 |
|
|
$ |
298.3 |
|
|
$ |
1,256.8 |
|
|
$ |
1,076.3 |
|
| 1 |
Amounts for the three months ended December 31, 2022 and 2021 are derived by subtracting the Company’s results for the nine months ended September 30, 2022 and 2021 from
the Company’s 2022 and 2021 annual results, respectively. |
| 2 |
See Note 19 in the annual consolidated financial statements. |
| 3 |
See Note 8 in the annual consolidated financial statements. |
| 4 |
Amounts for the three and twelve months ended December 31, 2022 include $62.8 million and $64.0 million, respectively, in gains from asset dispositions. Amounts for the
three and twelve months ended December 31, 2021 include $29.1 million and $29.1 million, respectively, in gains from asset dispositions. |
ALGONQUIN | LIBERTY
Reconciliation of Adjusted Net Earnings to Net Earnings
The following table is derived from and should be read in conjunction
with the consolidated statement of operations. This supplementary disclosure is intended to more fully explain disclosures related to Adjusted Net Earnings and provides additional information related to the operating performance of AQN. Investors are
cautioned that this measure should not be construed as an alternative to consolidated net earnings in accordance with U.S. GAAP.
The following table shows the reconciliation of net earnings to Adjusted Net Earnings
exclusive of these items:
| |
|
Three months ended
December 311 |
|
|
Twelve months ended
December 31 |
|
| (all dollar amounts in $ millions except per share information) |
|
2022 |
|
|
2021 |
|
|
2022 |
|
|
2021 |
|
| Net earnings (loss) attributable to shareholders |
|
$ |
(74.4 |
) |
|
$ |
175.6 |
|
|
$ |
(212.0 |
) |
|
$ |
264.9 |
|
| Add (deduct): |
|
|
|
|
|
|
|
|
|
|
|
|
|
|
|
|
| Gain on derivative financial instruments |
|
|
(6.4 |
) |
|
|
(1.1 |
) |
|
|
(4.4 |
) |
|
|
(4.4 |
) |
| Other net losses2 |
|
|
2.1 |
|
|
|
11.9 |
|
|
|
21.4 |
|
|
|
22.9 |
|
| Asset impairment charge |
|
|
159.6 |
|
|
|
— |
|
|
|
159.6 |
|
|
|
— |
|
| Impairment of equity-method investee |
|
|
75.9 |
|
|
|
— |
|
|
|
75.9 |
|
|
|
— |
|
| Loss on foreign exchange |
|
|
14.1 |
|
|
|
1.0 |
|
|
|
13.8 |
|
|
|
4.4 |
|
| Unrealized loss (gain) on energy derivatives included in revenue |
|
|
(2.1 |
) |
|
|
0.6 |
|
|
|
0.9 |
|
|
|
5.4 |
|
| Change in value of investments carried at fair value3 |
|
|
14.7 |
|
|
|
(61.0 |
) |
|
|
499.1 |
|
|
|
122.4 |
|
| Impacts from the Market Disruption Event on the Senate Wind |
|
|
|
|
|
|
|
|
|
|
|
|
|
|
|
|
| Facility |
|
|
— |
|
|
|
— |
|
|
|
— |
|
|
|
53.4 |
|
| Costs related to tax equity financing and other adjustments |
|
|
— |
|
|
|
1.4 |
|
|
|
— |
|
|
|
5.7 |
|
| Adjustment for taxes related to above |
|
|
(32.5 |
) |
|
|
8.6 |
|
|
|
(79.4 |
) |
|
|
(25.7 |
) |
| Adjusted Net Earnings4 |
|
$ |
151.0 |
|
|
$ |
137.0 |
|
|
$ |
474.9 |
|
|
$ |
449.0 |
|
| Adjusted Net Earnings per common share |
|
$ |
0.22 |
|
|
$ |
0.21 |
|
|
$ |
0.69 |
|
|
$ |
0.71 |
|
| 1 |
Amounts for the three months ended December 31, 2022 and 2021 are derived by subtracting the Company’s results for the nine months ended September 30, 2022 and 2021 from
the Company’s 2022 and 2021 annual results, respectively. |
| 2 |
See Note 19 in the annual consolidated financial statements. |
| 3 |
See Note 8 in the annual consolidated financial statements. |
| 4 |
Amounts for the three and twelve months ended December 31, 2022 include $53.4 million and $54.3 million, respectively, in gains from asset dispositions after tax. Amounts
for the three and twelve months ended December 31, 2021 include $21.1 million and $21.1 million, respectively, in gains from asset dispositions after tax. |
For the three months ended December 31, 2022, Adjusted Net Earnings
totaled $151.0 million as compared to Adjusted Net Earnings of $137.0 million for the same period in 2021, an increase of $14.0 million.
For the twelve months ended December 31, 2022, Adjusted Net Earnings
totaled $474.9 million as compared to Adjusted Net Earnings of $449.0 million for the same period in 2021, an increase of $25.9 million.
| Management Discussion & Analysis |
37 |
Reconciliation of Adjusted Funds from Operations to Cash Provided by Operating Activities
The following table is derived from and should be read in conjunction
with the consolidated statement of operations and consolidated statement of cash flows. This supplementary disclosure is intended to more fully explain disclosures related to Adjusted Funds from Operations and provides additional information related
to the operating performance of AQN. Investors are cautioned that this measure should not be construed as an alternative to cash provided by operating activities in accordance with U.S GAAP.
The following table shows the reconciliation of cash provided by
operating activities to Adjusted Funds from Operations exclusive of these items:
| |
|
Three months ended
December 311 |
|
|
Twelve months ended
December 31 |
|
| (all dollar amounts in $ millions) |
|
2022 |
|
|
2021 |
|
|
2022 |
|
|
2021 |
|
| Cash provided by operating activities |
|
$ |
214.6 |
|
|
$ |
126.5 |
|
|
$ |
619.1 |
|
|
$ |
157.5 |
|
| Add (deduct): |
|
|
|
|
|
|
|
|
|
|
|
|
|
|
|
|
| Changes in non-cash operating items |
|
|
41.2 |
|
|
|
84.4 |
|
|
|
221.6 |
|
|
|
522.0 |
|
| Production based cash contributions from non-controlling interests |
|
|
— |
|
|
|
— |
|
|
|
6.2 |
|
|
|
4.8 |
|
| |
|
|
|
|
|
|
|
|
|
|
|
|
|
|
|
|
| Impacts from the Market Disruption Event on the Senate Wind Facility |
|
|
— |
|
|
|
— |
|
|
|
— |
|
|
|
53.4 |
|
| |
|
|
|
|
|
|
|
|
|
|
|
|
|
|
|
|
| Costs related to tax equity financing |
|
|
— |
|
|
|
0.5 |
|
|
|
(0.2 |
) |
|
|
5.7 |
|
| Acquisition-related costs |
|
|
2.6 |
|
|
|
9.8 |
|
|
|
17.4 |
|
|
|
14.5 |
|
| Adjusted Funds from Operations2 |
|
$ |
258.4 |
|
|
$ |
221.2 |
|
|
$ |
864.1 |
|
|
$ |
757.9 |
|
| 1 |
Amounts for the three months ended December 31, 2022 and 2021 are derived by subtracting the Company’s results for the nine months ended September 30, 2022 and 2021 from
the Company’s 2022 and 2021 annual results, respectively. |
| 2 |
Amounts for the three and twelve months ended December 31, 2022 include $62.8 million and $64.0 million, respectively, in gains from asset dispositions. Amounts for the
three and twelve months ended December 31, 2021 include $29.1 million and $29.1 million, respectively, in gains from asset dispositions. |
For the three months ended December 31, 2022, Adjusted Funds from
Operations totaled $258.4 million as compared to Adjusted Funds from Operations of $221.2 million for the same period in 2021, an increase of $37.2 million.
For the twelve months ended December 31, 2022, Adjusted Funds from
Operations totaled $864.1 million as compared to Adjusted Funds from Operations of $757.9 million for the same period in 2021, an increase of $106.2 million.
ALGONQUIN | LIBERTY
SUMMARY OF PROPERTY, PLANT, AND EQUIPMENT EXPENDITURES
| |
|
Three months ended
December 31 |
|
|
Twelve months ended
December 31 |
|
| (all dollar amounts in $ millions) |
|
2022 |
|
|
2021 |
|
|
2022 |
|
|
2021 |
|
| Regulated Services Group |
|
|
|
|
|
|
|
|
|
|
|
|
|
|
|
|
| Rate Base Maintenance1 |
|
|
78.5 |
|
|
$ |
73.5 |
|
|
|
316.5 |
|
|
|
279.3 |
|
| Rate Base Growth |
|
|
253.5 |
|
|
|
172.7 |
|
|
|
669.1 |
|
|
|
1,670.3 |
|
| Property, Plant & Equipment Acquired2 |
|
|
— |
|
|
|
— |
|
|
|
609.3 |
|
|
|
— |
|
| |
|
$ |
332.0 |
|
|
$ |
246.2 |
|
|
$ |
1,594.9 |
|
|
$ |
1,949.6 |
|
| Renewable Energy Group |
|
|
|
|
|
|
|
|
|
|
|
|
|
|
|
|
| Maintenance1 |
|
$ |
23.4 |
|
|
$ |
10.5 |
|
|
$ |
41.1 |
|
|
$ |
46.0 |
|
| Investment in Capital Projects2 |
|
|
80.0 |
|
|
|
24.9 |
|
|
|
135.5 |
|
|
|
1,676.3 |
|
| |
|
$ |
103.4 |
|
|
$ |
35.4 |
|
|
$ |
176.6 |
|
|
$ |
1,722.3 |
|
| |
|
|
|
|
|
|
|
|
|
|
|
|
|
|
|
|
| Total Capital Expenditures |
|
$ |
435.4 |
|
|
$ |
281.6 |
|
|
$ |
1,771.5 |
|
|
$ |
3,671.9 |
|
| 1 |
Maintenance expenditures are calculated based on the depreciation expense for the period. |
| 2 |
Includes expenditures on Property Plant & Equipment, equity-method investees, and acquisitions of operating entities that may have been
jointly developed by the Company with another third party developer. Excludes temporary advances to joint venture partners in connection with capital projects under development or construction. |
2022 Fourth Quarter Property Plant and Equipment Expenditures
During the three months ended December 31, 2022, the Regulated Services
Group invested $332.0 million in capital expenditures as compared to $246.2 million during the same period in 2021. The Regulated Services Group’s investments during the fourth quarter of 2022 were primarily related to the construction of
transmission and distribution main replacements, work on new and existing substation assets, and initiatives relating to the safety and reliability of electric and natural gas systems.
During the three months ended December 31, 2022, the Renewable Energy
Group incurred capital expenditures of $103.4 million as compared to $35.4 million during the same period in 2021. The Renewable Energy Group’s investments during the fourth quarter of 2022 were primarily related to the development and/or
construction of ongoing maintenance capital at existing operating sites.
2022 Annual Property Plant and Equipment Expenditures
During the twelve months ended December 31, 2022, the Regulated
Services Group invested $1,594.9 million in capital expenditures as compared to $1,949.6 million during the same period in 2021. The Regulated Services Group’s investments in 2022 were primarily related to the acquisition of Liberty NY Water in
January 2022. In addition, during 2022, the Regulated Services Group invested in the construction of transmission and distribution main replacements, work on new and existing substation assets, and initiatives relating to the safety and reliability
of electric and natural gas systems.
During the twelve months ended December 31, 2022, the Renewable Energy
Group incurred capital expenditures of $176.6 million as compared to $1,722.3 million during the same period in 2021. The Renewable Energy Group’s investment in 2021 was primarily related to the acquisitions of the previously unowned portions of the
Maverick Creek and Sugar Creek Wind Projects and the Altavista Solar Project from its joint venture partners, as well as the acquisition of a 51% interest in the Texas Coastal Wind Facilities. The Renewable Energy Group’s investments during 2022 were
primarily related to the development and/or construction of various projects and ongoing sustaining capital at existing operating sites.
| Management Discussion & Analysis |
39 |
2023 Capital Investments
The following discussion should be read in conjunction with the Caution
Concerning Forward-Looking Statements and Forward-Looking Information section of this MD&A.
Assuming the closing of the $2.646 billion Kentucky Power Transaction
the Company expects to spend approximately $3.6 billion on capital investment opportunities in the 2023 fiscal year. Actual expenditures in 2023 may vary due to, among other things, the timing of project investments and acquisitions, the availability
of financing on acceptable terms, and realized foreign exchange rates.
The Regulated Services Group expects to spend approximately $3.3
billion over the course of 2023. This includes the $2.646 billion Kentucky Power Transaction. The remaining Regulated Services Group spend is expected to contribute to continued efforts to expand operations, improve the reliability of the utility
systems and broaden the technologies used to better serve its service areas. Project spending includes capital for structural improvements, specifically in relation to refurbishing substations, replacing poles and wires, drilling and equipping
aquifers, main replacements, and reservoir pumping stations.
The Renewable Energy Group expects to spend approximately $300 million
over the course of 2023 to (i) develop or further invest in development and construction (as applicable) of the Renewable Energy Group’s wind, solar, and renewable natural gas projects. and (ii) with respect to various operational solar, thermal,
hydro and wind assets to comply with safety regulations and drive operational efficiencies.
LIQUIDITY AND CAPITAL RESERVES
AQN has revolving credit and letter of credit facilities as well as
separate credit facilities for the Regulated Services Group and the Renewable Energy Group to manage the liquidity and working capital requirements of each division (collectively the “Bank Credit Facilities”).
Bank Credit Facilities
The following table sets out the Bank Credit Facilities available to AQN and its operating
groups as at December 31, 2022:
| |
|
|
|
|
As at December 31, 2022 |
|
|
|
|
|
As at
December 31,
2021 |
|
| (all dollar amounts in $ millions) |
|
Corporate |
|
|
Regulated
Services
Group |
|
|
Renewable
Energy
Group |
|
|
Total |
|
|
Total |
|
| Revolving and term credit facilities |
|
$ |
550.0 |
1 |
|
$ |
2,863.3 |
2 |
|
$ |
1,100.0 |
3 |
|
$ |
4,513.3 |
|
|
$ |
3,217.0 |
|
| Funds drawn on facilities/ commercial paper |
|
|
|
|
|
|
|
|
|
|
|
|
|
|
|
|
|
|
|
|
| issued |
|
|
(180.1 |
) |
|
|
(1,275.0 |
) |
|
|
(77.4 |
) |
|
|
(1,532.5 |
) |
|
|
(849.6 |
) |
| Letters of credit issued |
|
|
(34.7 |
) |
|
|
(37.0 |
) |
|
|
(393.5 |
) |
|
|
(465.2 |
) |
|
|
(317.2 |
) |
| Liquidity available under the facilities |
|
|
335.2 |
|
|
|
1,551.3 |
|
|
|
629.1 |
|
|
|
2,515.6 |
|
|
|
2,050.2 |
|
| Undrawn portion of uncommitted letter of |
|
|
|
|
|
|
|
|
|
|
|
|
|
|
|
|
|
|
|
|
| credit facilities |
|
|
(18.8 |
) |
|
|
— |
|
|
|
(208.1 |
) |
|
|
(226.9 |
) |
|
|
(224.0 |
) |
| Cash on hand |
|
|
|
|
|
|
|
|
|
|
|
|
|
|
57.6 |
|
|
|
125.2 |
|
| Total Liquidity and Capital Reserves |
|
$ |
316.4 |
|
|
$ |
1,551.3 |
|
|
$ |
421.0 |
|
|
$ |
2,346.3 |
|
|
$ |
1,951.4 |
|
| 1 |
Includes a $50 million uncommitted standalone letter of credit facility. |
|
2 |
Includes $163.3 million fully drawn term facilities of ESSAL and Bermuda as at December 31, 2022 ($142 million as at December 31, 2021). |
|
3 |
Includes $600 million of uncommitted standalone letter of credit facilities. |
Corporate
As at December 31, 2022, the Company’s $500.0 million senior unsecured
syndicated revolving credit facility (the “Corporate Credit Facility”) had $180.1 million drawn and had $3.5 million of outstanding letters of credit. The Corporate Credit Facility matures on July 12, 2024.
As at December 31, 2022, the Company had also issued $31.2 million of
letters of credit from its $50 million uncommitted bi-lateral letter of credit facility.
Regulated Services Group
On April 29, 2022, the Regulated Services Group entered into two new
senior unsecured syndicated revolving credit facilities: a $1.0 billion senior unsecured revolving credit facility with an initial maturity date of April 29, 2027 (the “Long Term Regulated Services Credit Facility”) and a $500.0 million short-term
senior unsecured revolving credit facility maturing on March 31, 2023 (the “Short Term Regulated Services Credit Facility”). Subsequent to year-end this facility was extended to February 28, 2024.
As at December 31, 2022, the Long Term Regulated Services Credit
Facility had no amounts drawn and had $37.0 million of outstanding letters of credit. As at December 31, 2022, the Short Term Regulated Services Credit Facility had no amounts drawn and no outstanding letters of credit. As at December 31, 2022, there
was $407.0 million of commercial paper issued and outstanding.
As at December 31, 2022, the Regulated Services Group’s $75.0 million
senior unsecured revolving credit facility (the “Bermuda Credit Facility”) had $74.3 million drawn. On December 23, 2022, the Regulated Services Group amended and restated its $75.0 million Bermuda Credit Facility with a new maturity date of December
31, 2024. On June 24, 2022, the Regulated Services Group entered into a new $25.0 million senior unsecured bilateral revolving credit facility (the “Bermuda Working Capital Facility”) that matures on June 24, 2024. As at December 31, 2022, the
Bermuda Working Capital Facility had $20.0 million drawn.
| Management Discussion & Analysis |
41 |
On November 30, 2022, the Regulated Services Group amended and restated
its $1.1 billion senior unsecured syndicated delayed draw term facility (“the “Regulated Services Delayed Draw Term Facility”) with the new maturity date of November 29, 2023. As at December 31, 2022, the Regulated Services Delayed Draw Term Facility
had $610.4 million drawn.
Renewable Energy Group
On July 22, 2022, the Renewable Energy Group amended and restated its
$500.0 million senior unsecured syndicated revolving credit facility (the “Renewable Energy Credit Facility”) with a new maturity date of July 22, 2027. Subject to the terms and conditions therein, the Renewable Energy Credit Facility may be extended
for additional one-year periods.
As at December 31, 2022, the Renewable Energy Group’s bank lines
consisted of $600.0 million letter of credit facilities (the “Renewable Energy LC Facilities”), including a new $250.0 million uncommitted bilateral letter of credit facility that was entered into on July 22, 2022, and a $350.0 million uncommitted
letter of credit facility that was amended and restated on November 8, 2022 with a new maturity date of June 30, 2024.
As at December 31, 2022, the Renewable Energy Credit Facility had $77.4
million drawn and had $1.6 million in outstanding letters of credit. As at December 31, 2022, the Renewable Energy LC Facilities had $391.9 million in outstanding letters of credit.
Long Term Debt
On February 15, 2022, the Company repaid a C$200.0 million senior unsecured note on its
maturity.
On April 30, 2022, the Company repaid a $80.0 million senior unsecured note on its maturity.
On August 1, 2022, the Company repaid a $115.0 million senior unsecured note on its
maturity.
Subsequent to year end, the Company repaid a $15,000 senior unsecured note on its maturity.
Issuance of approximately $1.1 Billion of Subordinated Notes
On January 18, 2022, the Company closed (i) an underwritten public
offering in the United States of $750 million aggregate principal amount of the U.S. Notes; and (ii) an underwritten public offering in Canada of C$400 million aggregate principal amount of the Canadian Notes. Concurrent with the pricing of the Note
Offerings, the Company entered into a cross currency interest rate swap to convert the Canadian dollar denominated proceeds from the Canadian Note Offering into U.S. dollars and a forward starting swap to fix the interest rate for the second five
year term of the U.S. Notes, resulting in an anticipated effective interest rate to the Company of approximately 4.95% throughout the first ten year period of the Notes. The Note Offerings were assigned a BB+ rating from S&P and Fitch (each as
defined herein).
The Company intends to use the net proceeds of the Note Offerings to
partially finance the Kentucky Power Transaction, provided that, in the short-term, prior to the closing of the Kentucky Power Transaction, the Company has used such net proceeds to repay certain indebtedness of the Corporation and its subsidiaries.
Credit Ratings
AQN has a long term consolidated corporate credit rating of BBB from
Standard & Poor’s Financial Services LLC, (“S&P”), a BBB rating from DBRS Limited (“DBRS”) and a BBB issuer rating from Fitch Ratings Inc. (“Fitch”). Liberty Utilities has a corporate credit rating of BBB from S&P, a BBB issuer rating
from Fitch and a Baa2 issuer rating from Moody’s Investor Service, Inc. (“Moody’s”). Debt issued by Liberty Utilities Finance GP1 (“Liberty GP”) has a rating of BBB (high) from DBRS, BBB+ from Fitch, BBB from S&P and Baa2 from Moody’s. Empire has
an issuer rating of BBB from S&P and a Baa1 rating from Moody’s. Liberty Utilities (Canada) LP, the parent company for the Canadian regulated utilities under the Regulated Services Group, has an issuer rating of BBB from DBRS. Algonquin Power Co.
(“APCo”) has a BBB issuer rating from S&P, a BBB issuer rating from DBRS and a BBB issuer rating from Fitch.
On October 28, 2021, following the announcement of the Kentucky Power
Transaction, each of DBRS, Fitch and S&P made announcements regarding the credit ratings of the Corporation and its subsidiaries.
Fitch affirmed (i) the existing issuer ratings of both the Corporation
and Liberty Utilities (‘BBB’ Long-Term Issuer Default Rating (“IDR”) and ‘F2’ Short-Term IDR, respectively), and (ii) all the security ratings of the Corporation, Liberty Utilities and Liberty GP. Fitch also noted that the rating outlooks for the
Corporation and Liberty Utilities are stable and that the credit ratings of APCo are unaffected by the Kentucky Power Transaction. Fitch noted that it views the Kentucky Power Transaction to be neutral to the credit quality of the Corporation and
Liberty Utilities, given the underlying credit quality of Kentucky Power, and what Fitch expects to be a relatively credit-supportive financing plan for the Kentucky Power Transaction. During the first quarter of 2023, Fitch affirmed its existing
ratings and outlook.
In 2022, DBRS placed the Corporation’s ‘BBB’ Issuer Rating and ‘Pfd-3’
Preferred Shares ratings ‘Under Review with Developing Implications’. DBRS indicated that it viewed the Kentucky Power Transaction as a positive development from a business risk perspective due to the expected increase in the Corporation’s regulated
assets and rate base and expected improvements in jurisdictional diversification and capital expenditure planning. Notwithstanding these potentially positive
impacts, the ‘Under Review with Developing Implications’ rating action
reflected DBRS’s view that the Corporation’s financing plan for the Kentucky Power Transaction could increase the Corporation’s nonconsolidated leverage. Subsequent to year-end in February 2023, DBRS affirmed its existing ratings on APUC, APCo and
Liberty GP and removed APUC from “Under Review with Developing Implications”, updating the outlook to stable.
In 2022, S&P revised its outlook on the Corporation, Liberty
Utilities, APCo, Liberty GP and Empire from stable to negative, noting a lack of certainty regarding the Corporation’s financing plan for the Kentucky Power Transaction, beyond the equity offering for gross proceeds of approximately C$800 million
undertaken to partially finance the Kentucky Power Transaction, which could expose the Corporation to execution risks related to the procurement of credit supportive funding. S&P also noted that the negative outlook incorporated the possibility
of any material adverse regulatory requirements which may be necessary to close the Kentucky Power Transaction. S&P also affirmed its ‘BBB’ issuer credit rating for each of the Corporation, Liberty Utilities, APCo, Liberty GP and Empire. Finally,
S&P placed its rating on Liberty GP’s senior unsecured debt on CreditWatch with negative implications to reflect its view of the potential for such debt to be structurally subordinated following the closing of the Kentucky Power Transaction.
In 2022, S&P removed the “CreditWatch with negative implications”
from Liberty GP’s senior unsecured debt. During the first quarter of 2023, S&P affirmed these ratings and outlook, noting that its negative outlook reflects the execution risk associated with the Company’s 2023 Asset Recycling Plan.
Contractual Obligations
Information concerning contractual obligations as of December 31, 2022 is shown below:
| (all dollar amounts in $ millions) |
|
Total |
|
|
Due in less
than 1 year |
|
|
Due in 1
to 3 years |
|
|
Due in 4
to 5 years |
|
|
Due after
5 years |
|
| Principal repayments on debt obligations1,2 |
|
$ |
7,537.3 |
|
|
$ |
1,416.2 |
|
|
$ |
404.6 |
|
|
$ |
1,984.9 |
|
|
$ |
3,731.6 |
|
| Advances in aid of construction |
|
|
88.5 |
|
|
|
1.6 |
|
|
|
— |
|
|
|
— |
|
|
|
86.9 |
|
| Interest on long-term debt obligations2 |
|
|
5,080.9 |
|
|
|
310.9 |
|
|
|
447.2 |
|
|
|
386.6 |
|
|
|
3,936.2 |
|
| Purchase obligations |
|
|
741.9 |
|
|
|
741.9 |
|
|
|
— |
|
|
|
— |
|
|
|
— |
|
| Environmental obligations |
|
|
48.3 |
|
|
|
9.3 |
|
|
|
18.1 |
|
|
|
1.9 |
|
|
|
19.0 |
|
| Derivative financial instruments: |
|
|
|
|
|
|
|
|
|
|
|
|
|
|
|
|
|
|
|
|
| Cross currency interest rate swaps |
|
|
39.8 |
|
|
|
3.2 |
|
|
|
5.5 |
|
|
|
6.3 |
|
|
|
24.8 |
|
| Energy derivative and commodity contracts |
|
|
130.5 |
|
|
|
29.3 |
|
|
|
49.6 |
|
|
|
29.9 |
|
|
|
21.7 |
|
| Purchased power |
|
|
322.4 |
|
|
|
89.8 |
|
|
|
65.2 |
|
|
|
24.8 |
|
|
|
142.6 |
|
| Gas delivery, service and supply agreements |
|
|
512.5 |
|
|
|
113.8 |
|
|
|
138.7 |
|
|
|
71.8 |
|
|
|
188.2 |
|
| Service agreements |
|
|
575.8 |
|
|
|
67.5 |
|
|
|
113.7 |
|
|
|
96.1 |
|
|
|
298.5 |
|
| Capital projects |
|
|
7.2 |
|
|
|
7.2 |
|
|
|
— |
|
|
|
— |
|
|
|
— |
|
| Land easements |
|
|
531.4 |
|
|
|
13.3 |
|
|
|
26.8 |
|
|
|
27.5 |
|
|
|
463.8 |
|
| Contract adjustment payments on equity units |
|
|
113.9 |
|
|
|
76.2 |
|
|
|
37.7 |
|
|
|
— |
|
|
|
— |
|
| Other obligations |
|
|
320.6 |
|
|
|
37.2 |
|
|
|
6.4 |
|
|
|
5.1 |
|
|
|
271.9 |
|
| Total Obligations |
|
$ |
16,051.0 |
|
|
$ |
2,917.4 |
|
|
$ |
1,313.5 |
|
|
$ |
2,634.9 |
|
|
$ |
9,185.2 |
|
| 1 |
Exclusive of deferred financing costs, bond premium/discount, and fair value adjustments at the time of issuance or acquisition. |
| 2 |
The Company’s subordinated unsecured notes have a maturity in 2078, 2079, and 2082, respectively. However, the Company currently anticipates repaying such notes in 2023,
2029, and 2032, respectively, upon exercising its redemption right. |
Equity
The common shares of AQN are publicly traded on the Toronto Stock
Exchange (“TSX”) and the New York Stock Exchange (“NYSE”) under the trading symbol “AQN”. As at March 15, 2023, AQN had 688,203,107 issued and outstanding common shares.
AQN may issue an unlimited number of common shares. The holders of
common shares are entitled to dividends, if and when declared; to one vote for each share at meetings of the holders of common shares; and to receive a pro rata share of any remaining property and assets of AQN upon liquidation, dissolution or
winding up of AQN. All shares are of the same class and with equal rights and privileges and are not subject to future calls or assessments.
AQN is also authorized to issue an unlimited number of preferred
shares, issuable in one or more series, containing terms and conditions as approved by the Board. As at December 31, 2022, AQN had outstanding:
| Management Discussion & Analysis |
43 |
| ● |
4,800,000 cumulative rate reset Series A preferred shares, yielding 5.162% annually for the five-year period ending on December 31, 2023; |
| ● |
100 Series C preferred shares that were issued in exchange for 100 Class B limited partnership units by St. Leon Wind Energy LP; and |
|
● |
4,000,000 cumulative rate reset Series D preferred shares, yielding 5.091% annually for the five year period ending on March 31, 2024. |
In addition, AQN’s outstanding equity units (the “Green Equity Units”)
(that are in the form of “corporate units”) are listed on the NYSE under the ticker symbol “AQNU”. As at March 15, 2023, there were 23,000,000 Green Equity Units outstanding. Pursuant to the purchase contract forming part of each outstanding Green
Equity Unit, holders are required to purchase AQN common shares on June 15, 2024. The minimum settlement rate under each purchase contract is 2.7778 common shares and the maximum settlement rate is 3.3333 common shares, resulting in a minimum of
63,889,400 common shares and a maximum of 76,665,900 common shares issuable on settlement of the purchase contracts.
At-The-Market Equity Program
On August 15, 2022, AQN re-established an at-the-market equity program
(“ATM Program”) that allows the Company to issue up to $500 million of common shares from treasury to the public from time to time, at the Company’s discretion, at the prevailing market price when issued on the TSX, the NYSE or any other existing
trading market for the common shares of the Company in Canada or the United States.
During the three months ended December 31, 2022, the Company did not
issue any common shares under its ATM Program. On January 12, 2023, AQN announced that no new common equity financings were expected through the end of 2024.
During the twelve months ended December 31, 2022, the Company issued
2,861,709 common shares under its ATM Program at an average price of $13.94 per common share for gross proceeds of approximately $38.9 million (approximately $38.5 million net of commissions). Other related costs were $0.6 million.
As at March 16, 2023, the Company has issued, since the inception of
its initial ATM Program in 2019, a cumulative total of 36,814,536 common shares at an average price of $15.00 per share for gross proceeds of approximately $551.1 million (approximately $544.3 million net of commissions). Other related costs,
primarily related to the establishment and subsequent re-establishments of the ATM Program, were approximately $4.8 million.
Dividend Reinvestment Plan
AQN has a shareholder dividend reinvestment plan (the “Reinvestment
Plan”) for registered holders of common shares of AQN. As at December 31, 2022, 142,304,835 common shares representing approximately 21% of total common shares outstanding had been registered with the Reinvestment Plan. During the three months ended
December 31, 2022, 2,508,889 common shares were issued under the Reinvestment Plan, and subsequent to quarter-end, on January 13, 2023, an additional 4,370,289 common shares were issued under the Reinvestment Plan.
Effective March 16, 2023, AQN suspended the Reinvestment Plan.
Effective for the first quarter 2023 dividend (payable on April 14, 2023 to shareholders of record on March 31, 2023), shareholders participating in the Reinvestment Plan will begin receiving cash dividends. If the Company elects to reinstate the
Reinvestment Plan in the future, shareholders who were enrolled in the Reinvestment Plan at its suspension and remain enrolled at reinstatement will automatically resume participation in the Reinvestment Plan.
SHARE-BASED COMPENSATION PLANS
For the twelve months ended December 31, 2022, AQN recorded $10.9
million in total share-based compensation expense as compared to $8.4 million for the same period in 2021. The compensation expense is recorded as part of operating expenses in the consolidated statement of operations. The portion of share-based
compensation costs capitalized as cost of construction is insignificant.
As at December 31, 2022, total unrecognized compensation costs related
to non-vested share-based awards was $10.7 million and is expected to be recognized over a period of 1.8 years.
Stock Option Plan
AQN has a stock option plan that permits the grant of share options to
officers, directors, employees and selected service providers. Except in certain circumstances, the term of an option shall not exceed ten (10) years from the date of the grant of the option.
AQN determines the fair value of options granted using the
Black-Scholes option-pricing model. The estimated fair value of options, including the effect of estimated forfeitures, is recognized as an expense on a straight-line basis over the options’
vesting periods while ensuring that the cumulative amount of
compensation cost recognized at least equals the value of the vested portion of the award at that date. During the twelve months ended December 31, 2022, the Company granted 646,090 options to executives of the Company. The options allow for the
purchase of common shares at a weighted average price of $19.11, the market price of the underlying common share at the date of grant. During the twelve months ended December 31, 2022, executives of the Company exercised 40,074 stock options at a
weighted average exercise price of $13.92 in exchange for 3,999 common shares issued from treasury and 36,075 options were settled in cash as payment for the exercise price and tax withholdings related to the exercise of the options.
As at December 31, 2022, a total of 2,626,780 options were issued and outstanding under the
stock option plan.
Performance and Restricted Share Units
AQN issues performance share units (“PSUs”) and restricted share units
(“RSUs”) to certain employees as part of AQN’s long-term incentive program. During the twelve months ended December 31, 2022, the Company granted (including dividends and performance adjustments) a combined total of 1,090,457 PSUs and RSUs to
employees of the Company. During the twelve months ended December 31, 2022, the Company settled 1,221,620 PSUs, of which 611,772 PSUs were exchanged for common shares issued from treasury and 609,848 PSUs were settled at their cash value as payment
for tax withholdings related to the settlement of the PSUs.
As at December 31, 2022, a combined total of 2,109,710 PSUs and RSUs
were granted and outstanding under the performance and restricted share unit plan.
Directors’ Deferred Share Units
AQN has a Directors’ Deferred Share Unit Plan. Under the plan,
non-employee directors of AQN receive all or any portion of their annual compensation in deferred share units (“DSUs”) and may elect to receive any portion of their remaining compensation in DSUs. The DSUs provide for settlement in cash or common
shares at the election of AQN. As AQN does not expect to settle the DSUs in cash, these DSUs are accounted for as equity awards. During the twelve months ended December 31, 2022, the Company issued 120,513 DSUs (including DSUs in lieu of dividends)
to the non-employee directors of the Company. During the twelve months ended December 31, 2022, the Company settled 5,176 DSUs, of which 2,403 DSUs were exchanged for common shares issued from treasury and 2,773 DSUs were settled at their cash value
as payment for tax withholdings related to the settlement of DSUs.
As at December 31, 2022, a total of 645,714 DSUs were outstanding under the Directors’
Deferred Share Unit Plan.
Bonus Deferral Restricted Share Units
The Company has a bonus deferral RSU program that is available to
certain employees. The eligible employees have the option to receive a portion or all of their annual bonus payment in RSUs in lieu of cash. The RSUs provide for settlement in common shares, and therefore these RSUs are accounted for as equity
awards. During the twelve months ended December 31, 2022, the Company settled 178,368 bonus RSUs, of which 82,886 were exchanged for common shares issued from treasury and 95,482 RSUs were settled at their cash value as payment for tax withholdings
related to the settlement of the RSUs. In addition, during the twelve months ended December 31, 2022, 55,445 bonus deferral RSUs were granted (including RSUs in lieu of dividends) to employees of the Company pursuant to the bonus deferral RSU
program. The RSUs are 100% vested.
Employee Share Purchase Plan
AQN has an Employee Share Purchase Plan (the “ESPP”) which allows
eligible employees to use a portion of their earnings to purchase common shares of AQN. The aggregate number of common shares reserved for issuance from treasury by AQN under this plan shall not exceed 4,000,000 shares. During the twelve months ended
December 31, 2022, the Company issued 414,338 common shares to employees under the ESPP.
As at December 31, 2022, a total of 2,357,950 common shares had been issued under the ESPP.
MANAGEMENT OF CAPITAL STRUCTURE
AQN views its capital structure in terms of its debt and equity levels
at its individual operating groups and at an overall company level.
AQN’s objectives when managing capital are:
|
● |
To maintain its capital structure consistent with investment grade credit metrics appropriate to the sectors in which AQN operates; |
|
● |
To maintain appropriate debt and equity levels and to limit financial constraints on the use of capital; |
| Management Discussion & Analysis |
45 |
|
● |
To ensure capital is available to finance capital expenditures sufficient to maintain existing assets; |
|
● |
To ensure generation of cash is sufficient to fund sustainable dividends to shareholders as well as meet current tax and internal capital
requirements; |
|
● |
To maintain sufficient liquidity to pay sustainable dividends to shareholders; and |
|
● |
To have appropriately sized revolving credit facilities available for ongoing investment in growth and development opportunities. |
AQN monitors its cash position on a regular basis in an effort to
ensure funds are available to meet current normal as well as capital and other expenditures. In addition, AQN regularly reviews its capital structure with a view to ensuring its individual business groups are using a capital structure which is
appropriate for their respective industries.
RELATED PARTY TRANSACTIONS
Equity-method investments
The Company entered into a number of transactions with equity-method
investees in 2022 and 2021 (see Note 16 in the annual consolidated financial statements).
The Company provides administrative and development services to its
equity-method investees and is reimbursed for incurred costs. To that effect, the Company charged its equity-method investees1 $63.9 million in 2022, as compared to
$25.8 million in 2021. Additionally, one of the equity-method investees (Liberty Development JV Inc.) provides development services to the Company on specified projects, for which it earns a development fee upon reaching certain milestones. During
the year ended December 31, 2022, the development fees charged to the Company were $12.6 million, as compared to $2.0 million during the same periods in 2021. See Note 16 in the annual consolidated financial statements.
In 2021, a wholly-owned subsidiary of the Company made a tax equity
investment into New Market Solar Investco, LLC, an equity investee of the Company and indirect owner of the New Market Solar Project. Following the closing of the construction financing facility for the New Market Solar Project, certain excess funds
were distributed to the Company and in return the Company issued a promissory note of $25.8 million payable to New Market Solar Investco, LLC.
During the third quarter of 2021, the Company paid $1.5 million to
Abengoa S.A. to purchase all of Abengoa S.A.’s interests in the AAGES, AAGES Development Canada Inc., and AAGES Development Spain, S.A. joint ventures. The assets acquired for AAGES Development Spain S.A included project development assets for $2.7
million and working capital of $1.5 million. The existing loan between the Company and the partnership of $3.1 million was treated as additional consideration incurred to acquire the partnership. Pursuant to an agreement between AQN and funds managed
by the Infrastructure and Power strategy of Ares Management, LLC (“Ares”), in November 2021, Ares became AQN’s new partner in its non-regulated development platform for renewable energy, water and other sectors through an investment in the AAGES
joint venture (subsequently renamed Liberty Development Energy Solutions B.V.) and the AAGES Development Canada Inc. joint venture (subsequently renamed Liberty Development Services Canada Inc.) which is now owned through the newly created Liberty
Development JV Inc.
In 2021, the Sandy Ridge II Wind Project, the Shady Oaks II Wind
Project and the New Market Solar Project were contributed into joint venture entities (in which the Company and Ares each own an indirect 50% equity interest) in exchange for loans receivable in the net amount of $10.8 million and a contract asset of
$17.0 million recognized for the portion of consideration expected to be paid during the first quarter of 2023. The transfer of the New Market Solar Project resulted in a gain of $26.2 million. The transfer of the Sandy Ridge II Wind Project and the
Shady Oaks II Wind Project did not result in a gain or loss.
On August 10, 2022, the Deerfield II Wind Project was contributed into
a joint venture entity (in which the Company and Ares each own an indirect 50% equity interest). The transfer of the Deerfield II Wind Project did not result in a gain or loss.
Redeemable non-controlling interest held by related party
Redeemable non-controlling interest held by related party represents a
preference share in a consolidated subsidiary of the Company acquired by Liberty Development Energy Solutions B.V. (see Note 17(c) in the annual consolidated financial statements). Redemption is not considered probable as at December 31,
2022. The preference share was used to finance a portion of the Company’s investment in Atlantica. During the year ended December 31, 2022, the Company incurred non-controlling interest attributable to Liberty Development Energy Solutions B.V. of
$15.2 million, as compared to $10.4 million during the same period in 2021, and recorded distributions of $13.8 million, for the year ended December 31, 2022 as compared to $10.2 million during the same period in 2021 (see Note 17(c) in the
annual consolidated financial statements).
1 Primarily Liberty Development JV Inc. and its subsidiaries, Blue Hill Wind Energy Project Partnership, and Red Lily Wind Energy Partnership.
Non-controlling interest held by related party
In November 2021, Ares became AQN’s new partner in its non-regulated
development platform for renewable energy, water and other sectors as both parties contributed cash or assets of $19.7 million to Liberty Development JV Inc., which in turn invested $39.4 million in Algonquin (AY Holdco) B.V., a consolidated
subsidiary of the Company. There was no change to the balance in 2022. The investment by Liberty Development JV Inc. is presented as a non-controlling interest held by a related party (see Note 17(c) in the annual consolidated financial
statements).
Non-controlling interest held by related party represents interest in a
consolidated subsidiary of the Company acquired by a subsidiary of Atlantica in May 2019 for $96.8 million. The interest was used to finance a portion of the Company’s investment in the Amherst Island Wind Facility. During the year ended December 31,
2022, the Company recorded distributions of $21.0 million, as compared to $17.8 million during the same period in 2021 (see Note 17 in the annual consolidated financial statements).
The above related party transactions have been recorded at the exchange
amounts agreed to by the parties to the transactions.
Transactions with Atlantica
During 2021, the Company sold Colombian solar assets to Atlantica for
consideration of approximately $23.9 million, with a gain on sale of $0.9 million, and contingent consideration of approximately $2.6 million, if certain milestones were met. For the year ended December 31, 2022, a gain of $1.2 million relating to
the contingent consideration has been recognized. The transaction with Atlantica is considered final with no further gains expected to be realized.
ENTERPRISE RISK MANAGEMENT
The Corporation is subject to a number of risks and uncertainties,
certain of which are described below. A risk is the possibility that an event might happen in the future that could have a negative effect on the financial condition, financial performance or business of the Corporation. The actual effect of any
event on the Corporation’s business could be materially different from what is anticipated or described below. The description of risks below does not include all possible risks.
Led by the Chief Compliance and Risk Officer, the Corporation has an
established enterprise risk management (“ERM”) framework. The Corporation’s ERM framework follows the guidance of ISO 31000 and the Committee of Sponsoring Organizations of the Treadway Commission (“COSO”) Enterprise Risk Management - Integrated
Framework (2013). The Corporation’s ERM Policy details the Corporation’s risk management processes and risk governance structure.
As part of the risk management process, risk registers have been
developed across the organization through ongoing risk identification and risk assessment exercises facilitated by the Corporation’s internal ERM team. Key risks and associated mitigation strategies are reviewed by the executive-level Enterprise Risk
Management Council and are presented to the Risk Committee of the Board periodically.
Identified risks are evaluated using a standardized risk scoring matrix
to assess impact and likelihood. Financial, safety, security, reputational, reliability, and planned execution implications are among those considered when determining the impact of a potential risk. However, there can be no assurance that the
Corporation’s risk management activities will be successful in identifying, assessing, or mitigating the risks to which the Corporation is subject.
The risks discussed below are not intended as a complete list of all
risks that AQN, its subsidiaries and affiliates are encountering or may encounter. Please see the Company’s most recent AIF available on SEDAR and EDGAR for a further discussion of risk factors to which the Company is subject. To the extent of any
inconsistency, the risks discussed below are intended to provide an update on those that were previously disclosed.
Risks Related to Changes in Laws and Regulations
The operations and activities of the Company, its subsidiaries and its
business units are subject to the laws, regulations, orders and other requirements of a variety of federal, state, provincial and local governments, including regulatory commissions, environmental agencies and other regulatory bodies, which laws,
regulations, orders and other requirements affect the operations and activities of, and costs incurred by, the Company. The Company is accordingly subject to: risks associated with changing political conditions and changes in, modifications to, or
reinterpretations of, existing laws, orders or regulations, the imposition of new laws, orders or regulations (including those adopted in the State of New York allowing the North Shore Water Authority and the South Nassau Water Authority to operate
in the territories of private water companies, including the power of eminent domain, and possible changes to the constitution of Chile, such as changes to the water rights rules and to provisions governing ownership of water and wastewater
utilities), and the taking of other action by governmental or regulatory authorities, including, but not limited to, revocation, lapse, limitation or non-renewal of utility franchises or other rights to provide utility services to existing or new
customers, potential limitations on water rights used by utilities in providing service, actions to municipalize utility service areas or limitations on utility growth and/
| Management Discussion & Analysis |
47 |
or expansions of service areas, any of which could adversely affect the
Company’s business, regulatory approvals, assets, results of operations and financial condition. If the Company or any of its subsidiaries or business units were found to be in violation of such applicable laws, regulations, orders or other
requirements, they could be subject to significant penalties or legal actions.
Treasury Risk Management
Downgrade in the Company’s Credit Rating Risk
AQN has a long term consolidated corporate credit rating of BBB from
S&P, a BBB rating from DBRS and a BBB issuer rating from Fitch. APCo, the parent company for the U.S. and Canadian generating assets under the Renewable Energy Group, has a BBB issuer rating from S&P, BBB issuer rating from DBRS and a BBB
issuer rating from Fitch. Liberty Utilities, the parent company for the U.S. regulated utilities under the Regulated Services Group, has a corporate credit rating of BBB from S&P and a BBB issuer rating from Fitch and a Baa2 issuer rating from
Moody’s. Debt issued by Liberty GP, a special purpose financing entity of Liberty Utilities, has a rating of BBB (high) from DBRS, BBB+ from Fitch, BBB from S&P and Baa2 from Moody’s. Empire has a BBB issuer rating from S&P and a Baa1 issuer
rating from Moody’s. Liberty Utilities (Canada) LP, the parent company for the Canadian regulated utilities under the Regulated Services Group has an issuer rating of BBB from DBRS.
The ratings indicate the agencies’ assessment of the ability to pay the
interest and principal of debt securities issued by such entities. A rating is not a recommendation to purchase, sell or hold securities and each rating should be evaluated independently of any other rating. The lower the rating, the higher the
interest cost of the securities when they are sold. A downgrade in AQN’s or its subsidiaries’ issuer corporate credit ratings would result in an increase in AQN’s borrowing costs under its bank credit facilities and future long-term debt securities
issued. Any such downgrade could also adversely impact the market price of the outstanding securities of the Company, could impact the Company’s ability to acquire additional regulated utilities and could require the Company to post additional
collateral security under some of its contracts and hedging arrangements. If any of AQN’s ratings fall below investment grade (defined as BBB- or above for S&P and Fitch, BBB (low) or above for DBRS and Baa3 or above for Moody’s), AQN’s ability
to issue short-term debt or other securities or to market those securities would be constrained or made more difficult or expensive. Therefore, any downgrade could have a material adverse effect on AQN’s business, cost of capital, financial condition
and results of operations.
The Company is not adopting or endorsing such ratings, and such ratings
do not indicate AQN’s assessment of its own ability to pay the interest or principal of debt securities it issues. The Company is providing such ratings only to assist with the assessment of future risks and effects of ratings on the Company’s
financing costs.
AQN is committed to maintaining its investment grade credit ratings,
however no assurances can be provided that any of its current ratings will remain in effect for any given period of time or that a rating will not be lowered or withdrawn entirely by a rating agency if, in its judgment, circumstances in the future so
warrant. Each rating agency employs proprietary scoring methodologies that assess business and financial risks of the entity rated. There can be no assurance that the principles on which the rating is based remain consistently applied, and these
principles are subject to change from time to time at each rating agency’s discretion. For example, a rating agency’s views on total allowable leverage, specific industry risk factors, country risk and the company’s business mix, among other factors,
may change. Such changes could require AQN to adjust its business and strategy in order to maintain its credit ratings. AQN currently anticipates that to continue to maintain a BBB flat investment grade credit rating, it will, among other things,
need to execute its growth and asset recycling strategies in a manner that preserves financial leverage targets and continues to generate at least 70% of EBITDA (as determined by applicable rating agency methodologies) from AQN’s Regulated Services
Group. There can be no assurance that AQN will be successful, and the failure to do so could have a negative impact on AQN’s credit ratings. The business mix target may from time to time require AQN to grow its Regulated Services Group or implement
other strategies in order to pursue investment opportunities within the Renewable Energy Group.
Capital Markets and Liquidity Risk
As at December 31, 2022, the Company had approximately $7,512.3 million
of long-term consolidated indebtedness. Management of the Company believes, based on its current expectations as to the Company’s future performance, that the cash flow from operations, the funds available under its credit facilities and from future
asset recycling initiatives, and its ability to access capital markets will be adequate to enable the Company to finance its operations, execute its business strategy and maintain an adequate level of liquidity. However, the Company’s expected
revenue and capital expenditures are only estimates. Moreover, actual cash flows from operations will depend on regulatory, market and other conditions that are beyond the Company’s control and which may be impacted by the risk factors herein. As a
result, there can be no assurance that management’s expectations as to future performance will be realized.
The Company’s ability to obtain additional debt or equity or issue
other securities, on favourable terms or at all, may be adversely affected by negative perceptions of the Company, any adverse financial or operational performance, financial market disruptions, the failure or collapse of any financial institution,
prevailing market views or perceptions, or other
factors outside the Company’s control. In addition, the Company may at
times incur indebtedness in excess of its long-term leverage targets, in advance of raising the additional equity or similar securities or executing on asset recycling strategies necessary to repay such indebtedness and maintain its long-term
leverage target. Any increase in the Company’s leverage or degradation of key credit metrics below threshold levels could, among other things: limit the Company’s ability to obtain additional financing for working capital, investment in subsidiaries,
capital expenditures, debt service requirements, acquisitions and general corporate or other purposes; restrict the Company’s flexibility and discretion to operate its business; limit the Company’s ability to declare dividends; require the Company to
dedicate a portion of cash flows from operations to the payment of interest on its existing indebtedness, in which case such cash flows would not be available for other purposes; cause rating agencies to re-evaluate or downgrade the Company’s
existing credit ratings; require the Company to post additional collateral security under some of its contracts and hedging arrangements; expose the Company to increased interest expense on borrowings at variable rates; limit the Company’s ability to
adjust to changing market conditions; place the Company at a competitive disadvantage compared to its competitors; make the Company vulnerable to any downturn in general economic conditions; render the Company unable to make expenditures that are
important to its future growth strategies and require the Company to pursue alternative funding strategies, which may include accelerated asset recycling initiatives.
The Company will need to refinance or reimburse amounts outstanding
under the Company’s existing consolidated indebtedness over time. There can be no assurance the Company will be successful in refinancing its indebtedness when necessary or that additional financing will be obtained when needed, on commercially
reasonable terms or at all. In the event that the Company cannot refinance its indebtedness or raise additional indebtedness on terms that are not less favourable than the current terms, the Company’s cash flows, ability to declare dividends or repay
its indebtedness may be adversely affected.
The Company’s ability to meet its debt service requirements will depend
on its ability to generate cash in the future, which depends on many factors, including the Company’s financial performance, debt service obligations, the realization of the anticipated benefits of acquisition and investment activities, and working
capital and capital expenditure requirements. In addition, the Company’s ability to borrow funds in the future to make payments on outstanding debt will depend on the satisfaction of covenants in existing credit agreements and other agreements. A
failure to comply with any covenants or obligations under the Company’s consolidated indebtedness could result in a default under one or more such instruments, which, if not cured or waived, could result in the termination of dividends by the Company
and permit acceleration of the relevant indebtedness. There can be no assurance that, if such indebtedness were to be accelerated, the Company’s assets would be sufficient to repay such indebtedness in full. There can also be no assurance that the
Company will generate cash flow in amounts sufficient to pay its outstanding indebtedness or to fund the Company’s liquidity needs.
Interest Rate Risk
The Company is exposed to interest rate risk due to the impact of
increasing benchmark interest rates and credit spreads on certain outstanding variable interest indebtedness, as well as any new borrowings on existing and new credit facilities and other debt issuances. Fluctuations in interest rates may also impact
the costs to obtain other forms of capital and the feasibility of planned growth initiatives.
In addition, for the Regulated Services Group, costs resulting from
interest rate increases may not be recoverable in whole or in part, and “regulatory lag” may cause a time delay in the payment to the Regulated Services Group of any such costs that are recoverable. Rising interest rates may also negatively impact
the economics of development projects, acquisitions and energy facilities, especially where project financing is being renewed or arranged.
The Company’s financing of its capital expenditures, including the
Kentucky Power Transaction, is also exposed to changes in benchmark interest rates and credit spreads. While the Company intends to use the net proceeds from its approximately C$800 million common share offering that closed on November 8, 2021 (the
“2021 Bought Deal Offering”) and the Note Offerings to finance the Kentucky Power Transaction, all such net proceeds have, in the short term, been used to repay variable rate indebtedness under credit facilities of the Company and certain of its
subsidiaries prior to closing of the Kentucky Power Transaction. As a result, the Company expects to draw from the credit facilities of the Company and certain of its subsidiaries in connection with the closing of the Kentucky Power Transaction.
Given the rise in variable rates experienced in 2022 and to date in 2023, together with potential future interest rate increases, the Company expects higher financing costs for the Kentucky Power Transaction and other pending capital investments than
initially anticipated.
As a result, fluctuations in interest rates, including the rate
increases experienced in 2022, could materially increase the Corporation’s financing costs, limit the Corporation’s options for financing, and adversely affect its results of operations, cash flows, key credit metrics, borrowing capacity and ability
to implement its business strategy.
As at December 31, 2022, approximately 89% of debt outstanding in AQN
and its subsidiaries was subject to a fixed rate of interest and as a result, such debt is not subject to significant interest rate risk in the short term time horizon.
Borrowings subject to variable interest rates can fluctuate
significantly from month to month, quarter to quarter and year to year. AQN’s target is to maintain a minimum of 85% fixed rate debt. As a result, the Company hedges the interest rate risk
| Management Discussion & Analysis |
49 |
on its variable interest rate borrowings from time to time. On December
17, 2022, the Company entered into an interest rate cap agreement in the amount of $390 million for the period between January 15, 2023 and January 15, 2024.
Based on amounts outstanding as at December 31, 2022, the impact to
interest expense on variable rate loans from changes in interest rates are as follows:
|
● |
the Corporate Credit Facility is subject to a variable interest rate and had $180.1 million outstanding as at December 31, 2022. As a result, a 100 basis point change in
the variable rate charged would impact interest expense by $1.8 million annually; |
|
● |
the Long Term Regulated Services Credit Facility is subject to a variable interest rate and had no amounts outstanding as at December 31, 2022. As a result, a 100 basis
point change in the variable rate charged would not impact interest expense; |
|
● |
the Short Term Regulated Services Credit Facility is subject to a variable interest rate and had no amounts outstanding as at December 31, 2022. As a result, a 100 basis
point change in the variable rate charged would not impact interest expense; |
|
● |
the Regulated Services Delayed Draw Term Facility is subject to a variable interest rate and had $610.4 million outstanding as at December 31, 2022. The Regulated Services
Group has locked in the variable rate until May 31, 2023 through an interest election request. As a result, a 100 basis point change in the variable rate charged would impact interest expense by $3.1 million until the maturity date of November
29, 2023; |
|
● |
the Bermuda Credit Facility is subject to a variable interest rate and had $74.3 million outstanding as at December 31, 2022. As a result, a 100 basis point change in the
variable rate charged would impact interest expense by $0.7 million annually; |
|
● |
the Bermuda Working Capital Facility is subject to a variable interest rate and had $20.0 million outstanding as at December 31, 2022. As a result, a 100 basis point
change in the variable rate charged would impact interest expense by $0.2 million annually; |
|
● |
the Regulated Services Group’s commercial paper program is subject to a variable interest rate and had $407.0 million outstanding as at December 31, 2022. As a result, a
100 basis point change in the variable rate charged would impact interest expense by $4.1 million annually; |
|
● |
the Renewable Energy Credit Facility is subject to a variable interest rate and had $77.4 million outstanding as at December 31, 2022. As a result, a 100 basis point
change in the variable rate charged would impact interest expense by $0.8 million annually; |
|
● |
term facilities at ESSAL that are subject to variable interest rates had $93.1 million outstanding as at December 31, 2022. As a result, a 100 basis point change in the
variable rate charged would impact interest expense by $0.9 million annually; and |
Term facilities at BELCO are not subject to variable interest rates as
the Company entered into the above noted interest swap agreements to hedge the risk associated with interest rate fluctuation. In addition, on January 13, 2022, the Company entered into a forward starting swap to fix the interest rate for the second
five-year term of the U.S. Notes.
Foreign Currency Risk
The functional currency of most of AQN’s operations is the U.S. dollar,
however AQN is exposed to currency fluctuations from its Canadian and Chilean operations and may utilize equipment and/or commodities purchased from foreign suppliers.
AQN may enter into derivative contracts to hedge all or a portion of
currency exchange rate exposure that is transactional in nature and where a natural economic hedge does not exist (see Note 24 (b)(iii) in the annual consolidated financial statements). To the extent that the Company does enter into currency
hedges, the Company may not realize the full benefits of favourable exchange rate movement, and is subject to risks that the counterparty to the hedging contracts may prove unable or unwilling to perform their obligations under the contracts.
Canadian operations
The Company is exposed to currency fluctuations from its Canadian-based
operations. AQN manages this risk primarily through the use of natural hedges by using long-term debt in Canadian Dollars to finance its Canadian operations and a combination of foreign exchange forward contracts and spot purchases.
Chilean operations
The Company is exposed to currency fluctuations from its Chilean-based
operations. AQN manages this risk primarily through the use of natural hedges by using long-term debt in Chilean pesos or indexed to the Chilean Peso to finance its Chilean operations.
Tax Risk and Uncertainty
The Corporation is subject to income and other taxes primarily in the
United States and Canada; however, it is also subject to income and other taxes in international jurisdictions, such as Chile and Bermuda. Changes in tax laws or interpretations thereof in the jurisdictions in which the Corporation does business
could adversely affect the Company’s results from operations, returns to shareholders, and cash flows. One or more taxing jurisdictions could seek to impose incremental or new taxes on the Company pursuant to one of the following or otherwise:
|
● |
The Inflation Reduction Act was signed into law in the United States on August 16, 2022. The legislation is inclusive of an extension and expansion of clean energy tax
credits and a minimum tax. The minimum tax is not expected to be applicable to the Company in the near term; however, the Company cannot provide any assurance that it will not apply in the longer term. |
|
● |
On April 19, 2021, the Canadian federal government delivered its 2021 budget which contained proposed measures related to limitations on interest deductibility and changes
in relation to international taxation. Draft legislative proposals pertaining to interest deductibility were initially released for public comment on February 4, 2022, with revised legislative proposals subsequently released on November 3,
2022. The proposed rules on interest deductibility are expected to be effective no earlier than January 1, 2024. The proposed rules and their application are complex and could have a material adverse impact on the Corporation’s effective tax
rate and financial results in future years if enacted as drafted. |
|
● |
As a consequence of the Organization for Economic Co-operation and Development’s (“OECD”) various initiatives on “Base Erosion and Profit Shifting”, there has been
increased focus by taxing authorities across the globe to pursue common international principles for the entitlement to taxation of global corporate profits and eliminate perceived tax advantages enjoyed by multinational enterprises. Certain
components of the relevant legislation in the jurisdictions in which the Corporation operates or has domiciled subsidiaries are expected to apply with application expected no earlier than January 1, 2023. As the local legislation in the various
jurisdictions is enacted and comes into effect, there is a risk that the Company’s tax expense and/or cash taxes could materially increase or that the Company’s interpretation of the new legislation may not align with that of the relevant tax
authority’s interpretation. This could have a material adverse effect on the Corporation’s financial condition, results of operations, and cash flows in future periods. |
The Corporation cannot provide assurance that the Canada Revenue
Agency, the Internal Revenue Service or any other applicable taxation authority will agree with the tax positions taken by the Corporation, including with respect to claimed expenses and the cost amount of the Corporation’s depreciable properties. A
successful challenge by an applicable taxation authority regarding such tax positions could adversely affect the results of operations and financial position of the Corporation.
Development by the Corporation of renewable power generation facilities
in the United States depends in part on federal tax credits and other tax incentives. The Inflation Reduction Act has extended and expanded certain energy credits, providing greater certainty regarding the availability of these credits on a going
forward basis. However, the rules governing these tax credits still include technical requirements for credit eligibility. If the Corporation is unable to complete construction on current or planned projects within certain deadlines or satisfy
certain new requirements relating to prevailing wage and apprenticeship requirements, the reduced incentives may be insufficient to support continued development or may result in substantially reduced financial benefits from facilities or long-term
investment in facilities that the Corporation is committed to complete. In addition, the Corporation has entered into certain tax equity financing transactions with financial partners for certain of its renewable power facilities in the United
States, under which allocations of future cash flows to the Corporation from the applicable facility could be adversely affected in the event that there are changes in U.S. tax laws that apply to facilities previously placed in service.
Credit/Counterparty Risk
AQN and its subsidiaries are subject to credit risk with respect to the
ability of customers and other counterparties to perform their obligations to the Company, including paying amounts that they owe to AQN or its subsidiaries. This credit risk exists with respect to utility customers, banks and other financing
sources, as well as counterparties to long term PPAs, trade receivables, derivative financial instruments, energy management agreements, Engineering, Procurement, and Construction contracts, manufacturer contracts, and natural gas supply agreements,
among others. Additionally, bank deposits in excess of deposit insurance limits are subject to the risk that such excess amounts could be lost or forfeited in the event of a bank failure.
The Renewable Energy Group’s revenues are approximately 13% of total
Company revenues with the majority earned from large utility customers having a credit rating of Baa2 or better by Moody’s, or BBB or higher by S&P, or BBB or higher by DBRS.
The remaining revenue of the Company is primarily earned by the Regulated Services Group.
| Management Discussion & Analysis |
51 |
The credit risk attributed to the Regulated Services Group’s accounts
receivable balances at the water and wastewater distribution systems total $86.0 million which is spread over approximately 560,000 customer connections, resulting in an average outstanding balance of approximately $150 dollars per customer
connection.
The natural gas distribution systems accounts receivable balances
related to the natural gas utilities total $167.4 million, while electric distribution systems accounts receivable balances related to the electric utilities total $165.0 million. The natural gas and electrical utilities both derive over 85% of their
revenue from residential customers and have a per customer connection average outstanding balance of $446 dollars and $534 dollars respectively. Counterparty performance risk also exists in the natural gas distribution where suppliers could
potentially fail to supply natural gas leading to disruptions and potentially higher procurement costs. These risks are mitigated through the receipt of collateral from counterparties.
Adverse conditions in the energy industry or in the general economy,
including the effects of the COVID-19 pandemic, as well as circumstances of individual customers or counterparties, may adversely affect the ability of a customer or counterparty to perform as required under its contract with the Company. Losses from
a utility customer may not be offset by bad debt reserves approved by the applicable utility regulator. If a customer under a PPA, unit contingent or fixed-shape offtake contract or other energy offtake or hedging arrangement with the Company is
unable to perform, the Renewable Energy Group may be unable to replace the contract on comparable terms, in which case sales of power (and, if applicable, RECs and ancillary services) from the facility would be subject to market price risk and may
require refinancing of indebtedness related to the facility or otherwise have a material adverse effect. Default by other counterparties, including lenders and counterparties to supply and construction contracts, hedging contracts that are in an
asset position, short-term investments, agreements for the purchase of goods or services or other agreements, also could adversely affect the financial results of the Corporation.
Market Price Risk
The Renewable Energy Group assets subject to long term PPAs are not
exposed to market risk for this portion of its portfolio. Where a generating asset is not covered by a PPA, the Renewable Energy Group may seek to mitigate market risk exposure by entering into financial or physical power hedges requiring that a
specified amount of power be delivered at a specified time in return for a fixed price. There is a risk that there is a difference between the pricing at the location where power is delivered and where the hedge settles, known as basis risk, which
may result in reduced net revenue and earnings volatility for the Company. Basis risk can exist even where the energy output from a facility is contracted. In an effort to mitigate basis risk, the Company seeks to enter into additional financial
contracts in order to fix the price of basis on a portion of the production from specific assets. There is a risk that the Company is not able to generate the specified amount of power at the specified time resulting in production shortfalls under
the hedge that then requires the Company to purchase power in the merchant market. To mitigate the risk of production shortfalls under hedges, the Renewable Energy Group generally seeks to structure hedges to cover less than 100% of the anticipated
production, thereby reducing the risk of not producing the minimum hedge quantities. Nevertheless, due to unpredictability in the natural resource or due to grid curtailments or mechanical failures, production shortfalls may be such that the
Renewable Energy Group may still be forced to purchase power in the merchant market at prevailing rates to settle against a hedge. Any event that restricts production increases shortfall risk. Events that can reduce production include (but are not
limited to) weather events (such as icing, low wind resource, cloud cover), transmission outages and mechanical failure. The Corporation is subject to the risk of impairment to its renewable power generation assets associated with potential declines
in long term forecasted power prices for the period following the expiration of PPAs, unit contingent or fixed-shape offtake contracts or other energy offtake or hedging arrangements, as well as the expiration or decline in value of RECs and other
sources of revenue.
Hedges currently put in place by the Renewable Energy Group for its
operating facilities along with residual exposures to the market are detailed below:
The Senate, Sandy Ridge and Minonk Wind Facilities have entered into
financial hedges that end between 2027 and 2028. The financial hedges are structured to hedge an average of approximately 65% of annual LTAR against exposure to the applicable hub current spot market rates. The average unhedged production based on
LTAR is approximately 488 GW-hrs annually.
The Sugar Creek Wind Facility has a financial hedge in place until the
end of 2030 which is structured to hedge an average of 73% of annual LTAR against exposure to the applicable hub current spot market rates. The average unhedged production based on LTAR is approximately 200 GW-hrs annually.
The Maverick Creek Wind Facility has unit contingent PPAs until the end
of 2031 which are structured to hedge an average of 76% of annual LTAR against exposure to the applicable hub current spot market rates. The annual average unhedged production based on LTAR is approximately 466 GW-hrs annually.
Under each of the above noted hedges, if production is not sufficient
to meet the unit quantities under the hedge, the shortfall must be purchased in the open market at market rates. The effect of this risk exposure could be material. The
Renewable Energy Group tries to manage this risk by forecasting
shortfalls and entering into offsetting transactions (buy back). However, the existence and extent of any shortfall cannot always be predicted.
In addition to the above noted hedges, from time to time the Renewable
Energy Group enters into short-term derivative contracts (usually with terms of one to three months) to further mitigate market price risk exposure due to production variability. As at December 31, 2022, the Renewable Energy Group had entered into
hedges with a cumulative notional quantity of 16,140 GW-hrs.
The Company has elected the fair value option under ASC 825, Financial
Instruments to account for its investment in Atlantica, with changes in fair value reflected in the annual consolidated statement of operations. As a result, each dollar change in the traded price of Atlantica shares will correspondingly affect
the Company’s net earnings by approximately $44 million.
Commodity Price Risk
The Regulated Services Group is exposed to energy and natural gas price
risks at its electric and natural gas systems. The Renewable Energy Group’s exposure to commodity prices is primarily limited to exposure to natural gas price risk. In this regard, a representative discussion of these risks is set out as follows:
Regulated Services Group
The CalPeco Electric System provides electric service to the Lake Tahoe
California basin and surrounding areas at rates approved by the CPUC. The CalPeco Electric System purchases the energy, capacity, and related service requirements for its customers from NV Energy via a PPA at rates reflecting NV Energy’s system
average costs.
The CalPeco Electric System’s tariffs allow for the pass-through of
energy costs to its rate payers on a dollar for dollar basis, through the Energy Cost Adjustment Clause (“ECAC”) mechanism, which allows for the recovery or refund of changes in energy costs that are caused by the fluctuations in the price of fuel
and purchased power. On a monthly basis, energy costs are compared to the CPUC approved base tariff energy rates and the difference is deferred to a balancing account. Annually, based on the balance of the ECAC balancing account, if the ECAC revenues
were to increase or decrease by more than 5%, the CalPeco Electric System’s ECAC tariff allows for a potential adjustment to the ECAC rates which would eliminate the risk associated with the fluctuating cost of fuel and purchased power.
The Granite State Electric System is an open access electric utility
allowing for its customers to procure commodity services from competitive energy suppliers. For those customers that do not choose their own competitive energy supplier, Granite State Electric System provides a Default Service offering to each class
of customers through a competitive bidding process. This process is undertaken semi-annually for all Default Service customers. The winning bidder is obligated to provide a full requirements service based on the actual needs of the Granite State
Electric System’s Default Service customers. Since this is a full requirements service, the winning bidder(s) take on the risk associated with fluctuating customer usage and commodity prices. The supplier is paid for the commodity by the Granite
State Electric System which in turn receives pass-through rate recovery through a formal filing and approval process with the NHPUC on a semi-annual basis. The Granite State Electric System is only committed to the winning Default Service supplier(s)
after approval by the NHPUC so that there is no risk of commodity commitment without pass-through rate recovery.
The EnergyNorth Natural Gas System purchase pipeline capacity, storage
and commodity from a variety of counterparties. The EnergyNorth Natural Gas System’s portfolio of assets and its planning and forecasting methodology are commonly approved periodically by the NHPUC through Least Cost Integrated Resource Plan filings
which typically are filed bi-annually but can be as long as a five-year interim period depending on the length of the review process. In addition, EnergyNorth Natural Gas System files with the NHPUC for recovery of its transportation and commodity
costs on an annual basis through the Cost of Gas (“COG”) filing and approval process. The EnergyNorth Natural Gas System establishes rates for its customers based on the NHPUC’s approval of its filed COG. These rates are designed to fully recover its
anticipated transportation and commodity costs. In order to minimize commodity price fluctuations, the EnergyNorth Natural Gas System locks in a fixed price basis for approximately 16% of its normal winter period purchases under a NHPUC approved
hedging program. All costs associated with the fixed basis hedging program are allowed to be a pass-through to customers through the COG filing and the approved rates in said filing. Should commodity prices increase or decrease relative to the
initial annual COG rate filing, the EnergyNorth Natural Gas System has the right to automatically adjust its COG rates going forward up to 25% in order to minimize any under or over collection of its natural gas costs. In addition, any under
collections may be carried forward with interest to the next year’s corresponding COG period (i.e. winter to winter and summer to summer).
The Midstates Gas and Empire Gas Systems purchases pipeline capacity,
storage and commodity from a variety of counterparties, and file with the individual state commissions for recovery of their respective transportation and commodity costs through an annual Purchase Gas Adjustment (“PGA”) filing and approval process.
The Midstates Gas Systems serves customers in Missouri, Illinois and Iowa and establishes rates for its customers within the PGA filing in each state and these rates are designed to fully recover its anticipated transportation, storage and commodity
costs. In order to minimize commodity price fluctuations, the Midstates Gas System has implemented a commodity hedging program, consistent with
| Management Discussion & Analysis |
53 |
regulator expectations and approvals, designed to hedge approximately
25-50% of its non-storage related commodity purchases. All gains and losses associated with the hedging program are allowed to be a pass-through to customers through the PGA filing and are embedded in the approved rates in said filing. Rates can be
adjusted on a monthly or quarterly basis in order to account for any commodity price increase or decrease relative to the initial PGA rate, minimizing any under or over collection of its natural gas costs. Similar to the Midstates Gas System, the
Empire Gas System serves customers in Missouri, and also implements a commodity hedging program designed to hedge 70% to 90% of its winter demand inclusive of storage volumes withdrawn during the winter period. All related costs are embedded in
approved rates and allowed to be a pass through to customers in the PGA. The Empire Gas System is permitted to file an Actual Cost Adjustment (“ACA”) once a year which also includes a PGA filing. In addition to the ACA filing, three more optional PGA
filings are allowed during the year. The Empire Gas System’s ACA year is from September 1 to August 31 for each year.
The Peach State Gas System purchases pipeline capacity, storage and
commodity from a variety of counterparties, and files with the Georgia Public Service Commission (“PSC”) for recovery of its transportation, storage and commodity costs through a monthly PGA filing process. The Peach State Gas System establishes
rates for its customers within the PGA filings and these rates are designed to fully recover its anticipated transportation, storage and commodity costs. In order to minimize commodity price fluctuations, the annual Gas Supply Plan filed by the
Company and approved by the Georgia PSC includes a commodity hedging program designed to hedge approximately 30% of its non-storage related commodity purchases during the winter months. All gains and losses associated with the hedging program are
passed through to customers in the PGA filings and are embedded in the approved rates in such filings. Rates can be adjusted on a monthly basis in order to account for any differences in natural gas costs relative to the amounts assumed in the PGA
filings, minimizing any under or over collection of its natural gas costs.
The Empire Electric System’s natural gas procurement program for
electrical generation is designed to manage costs to mitigate volatile natural gas prices. The Empire Electric System periodically enters into fixed price contracts with counterparties to hedge future natural gas prices in an attempt to lessen the
volatility in fuel expenditures. Generally, the over/under variances associated with the hedging program are passed through to customers in the fuel adjustment clause assuming they are deemed to be prudently incurred.
BELCO purchases Heavy Fuel Oil, Light Fuel Oil and diesel which are
transported and stored in facilities in Bermuda until such time as they are delivered and consumed in its electricity generation operations. While the cost of this fuel is included in traditional rate filings through a Fuel Adjustment Rate (“FAR”),
the variability in the commodity pricing has led the Regulatory Authority of Bermuda to establish a quarterly reconciliation and adjustment to the FAR. This filing evaluates current commodity pricing and usage as well as projected commodity pricing
to develop the FAR for the upcoming quarter. Additionally, BELCO has periodically used hedging to lock in commodity rates in an effort to reduce pricing volatility and protect customer rates.
Renewable Energy Group
The Sanger Thermal Facility’s offtake agreement includes provisions
which reduce its exposure to natural gas price risk. In this regard, a $1.00 increase in the price of natural gas per MMBTU, based on expected production levels, would result in a decrease in net revenue by approximately $1.36 million on an annual
basis.
The Windsor Locks Thermal Facility’s offtake agreement includes
provisions which reduce its exposure to natural gas price risk but has exposure to market rate conditions for sales above those to its primary customer. In this regard, a $1.00 increase in the price of natural gas per MMBTU, based on expected
production levels, would result in a decrease in net revenue by approximately $0.50 million on an annual basis.
The Maritime region provides short-term energy requirements to various
customers at fixed rates. The energy requirements of these customers are estimated at approximately 70,000 MW-hrs in fiscal 2023, of which 70,000 MW-hrs is presently contracted. The Tinker Hydro Facility is expected to provide the vast majority of
the energy required to service these customers and the Maritime region anticipates having to purchase a minimal amount of its energy requirements at the ISO-NE spot rates to supplement self-generated energy to manage potential hourly imbalances
between load requirements and generation.
OPERATIONAL RISK MANAGEMENT
Mechanical and Operational Risks
AQN’s profitability could be impacted by, among other things, equipment
failure, the failure of a major customer to fulfill its contractual obligations, reductions in average energy prices, a strike or lock-out at a facility, natural disasters, diseases (including COVID-19) and other force majeure events, interruption in
supply chain and expenses related to claims or clean-up to adhere to environmental and safety standards.
The Regulated Services Group’s water and wastewater distribution
systems operate under pressurized conditions within pressure ranges approved by regulators. Should a water distribution network become compromised or damaged, the resulting release of pressure could result in serious injury or death to individuals or
damage to other property. In addition,
water contamination a in drinking water distribution system could
result in severe illness or death to those who drink the contaminated water.
The Regulated Services Group’s electric distribution systems are
subject to storm events, usually winter storm events, whereby power lines can be brought down, with the attendant risk to individuals and property. Wildfires may occur within the Regulated Services Group’s electric distribution service territories,
including, without limitation, in California and the southern United States, such as the Mountain View fire that occurred on November 17, 2020, within the CalPeco Electric System’s service territory in California. In forested areas, trees falling on
and lightning strikes to, distribution lines or equipment, can ignite wildfires which may pose a risk to life and property. If the Company is accused or found to be responsible for such a fire, the Company could suffer costs, losses and damages,
including inverse condemnation, all or some of which may not be recoverable through insurance, legal, regulatory recovery and other processes.
The Regulated Services Group’s natural gas distribution systems are
subject to risks which may lead to fire and/or explosion which may impact life and property. Risks include third party damage, compromised system integrity, type/age of pipelines, and severe weather events.
The Company’s hydro assets utilize dams to pond water for generation
and if the dams fail/breach potentially catastrophic amounts of water would flood downriver from the facility. The dams can be subjected to drought conditions and lose the ability to generate during peak load conditions, causing the facilities to
fall short of either hedged or PPA committed production levels. The risks of the hydro facilities are mitigated by regular dam inspections and a maintenance program of the facility to lessen the risk of dam failure.
The Company’s assets could catch on fire and, depending on the season,
could ignite significant amounts of forest or crop downwind from the wind farms. The wind units could also be affected by large atmospheric conditions, which could lower wind levels below the Company’s PPA and hedge minimum production levels. The
wind units can experience failures in the turbine blades or in the supporting towers. Production risks associated with the wind turbine generators failures is mitigated by properly maintaining the units, using long term maintenance agreements with
the turbine O&Ms which provide for regular inspections and maintenance of property, and liability insurance policies.
The Company’s Thermal Energy Division uses natural gas and oil, and
produces exhaust gases, which if not properly treated and monitored could cause hazardous chemicals to be released into the atmosphere. The units could also be restricted from purchasing natural gas/oil due to either shortages or pollution levels,
which could hamper output of the facility. The mechanical and operational risks at the thermal facilities are mitigated through the regular maintenance of the boiler system, and by continual monitoring of exhaust gases. Fuel restrictions can be
hedged in part by long term purchases.
All of the Renewable Energy Group’s electric generating stations are
subject to mechanical breakdown. The risk of mechanical breakdown is mitigated by properly maintaining the units and by regular inspections.
In general, these risks are, in part, mitigated through the
diversification of AQN’s operations, both operationally and geographically. In addition, AQN seeks to mitigate these risks through the use of regular maintenance programs, including pipeline safety programs and compliance programs, the provision of
adequate insurance, an active Enterprise Risk Management program and the establishment of reserves for expenses.
Regulatory Risk
Profitability of AQN businesses is, in part, dependent on regulatory
climates in the jurisdictions in which those businesses operate. In the case of some of Renewable Energy Group’s hydroelectric facilities, water rights are generally owned by governments that reserve the right to control water levels, which may
affect revenue.
The Regulated Services Group’s facilities are subject to rate setting
by its regulatory agencies. The Regulated Services Group operates in 13 U.S. states, one Canadian province, Bermuda and Chile and therefore is subject to regulation from 17 different regulatory agencies including FERC. The time between the incurrence
of costs and the granting of the rates to recover those costs by regulatory agencies is known as regulatory lag. As a result of regulatory lag, inflationary effects and timing delays may impact the ability to recover expenses and/or capital costs,
and profitability could be impacted. In order to mitigate this exposure, the Regulated Services Group seeks to obtain approval for regulatory constructs in the states in which it operates to allow for timely recovery of operating expenses and capital
costs. A fundamental risk faced by any regulated utility is the disallowance of operating expenses or capital costs to be placed into its revenue requirement by the utility’s regulator. In addition, capital investments that have become stranded may
pose additional risk for cost recovery and could be subject to legislative proposals that would impact the extent to which such costs could be recovered. To the extent proposed costs are not included in the utility’s revenue requirement, the utility
will be required to find other efficiencies, growth opportunities or cost savings to achieve its allowed returns.
The Regulated Services Group regularly works with its governing
authorities to manage the affairs of the business, employing local, state level, and corporate resources.
| Management Discussion & Analysis |
55 |
Condemnation Expropriation Proceedings
The Regulated Services Group’s distribution systems could be subject to
condemnation or other methods of taking by government entities under certain conditions. Any taking by government entities would legally require fair compensation to be paid. Determination of such fair compensation is undertaken pursuant to a legal
proceeding and, therefore, there is no assurance that the value received for assets taken will be in excess of book value.
Inflation Risk
AQN’s profitability could be impacted by inflation increases above
long-term averages. The Regulated Services Group’s facilities are subject to rate setting by its regulatory agencies. The time between the incurrence of costs and the granting of the rates to recover those costs by regulatory agencies is known as
regulatory lag. As a result of regulatory lag, inflationary effects and timing delays may impact the ability to recover expenses and/or capital costs, and profitability could be impacted. In the event of significant inflation, the impact of
regulatory lag on the Company would be increased. In order to mitigate this exposure, the Regulated Services Group seeks to obtain approval for regulatory constructs in the states in which it operates to allow for timely recovery of operating
expenses and capital costs.
The Renewable Energy Group’s assets are subject to long term PPAs, most
of which are not indexed to inflation and could experience declines in profitability if operating costs increase at a rate greater than the offtake price.
Development and construction projects could experience a decrease in
expected returns as a result of increased costs. To mitigate the risk of inflation the Company attempts to enter into fixed price construction agreements and fixed price offtake agreements.
Tariff Risk
Changes in tariffs or duties, such as antidumping and countervailing
duty rates that could be put in place as a result of the U.S. Department of Commerce’s investigation into an antidumping and countervailing duties circumvention claim on solar cells and panels supplied from Malaysia, Vietnam, Thailand and Cambodia,
may adversely affect the capital expenditures required to develop or construct the Corporation’s projects, as well as the timing for completion, or viability, of such projects. In the U.S., tariffs have been imposed in recent years on imports of
solar panels, aluminum and steel, among other goods and raw materials. These occurrences may have adverse impacts to the Corporation, as the buyer of goods, which could adversely affect the Corporation’s expected returns, results of operations and
cash flows.
Risks Relating to the Kentucky Power Transaction
The closing of the Kentucky Power Transaction is subject to the normal
commercial risks that such acquisition will not close on the terms negotiated or at all. The Kentucky Power Transaction remains subject to closing conditions, including the approval of FERC and clearance pursuant to the Hart-Scott-Rodino Antitrust
Improvements Act of 1976 (as the clearance received previously has lapsed). The failure to satisfy or waive the conditions may result in the termination of the Kentucky Acquisition Agreement. Accordingly, there can be no assurance that the Company
will complete the Kentucky Power Transaction on the basis described herein, if at all. As the Kentucky Power Transaction is subject to various regulatory approvals, it is consequently subject to the risks that such approvals may not be timely
obtained or may impose unfavourable conditions that could impair the ability to complete the acquisition or impose adverse conditions on the Company in order to complete the acquisition. The presence of intervenors in the regulatory approval process
has the effect of increasing these risks.
If the Kentucky Power Transaction is not completed, the Company could
be subject to a number of risks that may adversely affect the Company’s business, financial condition, results of operations, reputation and cash flows, including (i) the requirement to pay costs relating to the Kentucky Power Transaction, including
costs relating to the financing thereof and obtaining regulatory approval and (ii) time and resources committed by the Company’s management to matters relating to the Kentucky Power Transaction that could otherwise have been devoted to pursuing other
beneficial opportunities. In addition, if the Kentucky Acquisition Agreement for the Kentucky Power Transaction is terminated in certain circumstances, the Company may be required to pay a termination fee of $65 million.
Business combinations such as the Kentucky Power Transaction involve
risks that could materially and adversely affect the Company’s business plan, including the failure to realize the results that the Company expects. Transition and integration activities associated with this business combination may not go as
planned, creating the potential for increased costs, service disruption, noncompliance, reputational harm and other negative outcomes. There can be no assurance that the Company will be successful in increasing the historical returns earned by either
Kentucky Power or Kentucky Transco, that the load declines experienced by Kentucky Power over recent years will not continue to be a prevailing trend, or that the Company will be able to fully realize some or all of the expected benefits of the
Kentucky Power Transaction or succeed in implementing its strategic objectives relating to the acquired entities, including the success of the transfer of operational control of the Mitchell Plant from Kentucky Power to the Wheeling Power Company and
the transition of Kentucky Power’s generating mix to greener sources (i.e. “greening the fleet” initiatives). The ability to realize these anticipated benefits and implement these strategic objectives will depend in part on successfully retaining
staff, hiring additional staff to replace
certain of the sellers’ centralized operations, obtaining favourable
regulatory outcomes, realizing growth opportunities, no unanticipated economic changes in the areas where the acquired entities operate, and potential synergies through the coordination of activities and operations with the Company’s existing
business. There is a risk that some or all of the expected benefits and strategic objectives will fail to materialize, or may not occur within the time periods anticipated by the Company. A failure to realize the anticipated benefits of or implement
strategic objectives relating to the Kentucky Power Transaction on an efficient and effective basis could have a material adverse effect on the Company’s financial condition, results of operations, reputation and cash flows.
A change in the capital structure of the Company could cause credit
rating agencies which rate the Company’s outstanding debt obligations to re-evaluate and potentially downgrade the Company’s current credit ratings, which could increase the Company’s borrowing costs and adversely impact the market price of the
outstanding securities of the Company.
The Kentucky Power Transaction could also result in a downgrade of the
credit rating of Kentucky Power or its outstanding bonds, and could require Kentucky Power to offer to prepay $525 million in principal amount of its outstanding bonds if the credit ratings thereof fall below investment grade (or in the event such
bonds are placed on “credit watch” or assigned a “negative outlook” if they are rated BBB- by S&P or Baa3 by Moody’s at such time).
There may be liabilities that the Company failed to discover or was
unable to quantify in the Company’s due diligence, and the Company may not have recourse for some or all of these potential liabilities. While the Company has accounted for these potential liabilities for the purposes of making its decision to enter
into the Kentucky Acquisition Agreement, there can be no assurance that any such liability will not exceed the Company’s estimates. In connection with the Kentucky Power Transaction, the Company has obtained a representation and warranty insurance
policy, with coverage up to $255 million, subject to an initial retention of $21 million. Nevertheless, this insurance policy is subject to certain exclusions and limitations and there may be circumstances for which the insurer attempts to limit such
coverage or refuses to indemnify the Company or where the coverage provided under the insurance policy may otherwise be insufficient or inapplicable.
Kentucky Power and Kentucky Transco are party to agreements that
contain change of control and/or termination for convenience provisions which may be triggered following completion of the Kentucky Power Transaction. The operation of these change of control or termination provisions, if triggered, could result in
unanticipated expenses and/or cash payments following the consummation of the Kentucky Power Transaction or adversely affect the acquired entities’ results of operations and financial condition. Unless these change of control provisions are waived,
or the termination provisions are not exercised, by the other party, the operation of any of these provisions could adversely affect the results of operations and financial condition of the Company and the acquired entities.
Although a portion of the Company’s electricity is produced by the
combustion of fossil fuels, all of the electricity generated by Kentucky Power is produced by the combustion of fossil fuels. As a result, the acquisition of Kentucky Power would increase the overall percentage of the Company’s electricity generation
that is produced by the combustion of fossil fuels and could result in reputational harm to the Company and adversely affect perceptions regarding the Company’s commitment to environmental and sustainability matters, as well as the Company’s ability
to accomplish its environmental and sustainability objectives. The operation of fossil-fueled generation plants, including resulting emissions of nitrogen and sulfur oxides, mercury and particulates and the discharge and disposal of solid waste
(including coal-combustion residuals (“CCRs”)), is subject to extensive federal, state and local environmental statutes, rules and regulations relating to air quality, water quality, waste management, natural resources and health and safety.
Compliance with these requirements requires Kentucky Power to incur significant costs, including capital expenditures, for environmental monitoring, installation of pollution control equipment, emission fees, disposal activities, decommissioning, and
permitting obligations. If these compliance costs become uneconomical, Kentucky Power may ultimately be required to retire generating capacity prior to the end of its estimated life. The costs of complying with these legal requirements could also
adversely affect Kentucky Power’s results of operations, financial condition and cash flows, and those of the Company following the closing of the Kentucky Power Transaction. In addition, the impacts could become even more significant if existing
requirements governing air emissions management and disposal, CCR waste and/or waste matter discharge become more restrictive in the future, more extensive operating and/or permitting requirements are imposed or additional substances associated with
power generation are subjected to increased regulation. Although Kentucky Power typically recovers expenditures for pollution control technologies, replacement generation, undepreciated plant balances and associated operating costs from customers,
there can be no assurance that Kentucky Power will be able to obtain a rate order to fully recover the remaining costs associated with such plants in the future. The failure to recover these costs could reduce Kentucky Power’s results of operations,
financial condition and cash flows, and those of the Company following the closing of the Kentucky Power Transaction.
In addition, future changes to environmental laws, including with
respect to the regulation of CO2 emissions, could cause the Company and Kentucky Power to incur materially higher costs than Kentucky Power has incurred to date.
Kentucky Power’s service territory experienced significant flooding as
a result of severe weather experienced in late July 2022, which resulted in additional operating and capital expenditures being incurred by Kentucky Power. While a
| Management Discussion & Analysis |
57 |
regulatory asset has been established for such expenditures, regulatory
review of those expenditures would not occur until Kentucky Power’s next rate case, which is expected to be filed in 2023. As a result, the Company’s financial condition, cash flows and results of operations could be adversely impacted based on the
determination made in that case.
International Investment Risk
The Company operates in markets, or may pursue growth opportunities in
new markets, that are subject to regulation by various foreign governments and regulatory authorities and to the application of foreign laws. Such foreign laws or regulations may not provide the same type of legal certainty and rights, in connection
with the Company’s contractual relationships in such countries, as are afforded to the Company in Canada and the U.S., which may adversely affect the Company’s ability to receive revenues or enforce its rights in connection with any operations or
projects in such jurisdictions. In addition, the laws and regulations of some countries may limit the Company’s ability to hold a majority interest in certain projects, thus limiting the Company’s ability to control the operations of such projects.
Any existing or new operations or interests of the Company may also be subject to significant political, economic and financial risks, which vary by country, and may include: (i) changes in government laws, policies or personnel or a country’s
constitution; (ii) changes in general economic conditions; (iii) restrictions on currency transfer or convertibility; (iv) changes in labour relations; (v) political instability and civil unrest; (vi) regulatory or other changes adversely affecting
the local utility market; (vii) breach or repudiation of important contractual undertakings and expropriation and confiscation of assets and facilities without compensation or compensation that is less than fair market value; (viii) less developed or
efficient financial markets than in North America; (ix) the absence of uniform accounting, auditing and financial reporting standards, practices and disclosure requirements; (x) less government supervision and regulation; (xi) a less developed legal
or regulatory environment, including uncertainty in outcomes and actions that may be inconsistent with the rule of law; (xii) heightened exposure to corruption risk; (xiii) political hostility to investments by foreign investors, including laws
affecting foreign ownership; (xiv) less publicly available information in respect of companies; (xv) adversely higher or lower rates of inflation; (xvi) higher transaction costs; and (xvii) fewer investor protections.
The Company may suffer a significant loss resulting from fraud,
bribery, corruption or other illegal acts, or from inadequate or failed internal processes or systems. The Company operates in multiple jurisdictions and it is possible that its operations and development activities may expand into new jurisdictions.
Doing business in multiple jurisdictions requires the Company to comply with the laws and regulations of such jurisdictions. These laws and regulations may apply to the Company, its subsidiaries, individual directors, officers, employees and
third-party agents. The Company is also subject to anti-bribery and anti-corruption laws, including the Canadian Corruption of Foreign Public Officials Act and the U.S. Foreign Corrupt Practices Act. As the Company makes acquisitions and pursues
development activities internationally, it is exposed to increased corruption-related risks, including potential violations of applicable anti-corruption laws.
The Company relies on its infrastructure, controls, systems and
personnel, as well as central groups focusing on enterprise-wide management of specific operational risks such as fraud, trading, outsourcing, and business disruption, to manage the risk of illegal and corrupt acts or failed systems. The Company also
relies on its employees and certain third parties to comply with its policies and processes as well as applicable laws. The failure to adequately identify or manage these risks, and the acquisition of businesses with weak internal controls to manage
the risk of illegal or corrupt acts, could result in direct or indirect financial loss, regulatory censure and/or harm to the Company’s reputation.
Risks Specific to the Atlantica Investment
The Company’s investment in Atlantica exposes the Company to certain
risks that are particular to Atlantica’s business and the markets in which Atlantica operates.
Atlantica owns, manages and acquires renewable energy, conventional
power, electric transmission lines and water assets in certain jurisdictions where the Company may not operate. The Company, through its investment in Atlantica, is indirectly exposed to certain risks that are particular to the markets in which it
operates, including, but not limited to, risks related to: conditions in the global economy; changes to national and international laws, political, social and macroeconomic risks relating to the jurisdictions in which Atlantica operates, including in
emerging markets, which could be subject to economic, social and political uncertainties; anti-bribery and anti-corruption laws and substantial penalties and reputational damage from any non-compliance therewith; significant currency exchange rate
fluctuations; Atlantica’s ability to identify and/or consummate future acquisitions on favourable terms or at all; Atlantica’s inability to replace, on similar or commercially favourable terms, expiring or terminated offtake agreements; termination
or revocation of Atlantica’s concession agreements or offtake agreements; and various other factors. These risks could affect the profitability and growth of Atlantica’s business, and ultimately the profitability of the Company’s anticipated
investment therein. On February 21, 2023, Atlantica announced that its board of directors has commenced a process to explore and evaluate potential strategic alternatives to maximize shareholder value (the “Atlantica Strategic Review”). There is a
risk that the Atlantica Strategic Review could result in the approval or completion of a transaction or other change in Atlantica’s business strategy that is not aligned with the Company’s interests. If any of the foregoing were to occur, the value
of the Company’s investment could decrease and the Company’s financial condition, results of operations and cash flows could be adversely affected.
The Company’s international activities and operations, including
through the Liberty JV, expose the Company to similar risks and could likewise affect the profitability, financial condition and growth of the Company.
The Company accounts for its investment in Atlantica using the Fair
Value Method (see Note 8(a) in the annual consolidated financial statements). AQN records in the consolidated statement of operations the fluctuations in the fair value of Atlantica shares and dividend income when it is declared. Dividends
declared and paid by Atlantica are made at the discretion of Atlantica’s board of directors. The Company does not control the board of directors of Atlantica. Therefore, there can be no assurance that dividends will continue to be paid on Atlantica’s
ordinary shares, will continue to be paid at the same rate as they are currently being paid or will be paid at any specified target rate. A loss of Atlantica dividend income, as a result of any reduction or suspension by Atlantica of its dividend or
in the event that the Company were to dispose of its equity interest in Atlantica, could have a material adverse impact on the Company’s cash flows and net income.
Joint Venture Investment Risk
The Company has, and may in the future continue to have, an equity
interest of 50% or less and/or partners in certain projects and facilities, including those owned by the joint venture between the Company and funds managed by the Infrastructure and Power strategy of Ares Management LLC. As a result, the Company may
not control such projects and facilities and its interest may be subject to the decision-making of third parties, and the Company may be reliant on a third party’s personnel, good faith, contractual compliance, expertise, historical performance,
technical resources and information systems, proprietary information and judgment in providing the services. This may limit the Company’s flexibility and financial returns with respect to these projects and facilities, and create risks to the
Company, including that the joint venture partner may:
|
● |
have economic or business interests or goals that are inconsistent with the Company’s economic or business interests or goals; |
|
● |
take actions contrary to the Company’s policies or objectives with respect to the Company’s investments; |
|
● |
contravene applicable anti-bribery laws that carry substantial penalties for non-compliance and could cause reputational damage and a material adverse effect on the
business, financial position and results of operations of the joint venture and the Company; |
|
● |
have to give its consent with respect to certain major decisions, including among others, decisions relating to funding and transactions with affiliates; |
|
● |
become bankrupt, limiting its ability to meet calls for capital contributions and potentially making it more difficult to refinance or sell projects; |
|
● |
become engaged in a dispute with the Company that might affect the Company’s ability to develop a project; |
|
● |
have competing interests in the Company’s markets that could create conflict of interest issues; or |
|
● |
have different accounting policies than the Company. |
The Liberty JV (through Liberty Development Energy Solutions B.V.) is a
party to a secured credit facility in the amount of $306.5 million (the “Liberty JV Secured Credit Facility”) and holds a preference share ownership interest in Liberty (AY Holdings) B.V. (“AY Holdings”). The Liberty JV Secured Credit Facility is
collateralized through a pledge of Atlantica ordinary shares held by AY Holdings. A collateral shortfall would occur if the net obligation (as defined in the credit agreement) would equal or exceed 50% of the market value of such Atlantica shares. In
the event of a collateral shortfall, the Liberty JV is required to prepay a portion of the loan or post additional collateral in cash to reduce the net obligation to 40% of the total collateral provided (the “Collateral Reset Level”). If the Liberty
JV were unable to fund the collateral shortfall, or certain other events of default occur, the Liberty JV Secured Credit Facility lenders hold the right to sell Atlantica shares to pay amounts outstanding under the facility, including reducing the
facility to the Collateral Reset Level. The Liberty JV Secured Credit Facility is repayable on demand if Atlantica ceases to be a public company or if certain other events are announced or completed that could restrict the Company’s ability to sell
or transfer its Atlantica ordinary shares. If the Liberty JV were unable to repay the amounts owed, the lenders would have the right to realize on their collateral.
The Company has entered into Equity Capital Contribution Agreements
(“ECCA”) with certain of its project development entities it holds an equity interest in. The ECCAs obligate the Company to provide funding upon the realization of certain completion milestones related to the projects under development. The ECCAs
have been pledged as collateral against construction loans obtained by the project entities and may require the Company to fund in amounts in excess of the underlying value of the assets. The Company has also provided guarantees of performance for
certain development projects owned by the equity investees. The Company’s maximum exposure to loss (as defined in U.S. GAAP under ASC 810) on these agreements and guarantees is $658.2 million.
Please refer to Note 8 in the annual consolidated financial
statements for a description of the Company’s Long Term Investments and Notes Receivable.
| Management Discussion & Analysis |
59 |
Dispositions
For financial, strategic and other reasons, the Corporation may from
time to time dispose of, or desire to dispose of, businesses or assets (in whole or in part) that it owns. For instance, on January 12, 2023, AQN announced that it is targeting approximately $1 billion of asset sales. Any disposition by the
Corporation may result in recognition of a loss upon such a sale and may result in a decrease to its revenues, cash flows and net income and a change to its business mix. In addition, the Corporation may not be able to dispose of businesses or assets
that the Corporation desires to sell for financial, strategic and other business reasons at all or at a price acceptable to the Corporation. Failure to execute on any planned disposition may require the Corporation to seek alternative sources of
funds or incur additional indebtedness, which may, among other things, cause rating agencies to re-evaluate or downgrade the Corporation’s existing credit ratings. Each of the foregoing items may have an adverse effect on the Corporation’s business,
results of operations, cost of capital or financial condition.
Asset Retirement Obligations
AQN and its subsidiaries complete periodic reviews of potential asset
retirement obligations that may require recognition. As part of this process, AQN and its subsidiaries consider the contractual requirements outlined in their operating permits, leases, and other agreements, the probability of the agreements being
extended, the ability to quantify such expense, the timing of incurring the potential expenses, as well as other factors which may be considered in evaluating if such obligations exist and in estimating the fair value of such obligations.
In conjunction with acquisitions and developed projects, the Company
assumed certain asset retirement obligations. The asset retirement obligations mainly relate to legal requirements for: (i) removal or decommissioning of power generating facilities; (ii) cut (disconnect from the distribution system), purge (clean of
natural gas and PCB contaminants), and cap natural gas mains within the natural gas distribution and transmission system when mains are retired in place, or dispose of sections of natural gas mains when removed from the pipeline system; (iii) clean
and remove storage tanks containing waste oil and other waste contaminants; and (iv) remove asbestos upon major renovation or demolition of structures and facilities.
Cycles and Seasonality
Regulated Services Group
The Regulated Services Group’s demand for water is affected by weather
conditions and temperature. Demand for water during warmer months is generally greater than cooler months due to requirements for irrigation, swimming pools, cooling systems and other outside water use. If there is above normal rainfall or rainfall
is more frequent than normal the demand for water may decrease, adversely affecting revenues.
The Regulated Services Group’s demand for energy from its electric
distribution systems is primarily affected by weather conditions and conservation initiatives. The Regulated Services Group provides information and programs to its customers to encourage the conservation of energy. In turn, demand may be reduced
which could have short-term adverse impacts on revenues.
The Regulated Services Group’s primary demand for natural gas from its
natural gas distribution systems is driven by the seasonal heating requirements of its residential, commercial, and industrial customers. The colder the weather, the greater the demand for natural gas to heat homes and businesses. As such, the
natural gas distribution systems demand profile typically peaks in the winter months of January and February and declines in the summer months of July and August. Year to year variability also occurs depending on how cold the weather is in any
particular year.
There is a risk that climate change impacts the seasonality and demand for water,
electricity and natural gas.
The Company attempts to mitigate the above noted risks by seeking
regulatory mechanisms during rate review proceedings. While not all regulatory jurisdictions have approved mechanisms to mitigate demand fluctuations, to date, the Regulated Services Group has successfully obtained regulatory approval to implement
such decoupling mechanisms in 7 of 13 states. An example of such a mechanism is seen at the Peach State Gas System in Georgia, where a weather normalization adjustment is applied to customer bills during the months of October through May that adjusts
commodity rates to stabilize the revenues of the utility for changes in billing units attributable to weather patterns.
Renewable Energy Group
The Renewable Energy Group’s hydroelectric operations are impacted by
seasonal fluctuations and year to year variability of the available hydrology. These assets are primarily “run-of-river” and as such fluctuate with natural water flows. During the winter and summer periods, flows are generally lower, while during the
spring and fall periods flows are generally higher. The ability of these assets to generate income may be impacted by changes in water availability or other material hydrologic events within a watercourse. Year to year, the level of hydrology varies,
impacting the amount of power that can be generated in a year.
The Renewable Energy Group’s wind generation facilities are impacted by
seasonal fluctuations and year to year variability of the wind resource. During the fall, winter and spring periods, winds are generally stronger than during the summer
period. The ability of these facilities to generate income may be
impacted by naturally occurring changes in wind patterns and wind strength.
The Renewable Energy Group’s solar generation facilities are impacted
by seasonal fluctuations and year to year variability in solar radiance. For instance, there are more daylight hours in the summer than there are in the winter, resulting in higher production in the summer months. The ability of these facilities to
generate income may be impacted by naturally occurring changes in solar radiance, such as cloud cover and snow.
The Company attempts to mitigate the above noted natural resource
fluctuation risks by acquiring or developing generating stations in different geographic locations.
Development and Construction Risk
The Company actively engages in the development and construction of new
power generation facilities. There can be no assurance that the Corporation will be able to identify attractive acquisition or development candidates in the future or that it will be able to realize growth opportunities that improve the Corporation’s
financial results or increase the amount of cash available for distribution There is always a risk that material delays, technical issues with interconnection and the interconnection utility, required upgrades to interconnection facilities, required
curtailments of generation, delays in obtaining interconnection rights, and/or cost overruns or lost revenue could be incurred in any of the projects planned or currently in construction affecting the Company’s overall performance. There are risks
that actual costs may exceed budget estimates, delays may occur in obtaining permits and materials, suppliers and contractors may not perform as required under their contracts, warranties under contracts may be unfilled or insufficient, there may be
inadequate availability, productivity or increased cost of qualified craft or local labour, start-up activities may take longer than planned, curtailment of a facility’s output may be required, the scope, actual or expected returns, and timing of
projects may change, and other events beyond the Company’s control may occur, in each case that may materially affect the viability, schedule, budget, cost and performance of projects. Regulatory approvals can be challenged by a number of mechanisms
which vary across state and provincial jurisdictions. Such permitting challenges could identify issues that may result in permits being modified or revoked.
Risks Specific to Renewable Generation Projects:
The strength and consistency of the wind resource will vary from the
estimate set out in the initial wind studies that were relied upon to determine the feasibility of the wind facility. If weather patterns change or the historical data proves not to accurately reflect the strength and consistency of the actual wind,
the assumptions underlying the financial projections as to the amount of electricity to be generated by the facility may be different and cash could be impacted.
The amount of solar radiance will vary from the estimate set out in the
initial solar studies that were relied upon to determine the feasibility of the solar facility. If weather patterns change or the historical data proves not to accurately reflect the strength and consistency of the solar radiance, the assumptions
underlying the financial projections as to the amount of electricity to be generated by the facility may be different and cash could be impacted.
For certain of its development projects, the Company relies on
financing from third party tax equity investor, the participation of which depends upon qualification of the project for U.S, tax incentives and satisfaction of the investors’ investment criteria. These investors typically provide funding upon
commercial operation of the facility. Should certain facilities not meet the conditions required for tax equity funding, expected returns from the facilities may be adversely impacted.
Litigation Risks and Other Contingencies
AQN and certain of its subsidiaries are involved in various litigation,
claims and other legal and regulatory proceedings that arise from time to time in the ordinary course of business. Any accruals for contingencies related to these items are recorded in the financial statements at the time it is concluded that a
material financial loss is likely and the related liability is estimable. Anticipated recoveries under existing insurance policies are recorded when reasonably assured of recovery.
Mountain View Fire
On November 17, 2020, a wildfire now known as the Mountain View Fire
occurred in the territory of Liberty Utilities (CalPeco Electric) LLC (“Liberty CalPeco”). The cause of the fire remains under investigation, and CAL FIRE has not yet released its final report. There are currently 17 active lawsuits that name certain
subsidiaries of the Company as defendants in connection with the Mountain View Fire, as well as one non-litigation claim brought by the U.S. Department of Agriculture seeking reimbursement for alleged fire suppression costs. Twelve lawsuits are
brought by groups of individual plaintiffs alleging causes of action including negligence, inverse condemnation, nuisance, trespass, and violations of Cal. Pub. Util. Code 2106 and Cal. Health and Safety Code 13007 (one of these twelve lawsuits also
alleges the wrongful death of an individual and various subrogation claims on behalf of insurance companies). In another lawsuit, County of Mono, Antelope Valley Fire Protection District, Toiyabe Indian Health Project, and Bridgeport Indian Colony
allege similar causes of action and seek damages for fire suppression costs, law enforcement costs, property and infrastructure damage, and other costs. In four other lawsuits, insurance companies allege inverse condemnation and negligence and seek
recovery of
| Management Discussion & Analysis |
61 |
amounts paid and to be paid to their insureds. The likelihood of
success in these lawsuits cannot be reasonably predicted. Liberty CalPeco intends to vigorously defend them. The Company has wildfire liability insurance that is expected to apply up to applicable policy limits.
Apple Valley Condemnation Proceedings
On January 7, 2016, the Town of Apple Valley filed a lawsuit seeking to
condemn the utility assets of Liberty Utilities (Apple Valley Ranchos Water) Corp. (“Liberty Apple Valley”). On May 7, 2021, the Court issued a Tentative Statement of Decision denying the Town of Apple Valley’s attempt to take the Apple Valley water
system by eminent domain. The ruling confirmed that Liberty Apple Valley’s continued ownership and operation of the water system is in the best interest of the community. On October 14, 2021, the Court issued the Final Statement of Decision. The
Court signed and entered an Order of Dismissal and Judgment on November 12, 2021. On January 7, 2022, the Town filed a notice of appeal of the judgment entered by the Court. On August 2, 2022, the Court issued a ruling awarding Liberty Apple Valley
approximately $13.2 million in attorney’s fees and litigation costs. The Town filed a notice of appeal of the fee award on August 22, 2022. The Town’s appeal of the condemnation judgment and fee award have been consolidated into one appellate docket.
Information Security Risk
The Company relies upon its and third-party information and operational
technology networks, systems and devices to process, transmit and store electronic information, and to manage and support a variety of business processes and activities and safely operate its assets. The Company also uses its and third-party
information technology systems to record, process and summarize financial information and results of operations for internal reporting purposes and to comply with financial reporting, legal and tax requirements. The Company’s and certain of its
third-party vendors’ technology networks, systems and devices collect and store sensitive data, including system operating information, proprietary business information belonging to the Company and third parties, as well as personal information
belonging to the Company’s customers, employees and other stakeholders. As the Company operates critical infrastructure, it may be at an increased risk of cyber-attacks or other security threats by third parties.
The Company’s, its third-party vendors’ or other counterparties’
technology systems and technology networks, devices and infrastructure may be vulnerable to damage, disruptions or shutdowns due to attacks by hackers or breaches due to employee error or malfeasance, disruptions during software or hardware upgrades,
telecommunication failures, theft, politically-driven attacks (including as a result of the conflict between Russia and Ukraine, and any associated sanctions imposed or actions taken by the United States, Canada or other countries or retaliatory
measures by Russia), acts of war or terrorism, natural disasters or other similar events. In addition, certain sensitive information and data may be stored by the Company on physical devices, in physical files and records on its premises or
transmitted to the Company verbally, subjecting such information and data to a risk of loss, theft, release and misuse. Methods used to attack critical assets could include general purpose or industry specific malware delivered via network transfer,
removable media, viruses, attachments, or links in e-mails. The methods used by attackers are continuously evolving and can be difficult to predict and detect. The occurrence of any of these events could negatively impact the Company’s operations,
power generation facilities and utility distribution and transmission systems; could cause services disruptions or system failures; could adversely affect safety; could expose the Company, its customers or its employees to a risk of loss or misuse of
information; could affect the ability to earn or collect revenue or correctly record, process and report financial information; and could result in increased costs, legal claims or proceedings, liability or regulatory penalties against the Company,
damage the Company’s reputation or otherwise harm the Company’s business.
The long-term impact of terrorist attacks and cyber-attacks and the
magnitude of the threat of future terrorist attacks and cyber-attacks on the utility and power generation industries in general, and on the Company in particular, cannot be known. Increased security measures to be taken by the Company as a precaution
against possible terrorist attacks and cyber-attacks may result in increased costs to the Company. The Company must also comply with data privacy laws in each of the jurisdictions in which it operates. Certain data privacy laws and other
cybersecurity regulations have expanded in recent years, leading to increased obligations, and fines for breaches of such laws and regulations have increased. The Company may incur additional costs to maintain compliance, or significant financial
penalties, in the event of a breach.
The Company cannot accurately assess the probability that a security
breach may occur or accurately quantify the potential impact of such an event. The Company provides no assurance that it will be able to identify, protect against and remedy all cybersecurity, physical security or system vulnerabilities or that
unauthorized access or errors will be identified and remedied. Should a breach occur, the Company may suffer costs, losses, and damages, all or some of which may not be recoverable through insurance, legal, regulatory, or other processes, and could
materially adversely affect the Company’s business and results of operations including its reputation with customers, regulators, governments, and financial markets. Resulting costs could include, among others, response, recovery (including ransom
costs), and remediation costs, increased protection or insurance costs, and costs arising from damages and losses incurred by third parties.
Uncertainty surrounding continued hostilities or sustained military
campaigns (including as a result of the conflict between Russia and Ukraine, and any associated sanctions imposed or actions taken by the United States, Canada or other countries or retaliatory measures by Russia) may affect operations of the Company
in unpredictable ways, including
disruptions of supplies and markets for products of the Company, and
the possibility that the Company’s operations or facilities could be direct targets of, or indirect casualties of, an act of terror or cyber-security attack. The effects of hostilities, military campaigns or terrorist or cyber-security attacks could
include disruption to the Company’s generation, transmission and distribution systems or to the electrical grid in general, and could result in a decline in the general economy and have a material adverse effect on the Company.
Technology Infrastructure Implementation Risk
The Company relies upon various information and operational technology
infrastructure systems to carry out its business processes and operations. This subjects the Company to inherent costs and risks associated with maintaining, upgrading, replacing and changing information and operational technology systems. This
includes impairment of its technology systems, potential disruption of operations, business process and internal control systems, substantial capital expenditures, demands on management time and other risks of delays, and difficulties in upgrading,
transitioning and integrating technology systems.
AQN and certain of its subsidiaries are in the process of updating
their technology infrastructure systems through the implementation of an integrated customer solution platform, which is expected to include customer billing, enterprise resource planning systems and asset management systems. The implementation of
these systems is being managed by a dedicated team. Following successful pilot implementations, deployment began in 2022 and is expected to occur in a phased approach across the enterprise through 2024. The implementation of such technology systems
will require the investment of significant financial and human resources. Disruptions, delays or deficiencies in the design, implementation, or operation of these technology systems or integration of these systems with other existing information
technology or operations technology could: adversely affect the Company’s operations, including its ability to monitor its business, pay its suppliers, bill its customers, and report financial information accurately and on a timely basis; lead to
higher than expected costs; lead to increased regulatory scrutiny or adverse regulatory consequences; or result in the failure to achieve the expected benefits. As a result, the Company’s operations, financial condition, cash flows and results of
operations could be adversely affected.
Energy Consumption and Advancement in Technologies Risk
The Company’s generation, distribution and transmission assets are
affected by energy and water demand, sales and operating costs, among other things, in the jurisdictions in which they operate. Demand, sales and operating costs may change as a result of, among other things, fluctuations in general economic
conditions, energy and commodity prices, inflation, interest rates, employment levels, personal disposable income, customer preferences, advancements in new technologies, population or demographic changes and housing starts. Significantly reduced
energy or water demand in the Company’s service territories could reduce capital spending forecasts, and specifically capital spending related to new customer growth. A reduction in capital spending could, in turn, affect the Company’s rate base and
earnings growth. A downturn in economic conditions may have an adverse effect on the Company’s results of operations, financial condition and cash flows despite regulatory measures, where applicable, available to compensate for some or all of the
reduced demand and increased costs, which recovery, if any, may lag costs incurred by the Company. In addition, an extended decline in economic conditions could make it more difficult for customers to pay for the utility services they consume,
thereby affecting the aging and collection of the utilities’ trade receivables.
The emergence of initiatives designed to reduce greenhouse gas
emissions and control or limit the effects of climate change has resulted in incentives and programs to increase energy efficiency and reduce water and energy consumption, including efforts to reduce the availability and reliance on natural gas.
There may also be efforts to move to deregulation in certain of the markets in which the Regulated Services Group operates, which could adversely affect the Company’s business, financial condition and results of operations.
Significant technological advancements are taking place in the
generation and utility industry, including advancements related to self-generation and distributed energy technologies such as fuel cells, micro turbines, battery storage, wind turbines, solar panels and technologies related to lower energy, natural
gas and water use. Adoption of these and other technologies may increase as a result of government subsidies or policies, improving economics and changing customer preferences.
Increased adoption of these practices, requirements and technologies
could reduce demand for utility-scale electricity generation and electric, water, and natural gas distribution, and as a result, the Company’s business, financial condition and results of operations could be adversely affected.
The Company may also invest in and use newly developed, less proven,
technologies or generation methods in its development and construction projects or in maintaining or enhancing its existing operations and assets. There is no guarantee that such new technologies will perform as anticipated. The failure of a new
technology or generation method to perform as anticipated may adversely affect the profitability of a particular development project or existing operations and assets.
| Management Discussion & Analysis |
63 |
The Regulated Services Group seeks to actively engage with regulators,
governments and customers, as appropriate, in an effort to ensure these changes in consumption do not negatively impact the services provided.
Uninsured Risk
The Company maintains insurance coverage for certain exposures, but this
coverage is limited and the Company is generally not fully insured against all significant losses. Insurance coverage for the Company is subject to policy conditions and exclusions, coverage limits, and various deductibles, and not all types of
liabilities and losses may be covered by insurance. Further, certain assets and facilities of the Company are not fully insured, as the cost of the coverage is not economically viable or is not otherwise available. Insurance may not continue to be
offered on an economically feasible basis, or at all, and may not cover all events that could give rise to a loss or claim involving the Company’s assets or operations. There can also be no assurance that insurers will fulfill their obligations. The
Company’s ability to obtain and maintain insurance and the terms of any available insurance coverage could be materially adversely affected by international, national, state or local events and company-specific events, as well as the financial
condition of insurers.
If the Company were to incur a serious uninsured loss or a loss significantly
exceeding the limits of its insurance policies, the results could have a material adverse effect on the Company’s business, results of operations, financial condition and cash flows. In the event of a large uninsured loss, including those caused by
severe weather conditions, natural disasters and certain other events beyond the control of the Regulated Services Group, the Company may make an application to an applicable regulatory authority for the recovery of these costs through customer rates
to offset any loss. However, the Company cannot provide assurance that the regulatory authorities would approve any such application in whole or in part. This potential recovery mechanism is not available to the Renewable Energy Group.
QUARTERLY FINANCIAL INFORMATION
The following is a summary of unaudited quarterly financial information for the eight quarters
ended December 31, 2022:
| |
|
1st Quarter |
|
|
2nd Quarter |
|
|
3rd Quarter |
|
|
4th Quarter |
|
| (all dollar amounts in $ millions except per share information) |
|
2022 |
|
|
2022 |
|
|
2022 |
|
|
2022 |
|
| Revenue |
|
$ |
733.2 |
|
|
$ |
619.4 |
|
|
$ |
664.6 |
|
|
$ |
748.0 |
|
| Net earnings (loss) attributable to shareholders |
|
|
91.0 |
|
|
|
(33.4 |
) |
|
|
(195.2 |
) |
|
|
(74.4 |
) |
| Net earnings (loss) per share |
|
|
0.13 |
|
|
|
(0.05 |
) |
|
|
(0.29 |
) |
|
|
(0.11 |
) |
| Diluted net earnings (loss) per share |
|
|
0.13 |
|
|
|
(0.05 |
) |
|
|
(0.29 |
) |
|
|
(0.11 |
) |
| Adjusted Net Earnings1 |
|
|
141.3 |
|
|
|
109.7 |
|
|
|
72.8 |
|
|
|
151.0 |
|
| Adjusted Net Earnings per common share1 |
|
|
0.21 |
|
|
|
0.16 |
|
|
|
0.11 |
|
|
|
0.22 |
|
| Adjusted EBITDA1 |
|
|
330.6 |
|
|
|
289.3 |
|
|
|
278.5 |
|
|
|
358.3 |
|
| Total assets |
|
|
17,669.9 |
|
|
|
17,737.9 |
|
|
|
17,653.3 |
|
|
|
17,627.6 |
|
| Long term debt2 |
|
|
7,191.6 |
|
|
|
7,455.4 |
|
|
|
7,705.1 |
|
|
|
7,512.3 |
|
| Dividend declared per common share |
|
$ |
0.17 |
|
|
$ |
0.18 |
|
|
$ |
0.18 |
|
|
$ |
0.18 |
|
| |
|
1st Quarter |
|
|
2nd Quarter |
|
|
3rd Quarter |
|
|
4th Quarter |
|
| |
|
2021 |
|
|
2021 |
|
|
2021 |
|
|
2021 |
|
| Revenue |
|
$ |
633.6 |
|
|
$ |
524.1 |
|
|
$ |
524.4 |
|
|
$ |
592.0 |
|
| Net earnings (loss) attributable to shareholders |
|
|
13.9 |
|
|
|
103.2 |
|
|
|
(27.9 |
) |
|
|
175.6 |
|
| Net earnings (loss) per share |
|
|
0.02 |
|
|
|
0.16 |
|
|
|
(0.05 |
) |
|
|
0.27 |
|
| Diluted net earnings (loss) per share |
|
|
0.02 |
|
|
|
0.16 |
|
|
|
(0.05 |
) |
|
|
0.26 |
|
| Adjusted Net Earnings1 |
|
|
124.5 |
|
|
|
91.7 |
|
|
|
96.0 |
|
|
|
137.0 |
|
| Adjusted Net Earnings per common share1 |
|
|
0.20 |
|
|
|
0.15 |
|
|
|
0.15 |
|
|
|
0.21 |
|
| Adjusted EBITDA1 |
|
|
282.9 |
|
|
|
244.8 |
|
|
|
250.3 |
|
|
|
298.3 |
|
| Total assets |
|
|
15,286.1 |
|
|
|
16,453.7 |
|
|
|
16,699.0 |
|
|
|
16,797.5 |
|
| Long term debt2 |
|
|
6,353.7 |
|
|
|
6,622.6 |
|
|
|
6,870.3 |
|
|
|
6,211.7 |
|
| Dividend declared per common share |
|
$ |
0.16 |
|
|
$ |
0.17 |
|
|
$ |
0.17 |
|
|
$ |
0.17 |
|
| 1 |
See Caution Concerning Non-GAAP Measures. |
| 2 |
Includes current portion of long-term debt, long-term debt and convertible
debentures. |
The quarterly results are impacted by various factors including seasonal fluctuations and
acquisitions of facilities as noted in this MD&A.
Quarterly revenues have fluctuated between $524.1 million and $748.0 million
over the prior two year period. A number of factors impact quarterly results including acquisitions, seasonal fluctuations, and winter and summer rates built into the PPAs. In addition, a factor impacting revenues year over year is the fluctuation in
the strength of the Canadian dollar relative to the U.S. dollar which can result in significant changes in reported revenue from Canadian operations.
Quarterly net earnings attributable to shareholders have fluctuated between a
loss of $195.2 million and earnings of $175.6 million over the prior two year period. Earnings have been significantly impacted by non-cash factors such as deferred tax recovery and expense, impairment of intangibles, property, plant and equipment
and mark-to-market gains and losses on financial instruments.
SUMMARY FINANCIAL INFORMATION OF ATLANTICA
The Company owns an approximately 42% beneficial interest in Atlantica. AQN
accounts for its interest in Atlantica using the fair value method (see Note 8(a) in the annual consolidated financial statements). The summary financial information of Atlantica in the following table is derived from the consolidated
financial statements of Atlantica as of December 31, 2022 and 2021 and for the years then ended which are reported in U.S. dollars and were prepared using International Financial Reporting Standards, as issued by the International Accounting
Standards Board (“IFRS”). The recognition, measurement and disclosure requirements of IFRS differ from U.S. GAAP as applied by the Company.
| (all dollar amounts in $ millions) |
|
2022 |
|
|
2021 |
|
| Revenue |
|
$ |
1,102.0 |
|
|
$ |
1,211.7 |
|
| Loss for the year |
|
|
(2.1 |
) |
|
|
(10.9 |
) |
| Total non-current assets |
|
|
8,069.2 |
|
|
|
8,585.0 |
|
| Total current assets |
|
|
1,031.7 |
|
|
|
1,166.9 |
|
| Total non-current liabilities |
|
|
6,792.9 |
|
|
|
7,178.9 |
|
| Total current liabilities |
|
|
519.0 |
|
|
|
824.4 |
|
DISCLOSURE CONTROLS AND PROCEDURES
AQN’s management carried out an evaluation as of December 31, 2022, under the
supervision of and with the participation of AQN’s Chief Executive Officer (“CEO”) and Chief Financial Officer (“CFO”), of the effectiveness of the design and operations of AQN’s disclosure controls and procedures (as defined in Rule 13a-15(e) and
Rule 15d-15(e) under the Securities Exchange Act of 1934, as amended (the “Exchange Act”)). Based on that evaluation, the CEO and the CFO have concluded that as of December 31, 2022, AQN’s disclosure controls and procedures are effective to provide
reasonable assurance that information required to be disclosed by AQN in reports that it files or submits under the Exchange Act is recorded, processed, summarized, and reported within the time periods specified in rules and forms of the U.S.
Securities and Exchange Commission, and is accumulated and communicated to management, including the CEO and CFO, as appropriate, to allow timely decisions regarding required disclosure.
Management Report on Internal Controls over Financial Reporting
Management, including the CEO and the CFO, is responsible for establishing and
maintaining internal control over financial reporting (as defined in Rules 13a-15(f) under the Exchange Act) to provide reasonable, but not absolute, assurance regarding the reliability of financial reporting and the preparation of financial
statements for external purposes in accordance with U.S. GAAP.
The Company’s internal control over financial reporting framework includes
those policies and procedures that (i) pertain to the maintenance of records that, in reasonable detail, accurately and fairly reflect the transactions and dispositions of the assets of the Company, (ii) provide reasonable assurance that transactions
are recorded as necessary to permit preparation of financial statements in accordance with U.S. GAAP, and that receipts and expenditures of the Company are being made only in accordance with authorizations of management and directors of the Company;
and (iii) provide reasonable assurance regarding prevention or timely detection of unauthorized acquisition, use or disposition of the Company’s assets that could have a material effect on the Company’s consolidated financial statements.
Management assessed the effectiveness of the Company’s internal control over
financial reporting as of December 31, 2022, based on the framework established in Internal Control - Integrated Framework (2013) issued by COSO. This assessment included review of the documentation of controls, evaluation of the design effectiveness
of controls, testing of the operating effectiveness of controls, and a conclusion on this evaluation. Based on this assessment, management concluded that the Company’s internal control over financial reporting was effective as of December 31, 2022 to
provide reasonable assurance regarding the reliability of financial reporting and the preparation of consolidated financial
| Management Discussion & Analysis |
65 |
statements for external reporting purposes in accordance with U.S. GAAP.
Management reviewed the results of its assessment with the Audit Committee of the Board of Directors of AQN.
The Company acquired Liberty NY Water effective January 1, 2022. The financial
information for this acquisition is included in this MD&A and in Note 3 to the annual consolidated financial statements. Liberty NY Water contributed $125.4 million in revenue and $21.8 million in operating income, representing approximately 5%
and 4% of the Company’s consolidated revenue and operating income, respectively, for the year ended December 31, 2022. Liberty NY Water represented approximately 4% of the Company’s total consolidated assets, and 3% of the Company’s total
consolidated liabilities, respectively, as of December 31, 2022. National Instrument 52-109 and the U.S. Securities and Exchange Commission provide an exemption whereby companies undergoing acquisitions can exclude the acquired business in the year
of acquisition from the scope of testing and assessment of design and operational effectiveness of controls over financial reporting. Due to the complexity associated with assessing internal controls during integration efforts, the Company has
utilized the scope exemption as it relates to this acquisition in its management report on internal controls over financial reporting for the year ending December 31, 2022.
Changes in Internal Controls over Financial Reporting
During the fiscal quarter ended December 31, 2022, there was a material change
to the Company’s internal controls over financial reporting, as the Company updated certain of its technology infrastructure systems through the implementation of an integrated customer solution platform, customer billing, and enterprise resource
planning systems across core business processes for the Company’s East Region regulated entities and processes in the corporate function. This change to the Company’s internal controls included an assessment of the necessary and appropriate processes
and controls with a view to ensuring that the design and operation of controls remains effective over financial reporting.
Management assessed the design and operating effectiveness of the changed
controls based on the same framework established in Internal Control - Integrated Framework (2013) issued by COSO as at and through December 31, 2022. Except as described above, there have been no further changes in the Company’s internal control
over financial reporting that occurred that have materially affected, or are reasonably likely to materially affect, the Company’s internal control over financial reporting.
Inherent Limitations on Effectiveness of Controls
Due to its inherent limitations, disclosure controls and procedures or
internal control over financial reporting may not prevent or detect all misstatements based on error or fraud. Further, the effectiveness of internal control is subject to the risk that controls may become inadequate because of changes in conditions,
or that the degree of compliance with policies or procedures may change.
CRITICAL ACCOUNTING ESTIMATES AND POLICIES
AQN prepared its annual consolidated financial statements in accordance with
U.S. GAAP. The preparation of the annual consolidated financial statements requires management to make estimates and assumptions that affect the reported amounts of assets and liabilities, related amounts of revenues and expenses, and disclosure of
contingent assets and liabilities. Significant areas requiring the use of management judgment relate to the scope of consolidated entities, the recoverability of assets, the measurement of deferred taxes and the recoverability of deferred tax assets,
rate-regulation, unbilled revenue, pension and post-employment benefits, fair value of derivatives and fair value of assets and liabilities acquired in a business combination. Actual results may differ from these estimates.
AQN’s significant accounting policies and new accounting standards are
discussed in Notes 1 and 2 in the annual consolidated financial statements, respectively. Management believes the following accounting policies involve the application of critical accounting estimates. Accordingly, these accounting
estimates have been reviewed and discussed with the Audit Committee of the Board of Directors of AQN.
Consolidation and Variable Interest Entities
The Company uses judgment to assess whether its operations or investments
represent variable interest entities (“VIEs”). In making these evaluations, management considers (a) the sufficiency of the investment’s equity at risk, (b) the existence of a controlling financial interest, and (c) the structure of any voting
rights. In addition, management considers the specific facts and circumstances of each investment in a VIE when determining whether the Company is the primary beneficiary. The factors that management takes into consideration include the purpose and
design of the VIE, the key decisions that affect its economic performance, whether the parties to the arrangements are related parties or de facto agents of the Company, and whether the Company has the power to direct the activities that would most
significantly affect the economic performance of the VIE. Management’s judgment is also required to determine whether the Company has the right to receive benefits or the obligation to absorb losses of the VIE. Based on the judgments made, the
Company will consolidate the VIE if it determines that it is the primary beneficiary.
Estimated Useful Lives and Recoverability of Long-Lived Assets, Intangibles
Assets, Goodwill and Long-term Investments
The Company makes judgments (a) to determine the recoverability of a
development project, and the period over which the costs are capitalized during the development and construction of the project, (b) to assess the nature of the costs to be capitalized, (c) to distinguish individual components and major overhauls,
and (d) to determine the useful lives or unit-of-production over which assets are depreciated.
Depreciation rates on most utility assets are subject to regulatory review and
approval, and depreciation expense is recovered through rates set by ratemaking authorities. The recovery of those costs is dependent on the ratemaking process.
The carrying value of long-lived assets, intangible assets, goodwill and
long-term investments, is reviewed whenever events or changes in circumstances indicate that such carrying values may not be recoverable, and at least annually for goodwill. Equity method investments are reviewed to determine whether an
other-than-temporary decline in value has occurred and an impairment exists. Some of the factors AQN considers as indicators of impairment include a significant change in operational or financial performance, unexpected outcome from rate orders,
natural disasters, energy pricing and changes in regulation. When such events or circumstances are present, the Company assesses whether the carrying value will be recovered through the expected future cash flows. If the facility includes goodwill,
the fair value of the facility is compared to its carrying value. Both methodologies are sensitive to the forecasted cash flows and in particular energy prices, long-term growth rate and, discount rate for the fair value calculation.
In 2022 and 2021, management assessed qualitative and quantitative factors for
each of the reporting units that were allocated goodwill. No goodwill impairment provision was required. During the fourth quarter of 2022, the Company recorded an impairment charge of $235.5 million to reduce the carrying value of its investment in
the Texas Coastal Wind Facilities and the carrying value of the Senate Wind Facility which began commercial operations in 2012. These impaired assets operate within the ERCOT market, and the 2022 Impairment recorded is primarily due to declining
forecasted energy prices in ERCOT for the Senate Wind Facility and continued challenges with congestion at the Texas Costal Wind Facilities. The Company determined fair value using an income approach. Changes in assumptions of revenue forecasts,
driven by expected production, basis difference and resulting spot prices, projected operating and capital expenditures would affect the estimated fair value.
Valuation of Deferred Tax Assets
In assessing the realization of deferred tax assets, management aims to
consider all evidence, both positive and negative, to determine whether it is more likely than not that deferred tax assets will be realized. A piece of objective evidence evaluated is cumulative earnings or losses incurred over the three-year
period. Even with a cumulative loss, management will typically review a forecast of future taxable income and consider tax planning strategies before making its final assessment.
Primarily as a result of the 2022 Impairment, the U.S. entities in the
Renewable Energy Group, which have historically been in an overall deferred tax liability position, were in an overall deferred tax asset position as at December 31, 2022. In the course of assessing the U.S. deferred tax assets in the Renewable
Energy Group, management concluded that, during the fourth quarter of 2022, it was no longer probable that the Renewable Energy Group would generate sufficient taxable income to realize the benefit of the deferred tax assets of such group.
Management’s conclusion is based on the balance of all available positive and negative evidence applicable to the Renewable Energy Group, including material impairment charges recorded on certain assets, insufficient taxable temporary differences to
allow the full utilization of the deferred tax asset, insufficient forecasted taxable income and a historical 3-year cumulative loss position. The amount of the deferred tax asset considered realizable could be adjusted if estimates of future taxable
income during the carryforward period are reduced or increased or if objective negative evidence in the form of cumulative losses is no longer present and additional weight is given to subjective evidence such as management projections for growth.
Accounting for Rate Regulation
Accounting guidance for regulated operations provides that rate-regulated
entities account for and report assets and liabilities consistent with the recovery of those incurred costs in rates if the rates established are designed to recover the costs of providing the regulated service and if the competitive environment
makes it probable that such rates can be charged and collected. This accounting guidance is applied to the Regulated Services Group’s operations, with the exception of ESSAL.
Certain expenses and revenues subject to utility regulation or rate
determination normally reflected in income are deferred on the balance sheet as regulatory assets or liabilities and are recognized in income as the related amounts are included in service rates and recovered from or refunded to customers. Regulatory
assets and liabilities are recorded when it is probable that these items will be recovered or reflected in future rates. Determining probability requires significant judgment on the part of management and includes, but is not limited to,
consideration of testimony presented in regulatory hearings, proposed regulatory decisions, final regulatory orders and industry practice. If events were to occur that would
| Management Discussion & Analysis |
67 |
make the recovery of these assets and liabilities no longer probable, these
regulatory assets and liabilities would be required to be written off or written down.
Unbilled Energy Revenues
Revenues related to natural gas, electricity and water delivery are generally
recognized upon delivery to customers. The determination of customer billings is based on a systematic reading of meters throughout the month. At the end of each month, amounts of natural gas, energy or water provided to customers since the date of
the last meter reading are estimated, and the corresponding unbilled revenue is recorded. Factors that can impact the estimate of unbilled energy include, but are not limited to, seasonal weather patterns compared to normal, total volumes supplied to
the system, line losses, economic impacts, and composition of customer classes. Estimates are reversed in the following month and actual revenue is recorded based on subsequent meter readings.
Derivatives
AQN uses derivative instruments to manage exposure to changes in commodity
prices, foreign exchange rates, and interest rates. Management’s judgment is required to determine if a transaction meets the definition of a derivative and, if it does, whether the normal purchases and sales exception applies or whether individual
transactions qualify for hedge accounting treatment. Management’s judgment is also required to determine the fair value of derivative transactions. AQN determines the fair value of derivative instruments based on forward market prices in active
markets obtained from external parties adjusted for nonperformance risk. A significant change in estimate could affect AQN’s results of operations if the hedging relationship was considered no longer effective.
Pension and Post-employment Benefits
The obligations and related costs of defined benefit pension and
post-employment benefit plans are calculated using actuarial concepts, which include critical assumptions related to the discount rate, mortality rate, compensation increase, expected rate of return on plan assets and medical cost trend rates. These
assumptions are important elements of expense and/or liability measurement and are updated on an annual basis, or upon the occurrence of significant events. The mortality assumption for December 31, 2022 uses the Pri-2012 mortality table and the
projected generationally scale MP-2021, adjusted to reflect the ultimate improvement rates in the 2021 Social Security Administration intermediate assumptions for plans in the United States. The mortality assumption for the Bermuda plan as of
December 31, 2022 uses the 2014 Canadian Pensioners’ Mortality Table combined with mortality improvement scale CPM-B.
The sensitivities of key assumptions used in measuring accrued benefit
obligations and benefit plan cost for 2022 are outlined in the following table. They are calculated independently of each other. Actual experience may result in changes in a number of assumptions simultaneously. The types of assumptions and method
used to prepare the sensitivity analysis has not changed from previous periods and is consistent with the calculation of the retirement benefit obligations and net benefit plan cost recognized in the consolidated financial statements.
| |
|
2022 Pension Plans |
|
|
2022 OPEB Plans |
|
| |
|
|
|
|
|
|
|
Accumulated |
|
|
|
|
| |
|
Accrued |
|
|
|
|
|
Postretirement |
|
|
Net Periodic |
|
| |
|
Benefit |
|
|
Net Periodic |
|
|
Benefit |
|
|
Postretirement |
|
| (all dollar amounts in $ millions) |
|
Obligation |
|
|
Pension Cost |
|
|
Obligation |
|
|
Benefit Cost |
|
| Discount Rate |
|
|
|
|
|
|
|
|
|
|
|
|
|
|
|
|
| 1% increase |
|
|
(53.4 |
) |
|
|
(2.2 |
) |
|
|
(24.7 |
) |
|
|
(2.2 |
) |
| 1% decrease |
|
|
63.8 |
|
|
|
6.3 |
|
|
|
30.6 |
|
|
|
4.4 |
|
| Future compensation rate |
|
|
|
|
|
|
|
|
|
|
|
|
|
|
|
|
| 1% increase |
|
|
1.9 |
|
|
|
1.8 |
|
|
|
— |
|
|
|
— |
|
| 1% decrease |
|
|
(1.7 |
) |
|
|
(1.7 |
) |
|
|
— |
|
|
|
— |
|
| Expected return on plan assets |
|
|
|
|
|
|
|
|
|
|
|
|
|
|
|
|
| 1% increase |
|
|
— |
|
|
|
(6.6 |
) |
|
|
— |
|
|
|
(1.8 |
) |
| 1% decrease |
|
|
— |
|
|
|
6.6 |
|
|
|
— |
|
|
|
1.8 |
|
| Health care trend |
|
|
|
|
|
|
|
|
|
|
|
|
|
|
|
|
| 1% increase |
|
|
— |
|
|
|
— |
|
|
|
28.7 |
|
|
|
7.0 |
|
| 1% decrease |
|
|
— |
|
|
|
— |
|
|
|
(23.5 |
) |
|
|
(4.2 |
) |
Business Combinations
The Company has completed a number of business combinations in the past few
years. Management’s judgment is required to estimate the purchase price, to identify and to fair value all assets and liabilities acquired. The determination of the fair value of assets and liabilities acquired is based upon management’s estimates
and certain assumptions generally included in a present value calculation of the related cash flows.
Acquired assets and liabilities assumed that are subject to critical estimates
include property, plant and equipment, regulatory assets and liabilities, intangible assets, long-term debt and pension and OPEB obligations. The fair value of regulated property, plant and equipment is assessed using an income approach where the
estimated cash flows of the assets are calculated using the approved tariff and discounted at the approved rate of return. The fair value of regulatory assets and liabilities considers the estimated timing of the recovery or refund to customers
through the rate making process. The fair value of intangible assets is assessed using a multi-period excess earnings method. The fair value of long-term debt is determined using a discounted cash flow method and current interest rates. The pension
and OPEB obligations are valued by external actuaries using the guidelines of ASC 805, Business combinations.
| Management Discussion & Analysis |
69 |
Consolidated Financial Statements of
Algonquin Power & Utilities Corp.
For the years ended December 31, 2022 and 2021
MANAGEMENT’S REPORT
Financial Reporting
The accompanying consolidated financial statements and management discussion
and analysis (“MD&A”) are the responsibility of management and have been approved by the Board of Directors.
The consolidated financial statements have been prepared by management in
accordance with U.S. generally accepted accounting principles. Financial statements by nature include amounts based upon estimates and judgments. When alternative accounting methods exist, management has chosen those it deems most appropriate in the
circumstances.
The Board of Directors and its committees are responsible for all aspects
related to governance of the Company. The Audit Committee of the Board of Directors, composed of directors who are unrelated and independent, has a specific responsibility to oversee management’s efforts to fulfill its responsibilities for financial
reporting and internal controls related thereto. The Committee meets with management and independent auditors to review the consolidated financial statements and the internal controls as they relate to financial reporting. The Audit Committee reports
its findings to the Board of Directors for its consideration in approving the consolidated financial statements for issuance to the shareholders.
Internal Control over Financial Reporting
Management is also responsible for establishing and maintaining adequate
internal control over financial reporting. The Company’s internal control over financial reporting is a process designed to provide reasonable assurance regarding the reliability of financial reporting and the preparation of consolidated financial
statements for external purposes in accordance with generally accepted accounting principles.
The Company acquired New York American Water Company, Inc (subsequently
renamed Liberty Utilities (New York Water) Corp. (“Liberty NY Water”)) effective January 1, 2022. The financial information for this acquisition is included in the MD&A and in Note 3 to the consolidated financial statements. Liberty NY Water
contributed $125,370 in revenue and $21,776 operating income, representing approximately 5% and 4% of the Company’s consolidated revenue and operating income, respectively, for the year ended December 31, 2022. Liberty NY Water represented
approximately 4% of the Company’s total consolidated assets, and 3% of the Company’s total consolidated liabilities, respectively, as of December 31, 2022. National Instrument 52-109 and the U.S. Securities and Exchange Commission provide an
exemption whereby companies undergoing acquisitions can exclude the acquired business in the year of acquisition from the scope of testing and assessment of design and operational effectiveness of controls over financial reporting. Due to the
complexity associated with assessing internal controls during integration efforts, the Company has utilized the scope exemption as it relates to this acquisition in its conclusion on internal controls over financial reporting for the year ending
December 31, 2022.
During the fiscal quarter ended December 31, 2022, there was a material change
to the Company’s internal controls over financial reporting, as the Company updated certain of its technology infrastructure systems through the implementation of an integrated customer solution platform, customer billing, and enterprise resource
planning systems across core business processes for the Company’s East Region regulated entities and processes in the corporate function. This change to the Company’s internal controls included an assessment of the necessary and appropriate processes
and controls with a view to ensuring that the design and operation of controls remains effective over financial reporting.
Management assessed the effectiveness of the Company’s internal control over
financial reporting as of December 31, 2022, based on the framework established in Internal Control – Integrated Framework (2013) issued by the Committee of Sponsoring Organizations of the Treadway Commission (COSO). Based on this
assessment, management concluded that the Company maintained effective internal control over financial reporting as of December 31, 2022. Ernst & Young LLP, the independent registered public accounting firm that audited the accompanying
consolidated financial statements has issued its attestation report on the Company’s internal control over financial reporting,
| March 17, 2023 |
|
|
|
| |
|
|
|
| /s/ Arun Banskota |
|
/s/ Darren Myers |
|
| Chief Executive Officer |
|
Chief Financial Officer |
|
REPORT OF INDEPENDENT REGISTERED PUBLIC ACCOUNTING FIRM
To the Shareholders and Directors of Algonquin Power & Utilities Corp.
Opinion on the Consolidated Financial Statements
We have audited the accompanying consolidated balance sheets of Algonquin
Power & Utilities Corp. (the “Company”), as of December 31, 2022 and 2021, the related consolidated statements of operations, comprehensive income, equity and cash flows for the years then ended, and the related notes (collectively referred to as
the “consolidated financial statements”). In our opinion, the consolidated financial statements present fairly, in all material respects, the financial position of the Company as of December 31, 2022 and 2021, and the results of its operations and
its cash flows for the years then ended in conformity with U.S. generally accepted accounting principles.
We also have audited, in accordance with the standards of the Public Company
Accounting Oversight Board (United States) (“PCAOB”), the Company’s internal control over financial reporting as of December 31, 2022, based on the criteria established in Internal Control – Integrated Framework issued by the Committee of Sponsoring
Organizations of the Treadway Commission (2013 framework), and our report dated March 17, 2023 expressed an unqualified opinion thereon.
Basis for Opinion
These financial statements are the responsibility of the Company’s management.
Our responsibility is to express an opinion on the Company’s financial statements based on our audits. We are a public accounting firm registered with the PCAOB and are required to be independent with respect to the Company in accordance with the US
federal securities laws and the applicable rules and regulations of the Securities and Exchange Commission and the PCAOB.
We conducted our audits in accordance with the standards of the PCAOB. Those
standards require that we plan and perform the audit to obtain reasonable assurance about whether the financial statements are free of material misstatement, whether due to error or fraud. Our audits included performing procedures to assess the risks
of material misstatement of the financial statements, whether due to error or fraud, and performing procedures that respond to those risks. Such procedures include examining, on a test basis, evidence regarding the amounts and disclosures in the
financial statements. Our audits also included evaluating the accounting principles used and significant estimates made by management, as well as evaluating the overall presentation of the financial statements. We believe that our audits provide a
reasonable basis for our opinion.
Critical Audit Matters
The critical audit matters communicated below are matters arising from the
current period audit of the financial statements that were communicated or required to be communicated to the audit committee and that: (1) relate to accounts or disclosures that are material to the financial statements and (2) involved our
especially challenging, subjective, or complex judgments. The communication of critical audit matters does not alter in any way our opinion on the consolidated financial statements, taken as a whole, and we are not, by communicating the critical
audit matters below, providing separate opinions on the critical audit matters or on the accounts or disclosures to which they relate.
| |
Regulatory assets and
liabilities—Recovery of costs through rate regulation |
| Description of the Matter |
As described in Note 7 to the consolidated financial statements, the
Company has approximately $1.27 billion in regulatory assets and approximately $628.2 million in regulatory liabilities that are subject to regulation by the public utility commissions of the regions in which they operate. Rates are
determined under cost of service regulation. The regulation of rates is premised on the full recovery of prudently incurred costs and a reasonable rate of return on assets or common shareholder’s equity. Regulatory decisions can have an
impact on the timely recovery of costs and the approved returns. The recoverability of such costs through rate-regulation impacts multiple financial statement line items and disclosures, including property, plant, and equipment, regulatory
assets and liabilities, derivative instruments, pension and other post-employment benefit obligation, regulated electricity, gas and water distribution revenues and the corresponding expenses, income tax expense, and depreciation and
amortization expense.
Although the Company expects to recover its costs from customers
through rates, there is a risk that the respective regulator will not approve full recovery of the costs incurred. Auditing the recoverability of these costs through rates is complex and highly judgmental due to the significant judgments and
probability assessments made by the Company to support its accounting and disclosure for regulatory matters when final regulatory decisions or orders have not yet been obtained or when regulatory formulas are complex. There is also
subjectivity involved in assessing the potential impact of future regulatory decisions on the financial statements. The Company’s judgments include evaluating the probability of recovery of and recovery on costs incurred, or probability of
refund to customers through future rates.
|
How We
Addressed the
Matter in Our
Audit |
We obtained an understanding, evaluated the design and tested the
operating effectiveness of controls over the Company’s evaluation of the likelihood of recovery of regulatory assets and refund of regulatory liabilities, including management’s controls over the initial recognition and the monitoring and
evaluation of regulatory developments that may affect the likelihood of recovering costs in future rates, a refund, or future changes in rates.
We performed audit procedures that included, amongst others,
evaluating the Company’s assessment of the probability of future recovery for regulatory assets and refund of regulatory liabilities, by comparison to the relevant regulatory orders, filings and correspondence, and other publicly available
information including past precedents. For regulatory matters for which regulatory decisions or orders have not yet been obtained, we inspected the Company’s filings for any evidence that might contradict the Company’s assertions, and
reviewed other regulatory orders, filings and correspondence for other entities within the same or similar jurisdictions to assess the likelihood of recovery in future rates based on the respective regulator’s treatment of similar costs under
similar circumstances. We evaluated the Company’s analysis and compared that analysis with letters from legal counsel, when appropriate, regarding cost recoveries or future changes in rates. We also assessed the methodology and mathematical
accuracy of the Company’s calculations of regulatory asset and liability balances based on provisions and formulas outlined in rate orders and other correspondence with regulators.
|
| |
Impairment of Long-lived Assets
|
Description of
the Matter |
As of December 31, 2022, the Company’s property, plant and equipment
and finite-life intangible assets (collectively, long-lived assets) have an aggregate net book value of approximately $12 billion. As described in Note 1 to the consolidated financial statements, the Company reviews long-lived assets for
impairment whenever events or changes in circumstances indicate that the carrying value of those assets may not be recoverable. Indicators of impairment may include a deteriorating business climate, including, but not limited to, declines in
energy prices, or plans to dispose of a long-lived asset significantly before the end of its useful life. Management determines if long-lived assets are potentially impaired by comparing the undiscounted expected future cash flows to the
carrying value when indicators of impairment exist. When the undiscounted cash flow analysis indicates a long-lived asset or asset group may not be recoverable, the amount of the impairment loss is determined by measuring the excess of the
carrying amount of the long-lived asset or asset group over its fair value. In 2022, as disclosed in Note 5 to the consolidated financial statements, the Company recognized an asset impairment charge of $159.6 million, related to the
Company’s Renewable Energy Group.
Auditing the Company’s valuation of long-lived assets involved
significant judgment to assess the recoverability and the fair value of these long-lived assets. The fair value analysis is primarily based on the income approach using significant assumptions that included the revenue forecasts driven by
expected production, expected energy prices, and projected operating and capital expenditures and the discount rate, which were forward-looking and based upon expectations about future economic and market conditions.
|
How We
Addressed the
Matter in Our
Audit |
We obtained an understanding, evaluated the design and tested the
operating effectiveness of the Company’s controls over the identification of impairment indicators and valuation of the long-lived asset, including management’s review controls of the valuation model, the significant assumptions used to
develop the estimates, and the completeness and accuracy of the data used in the valuations.
When testing the impairment analyses for the Renewable Energy Group,
our audit procedures included, among others, obtaining an understanding of management’s strategic view of the facilities given market conditions, evaluating management’s assessment of the lowest level of identifiable cash flows, assessing the
appropriateness of the methodology, testing the significant assumptions discussed above, testing the computational accuracy of the valuation model and testing the completeness and accuracy of the underlying data used by the Company in its
analyses. We also performed audit procedures that included, among others, assessing the expected production through corroboration with third party engineering reports and historical trends. We assessed the projected operating expenditures by
comparison to historical data and third party operating and maintenance agreements.
With support of our valuation specialists, we assessed the projected
capital expenditures by comparison to historical data and corroboration with independent market data and assessed the estimates of expected energy prices by comparison to historical data, executed power purchase agreements, and to relevant
market curves. We also involved our valuation specialists in the evaluation of the discount rates, which included consideration of benchmark interest rates, geographic location and whether the asset is contracted or uncontracted. We also
performed sensitivity analyses on significant assumptions to evaluate the changes in the fair value of the long-lived assets that would result from changes in the significant assumptions.
|
| |
Impairment of long-term investment in Texas
Coastal Wind Facilities |
|
Description of
the Matter
|
As described in Note 8 to the consolidated financial statements, the
balance of the Company’s equity method investment in Texas Coastal Wind Facilities, was $206.8 million as of December 31, 2022. Management periodically evaluates its equity method investments to determine whether an other-than-temporary
decline in value has occurred and an impairment exists. Management determined that primarily as a result of continued challenges with congestion at the facilities, the carrying value of the interest in the Texas Coastal Wind Facilities
required testing for an other-than-temporary impairment. Management assessed whether the fair value of its investment in Texas Coastal Wind Facilities had declined below its carrying value on an other-than-temporary basis in the fourth
quarter of 2022. In the fourth quarter of 2022, as disclosed in Note 8 to the consolidated financial statements, the Company recorded an impairment charge of $75.9 million.
Auditing the Company’s impairment assessment for Texas Coastal Wind
Facilities was complex and required a high degree of auditor judgment, as the valuation included subjective estimates and assumptions in determining the estimated fair value of the investment. The fair value analysis is primarily based on the
income approach using significant assumptions that included the expected revenue driven by production, expected energy prices, and projected operating and capital expenditures and the discount rate, which were forward-looking and based upon
expectations about future economic and market conditions.
|
How We
Addressed the
Matter in Our
Audit |
We obtained an understanding, evaluated the design and tested the
operating effectiveness of the Company’s controls over the equity method investment impairment review process, including management’s review controls of the valuation model, the significant assumptions used to develop the estimates, and the
completeness and accuracy of the data used in the valuations.
When testing the impairment analyses for Texas Coastal Wind
Facilities, our audit procedures included, among others, assessing the appropriateness of the methodology, testing the significant assumptions discussed above, testing the computational accuracy of the valuation model and testing the
completeness and accuracy of the underlying data used by the Company in its analyses. We also performed audit procedures that included, among others, assessing the expected production through corroboration with third party engineering reports
and historical trends. We assessed the projected operating expenditures by comparison to historical data and third party operating and maintenance agreements.
With support of our valuation specialists, we assessed the projected
capital expenditures by comparison to historical data and corroboration with independent market data and assessed the expected energy prices by comparison to historical data, executed power purchase agreements, and relevant market curves. We
also involved our valuation specialists in the evaluation of the discount rates, which included consideration of benchmark interest rates, geographic location and whether the asset is contracted or uncontracted. We also performed sensitivity
analyses on significant assumptions to evaluate the changes in the fair value of the investment that would result from changes in the significant assumptions.
|
/s/ Ernst & Young LLP
Chartered Professional Accountants
Licensed Public Accountants
We have served as the Company’s auditor since 2013.
Toronto, Canada
March 17, 2023
REPORT OF INDEPENDENT REGISTERED PUBLIC ACCOUNTING FIRM
To the Shareholders and Directors of Algonquin Power & Utilities Corp.
Opinion on Internal Control over Financial Reporting
We have audited Algonquin Power & Utilities Corp.’s internal control
over financial reporting as of December 31, 2022, based on criteria established in Internal Control—Integrated Framework issued by the Committee of Sponsoring Organizations of the Treadway Commission (2013 framework) (the “COSO criteria”). In our
opinion, Algonquin Power & Utilities Corp. (“the Company”) maintained, in all material respects, effective internal control over financial reporting as of December 31, 2022, based on the COSO criteria.
As indicated in the Management Report on Internal Controls over Financial
Reporting section contained in the accompanying Management Discussion and Analysis, management’s assessment of and conclusion on the effectiveness of internal control over financial reporting did not include the internal controls of Liberty Utilities
(New York Water) Corp. (“Liberty NY Water”), which is included in the 2022 consolidated financial statements of the Company and constituted 4% of the Company’s total consolidated assets and 3% of the Company’s total consolidated liabilities,
respectively as of December 31, 2022, and 5% and 4% of the Company’s consolidated revenue and operating income, respectively, for the year then ended. Our audit of internal control over financial reporting of the Company also did not include an
evaluation of the internal control over financial reporting of Liberty NY Water.
We also have audited, in accordance with the standards of the Public
Accounting Oversight Board (United States) (“PCAOB”), the consolidated balance sheets of the Company as of December 31, 2022 and 2021, the related consolidated statements of operations, comprehensive income, equity and cash flows for the years then
ended, and the related notes, and our report dated March 17, 2023 expressed an unqualified opinion thereon.
Basis for Opinion
The Company’s management is responsible for maintaining effective internal
control over financial reporting and for its assessment of the effectiveness of internal control over financial reporting included in the Management Report on Internal Controls over Financial Reporting section contained in the accompanying Management
Discussion and Analysis. Our responsibility is to express an opinion on the Company’s internal control over financial reporting based on our audit. We are a public accounting firm registered with the PCAOB and are required to be independent with
respect to the Company in accordance with the U.S. federal securities laws and the applicable rules and regulations of the Securities and Exchange Commission and the PCAOB.
We conducted our audit in accordance with the standards of the PCAOB. Those
standards require that we plan and perform the audit to obtain reasonable assurance about whether effective internal control over financial reporting was maintained in all material respects.
Our audit included obtaining an understanding of internal control over
financial reporting, assessing the risk that a material weakness exists, testing and evaluating the design and operating effectiveness of internal control based on the assessed risk, and performing such other procedures as we considered necessary in
the circumstances. We believe that our audit provides a reasonable basis for our opinion.
Definition and Limitations of Internal Control Over Financial Reporting
A company’s internal control over financial reporting is a process
designed to provide reasonable assurance regarding the reliability of financial reporting and the preparation of financial statements for external purposes in accordance with generally accepted accounting principles. A company’s internal control over
financial reporting includes those policies and procedures that (1) pertain to the maintenance of records that, in reasonable detail, accurately and fairly reflect the transactions and dispositions of the assets of the company; (2) provide reasonable
assurance that transactions are recorded as necessary to permit preparation of financial statements in accordance with generally accepted accounting principles, and that receipts and expenditures of the company are being made only in accordance with
authorizations of management and directors of the company; and (3) provide reasonable assurance regarding prevention or timely detection of unauthorized acquisition, use, or disposition of the company’s assets that could have a material effect on the
financial statements.
Because of its inherent limitations, internal control over financial reporting
may not prevent or detect misstatements. Also, projections of any evaluation of effectiveness to future periods are subject to the risk that controls may become inadequate because of changes in conditions, or that the degree of compliance with the
policies or procedures may deteriorate.
/s/ Ernst & Young LLP
Chartered Professional Accountants
Licensed Public Accountants
Toronto, Canada
March 17, 2023
Algonquin Power & Utilities Corp.
Consolidated Statements of Operations
| (thousands of U.S. dollars, except per share amounts) |
|
Year ended
December 31 |
|
| |
|
2022 |
|
|
2021 |
|
| Revenue |
|
|
|
|
|
|
| Regulated electricity distribution |
|
$ |
1,277,409 |
|
|
$ |
1,183,399 |
|
| Regulated natural gas distribution |
|
|
686,744 |
|
|
|
525,897 |
|
| Regulated water reclamation and distribution |
|
|
364,383 |
|
|
|
234,875 |
|
| Non-regulated energy sales |
|
|
350,939 |
|
|
|
256,633 |
|
| Other revenue |
|
|
85,680 |
|
|
|
73,338 |
|
| |
|
|
2,765,155 |
|
|
|
2,274,142 |
|
| Expenses |
|
|
|
|
|
|
|
|
| Operating expenses |
|
|
851,489 |
|
|
|
702,128 |
|
| Regulated electricity purchased |
|
|
465,570 |
|
|
|
475,764 |
|
| Regulated natural gas purchased |
|
|
340,792 |
|
|
|
194,174 |
|
| Regulated water purchased |
|
|
18,308 |
|
|
|
12,664 |
|
| Non-regulated energy purchased |
|
|
41,826 |
|
|
|
31,313 |
|
| Administrative expenses |
|
|
80,232 |
|
|
|
66,726 |
|
| Depreciation and amortization |
|
|
455,520 |
|
|
|
402,963 |
|
| Asset impairment charge (note 5) |
|
|
159,568 |
|
|
|
— |
|
| Loss on foreign exchange |
|
|
13,833 |
|
|
|
4,371 |
|
| |
|
|
2,427,138 |
|
|
|
1,890,103 |
|
| Gain on sale of renewable assets (notes 3(a) and 16(c)) |
|
|
64,028 |
|
|
|
29,063 |
|
| Operating income |
|
|
402,045 |
|
|
|
413,102 |
|
| Interest expense |
|
|
(278,574 |
) |
|
|
(209,554 |
) |
| Fair value change, income (loss) and impairment charge on long-term investments (note 8) |
|
|
(465,206 |
) |
|
|
(26,457 |
) |
| Other net losses (note 19) |
|
|
(21,391 |
) |
|
|
(22,949 |
) |
| Pension and other post-employment non-service costs (note 10) |
|
|
(10,950 |
) |
|
|
(16,313 |
) |
| Gain on derivative financial instruments (note 24(b)(iv)) |
|
|
4,408 |
|
|
|
4,403 |
|
| |
|
|
(771,713 |
) |
|
|
(270,870 |
) |
| Income (loss) before income taxes |
|
|
(369,668 |
) |
|
|
142,232 |
|
| Income tax recovery (expense) (note 18) |
|
|
|
|
|
|
|
|
| Current |
|
|
(7,843 |
) |
|
|
(7,237 |
) |
| Deferred |
|
|
69,356 |
|
|
|
50,662 |
|
| |
|
|
61,513 |
|
|
|
43,425 |
|
| Net earnings (loss) |
|
|
(308,155 |
) |
|
|
185,657 |
|
| Net effect of non-controlling interests (note 17) |
|
|
|
|
|
|
|
|
| Non-controlling interests |
|
|
111,323 |
|
|
|
89,637 |
|
| Non-controlling interests held by related party |
|
|
(15,157 |
) |
|
|
(10,435 |
) |
| |
|
$ |
96,166 |
|
|
$ |
79,202 |
|
| Net earnings (loss) attributable to shareholders of Algonquin Power & Utilities Corp. |
|
$ |
(211,989 |
) |
|
$ |
264,859 |
|
| Preferred shares, Series A and preferred shares, Series D dividend (note 15) |
|
|
8,720 |
|
|
|
9,003 |
|
| Net earnings (loss) attributable to common shareholders of Algonquin Power & Utilities Corp. |
|
$ |
(220,709 |
) |
|
$ |
255,856 |
|
| Basic and diluted net earnings (loss) per share (note 20) |
|
$ |
(0.33 |
) |
|
$ |
0.41 |
|
See accompanying notes to consolidated financial statements
| Consolidated Financial Statements |
77 |
Algonquin Power & Utilities Corp.
Consolidated Statements of Comprehensive Income
| |
|
Year ended |
|
| (thousands of U.S. dollars) |
|
December 31 |
|
| |
|
2022 |
|
|
2021 |
|
| Net earnings (loss) |
|
$ |
(308,155 |
) |
|
$ |
185,657 |
|
| Other comprehensive income (loss) (“OCI”): |
|
|
|
|
|
|
|
|
| Foreign currency translation adjustment, net of tax expense of $2,423 and recovery of $3,219,
respectively (notes 24(b)(iii) and 24(b)(iv)) |
|
|
(23,502 |
) |
|
|
(30,270 |
) |
| Change in fair value of cash flow hedges, net of tax expense of $20,644 and recovery of $22,077,
respectively (note 24(b)(ii)) |
|
|
(94,295 |
) |
|
|
(54,331 |
) |
| Change in pension and other post-employment benefits, net of tax expense
of $8,330 and $9,176, respectively (note 10) |
|
|
27,761 |
|
|
|
42,051 |
|
| OCI, net of tax |
|
|
(90,036 |
) |
|
|
(42,550 |
) |
| Comprehensive income (loss) |
|
|
(398,191 |
) |
|
|
143,107 |
|
| Comprehensive loss attributable to the non-controlling interests |
|
|
(97,816 |
) |
|
|
(78,953 |
) |
| Comprehensive income (loss) attributable to shareholders of Algonquin Power & Utilities
Corp. |
|
$ |
(300,375 |
) |
|
$ |
222,060 |
|
See accompanying notes to consolidated financial statements
Algonquin Power & Utilities Corp.
Consolidated Balance Sheets
| (thousands of U.S. dollars) |
|
|
|
|
|
|
| |
|
December 31, |
|
|
December 31, |
|
| |
|
2022 |
|
|
2021 |
|
| ASSETS |
|
|
|
|
|
|
|
|
| |
|
|
|
|
|
|
|
|
| Current assets: |
|
|
|
|
|
|
|
|
| Cash and cash equivalents |
|
$ |
57,623 |
|
|
$ |
125,157 |
|
| Trade and other receivables, net (note 4) |
|
|
528,057 |
|
|
|
403,426 |
|
| Fuel and natural gas in storage |
|
|
95,350 |
|
|
|
74,209 |
|
| Supplies and consumables inventory |
|
|
129,571 |
|
|
|
103,552 |
|
| Regulatory assets (note 7) |
|
|
190,393 |
|
|
|
158,212 |
|
| Prepaid expenses |
|
|
58,653 |
|
|
|
54,548 |
|
| Derivative instruments (note 24) |
|
|
12,270 |
|
|
|
3,486 |
|
| Other assets (note 11) |
|
|
22,564 |
|
|
|
16,153 |
|
| |
|
|
1,094,481 |
|
|
|
938,743 |
|
| Property, plant and equipment, net (note 5) |
|
|
11,944,885 |
|
|
|
11,042,446 |
|
| Intangible assets, net (note 6) |
|
|
96,683 |
|
|
|
105,116 |
|
| Goodwill (note 6) |
|
|
1,320,579 |
|
|
|
1,201,244 |
|
| Regulatory assets (note 7) |
|
|
1,081,108 |
|
|
|
1,009,413 |
|
| Long-term investments (note 8) |
|
|
|
|
|
|
|
|
| Investments carried at fair value |
|
|
1,344,207 |
|
|
|
1,848,456 |
|
| Other long-term investments |
|
|
462,325 |
|
|
|
495,826 |
|
| Derivative instruments (note 24) |
|
|
71,630 |
|
|
|
17,136 |
|
| Deferred income taxes (note 18) |
|
|
84,416 |
|
|
|
31,595 |
|
| Other assets (note 11) |
|
|
127,299 |
|
|
|
107,528 |
|
| |
|
$ |
17,627,613 |
|
|
$ |
16,797,503 |
|
See accompanying notes to consolidated financial statements
| Consolidated Financial Statements |
79 |
Algonquin Power & Utilities Corp.
Consolidated Balance Sheets (continued)
| (thousands of U.S. dollars) |
|
|
|
|
|
|
| |
|
December 31,
2022 |
|
|
December 31,
2021 |
|
| LIABILITIES AND EQUITY |
|
|
|
|
|
|
|
|
| Current liabilities: |
|
|
|
|
|
|
|
|
| Accounts payable |
|
$ |
186,080 |
|
|
$ |
185,291 |
|
| Accrued liabilities |
|
|
555,792 |
|
|
|
428,733 |
|
| Dividends payable (note 15) |
|
|
125,655 |
|
|
|
114,544 |
|
| Regulatory liabilities (note 7) |
|
|
69,865 |
|
|
|
65,809 |
|
| Long-term debt (note 9) |
|
|
423,274 |
|
|
|
356,397 |
|
| Other long-term liabilities (note 12) |
|
|
134,212 |
|
|
|
167,908 |
|
| Derivative instruments (note 24) |
|
|
32,491 |
|
|
|
38,569 |
|
| Other liabilities |
|
|
7,091 |
|
|
|
7,461 |
|
| |
|
|
1,534,460 |
|
|
|
1,364,712 |
|
| Long-term debt (note 9) |
|
|
7,088,743 |
|
|
|
5,854,978 |
|
| Regulatory liabilities (note 7) |
|
|
558,317 |
|
|
|
510,380 |
|
| Deferred income taxes (note 18) |
|
|
565,639 |
|
|
|
530,187 |
|
| Derivative instruments (note 24) |
|
|
137,830 |
|
|
|
81,676 |
|
| Pension and other post-employment benefits obligation (note 10) |
|
|
125,579 |
|
|
|
238,054 |
|
| Other long-term liabilities (note 12) |
|
|
461,230 |
|
|
|
515,911 |
|
| |
|
|
8,937,338 |
|
|
|
7,731,186 |
|
| Redeemable non-controlling interests (note 17) |
|
|
|
|
|
|
|
|
| Redeemable non-controlling interest, held by related party |
|
|
307,856 |
|
|
|
306,537 |
|
| Redeemable non-controlling interests |
|
|
11,520 |
|
|
|
12,989 |
|
| |
|
|
319,376 |
|
|
|
319,526 |
|
| Equity: |
|
|
|
|
|
|
|
|
| Preferred shares |
|
|
184,299 |
|
|
|
184,299 |
|
| Common shares (note 13(a)) |
|
|
6,183,943 |
|
|
|
6,032,792 |
|
| Additional paid-in capital |
|
|
9,413 |
|
|
|
2,007 |
|
| Deficit |
|
|
(997,945 |
) |
|
|
(288,424 |
) |
| Accumulated other comprehensive loss (“AOCI”) (note 14) |
|
|
(160,063 |
) |
|
|
(71,677 |
) |
| Total equity attributable to shareholders of Algonquin Power & Utilities Corp. |
|
|
5,219,647 |
|
|
|
5,858,997 |
|
| Non-controlling interests (note 17) |
|
|
|
|
|
|
|
|
| Non-controlling interests - tax equity partnership units |
|
|
1,225,608 |
|
|
|
1,377,117 |
|
| Other non-controlling interests |
|
|
333,362 |
|
|
|
64,807 |
|
| Non-controlling interest, held by related party |
|
|
57,822 |
|
|
|
81,158 |
|
| |
|
|
1,616,792 |
|
|
|
1,523,082 |
|
| Total equity |
|
|
6,836,439 |
|
|
|
7,382,079 |
|
| Commitments and contingencies (note 22) |
|
|
|
|
|
|
|
|
| Subsequent events (notes 3(b), 7, 9(a), 9(d) and 13(a)) |
|
|
|
|
|
|
|
|
| |
|
$ |
17,627,613 |
|
|
$ |
16,797,503 |
|
| See accompanying notes to consolidated financial statements |
|
|
|
|
| |
ALGONQUIN | LIBERTY |
| 80 |
2022 Annual Report |
Algonquin Power & Utilities Corp.
Consolidated Statement of Equity
(thousands of U.S. dollars)
For the year ended December 31, 2022
| Algonquin
Power & Utilities Corp. Shareholders |
| |
|
Common
shares |
|
|
Preferred
shares |
|
|
Additional
paid-in
capital |
|
|
Retained
earnings
(deficit) |
|
|
AOCI |
|
|
Non-
controlling
interests |
|
|
Total |
|
| Balance, December 31, 2021 |
|
$ |
6,032,792 |
|
|
$ |
184,299 |
|
|
$ |
2,007 |
|
|
$ |
(288,424 |
) |
|
$ |
(71,677 |
) |
|
$ |
1,523,082 |
|
|
$ |
7,382,079 |
|
| |
|
|
|
|
|
|
|
|
|
|
|
|
|
|
|
|
|
|
|
|
|
|
|
|
|
|
|
|
| Net loss |
|
|
— |
|
|
|
— |
|
|
|
— |
|
|
|
(211,989 |
) |
|
|
— |
|
|
|
(96,166 |
) |
|
|
(308,155 |
) |
| |
|
|
|
|
|
|
|
|
|
|
|
|
|
|
|
|
|
|
|
|
|
|
|
|
|
|
|
|
| Effect of redeemable non-controlling interests not included in equity (note 17) |
|
|
— |
|
|
|
— |
|
|
|
— |
|
|
|
— |
|
|
|
— |
|
|
|
(8,859 |
) |
|
|
(8,859 |
) |
| |
|
|
|
|
|
|
|
|
|
|
|
|
|
|
|
|
|
|
|
|
|
|
|
|
|
|
|
|
| OCI |
|
|
— |
|
|
|
— |
|
|
|
— |
|
|
|
— |
|
|
|
(88,386 |
) |
|
|
(1,650 |
) |
|
|
(90,036 |
) |
| |
|
|
|
|
|
|
|
|
|
|
|
|
|
|
|
|
|
|
|
|
|
|
|
|
|
|
|
|
| Dividends declared and distributions to non-controlling interests |
|
|
— |
|
|
|
— |
|
|
|
— |
|
|
|
(396,965 |
) |
|
|
— |
|
|
|
(61,063 |
) |
|
|
(458,028 |
) |
| |
|
|
|
|
|
|
|
|
|
|
|
|
|
|
|
|
|
|
|
|
|
|
|
|
|
|
|
|
| Dividends and issuance of shares under dividend reinvestment plan |
|
|
97,801 |
|
|
|
— |
|
|
|
— |
|
|
|
(97,801 |
) |
|
|
— |
|
|
|
— |
|
|
|
— |
|
| |
|
|
|
|
|
|
|
|
|
|
|
|
|
|
|
|
|
|
|
|
|
|
|
|
|
|
|
|
| Contributions received from non-controlling interests, net of cost |
|
|
— |
|
|
|
— |
|
|
|
— |
|
|
|
— |
|
|
|
— |
|
|
|
273,697 |
|
|
|
273,697 |
|
| |
|
|
|
|
|
|
|
|
|
|
|
|
|
|
|
|
|
|
|
|
|
|
|
|
|
|
|
|
| Common shares issued upon conversion of convertible debentures |
|
|
6 |
|
|
|
— |
|
|
|
— |
|
|
|
— |
|
|
|
— |
|
|
|
— |
|
|
|
6 |
|
| |
|
|
|
|
|
|
|
|
|
|
|
|
|
|
|
|
|
|
|
|
|
|
|
|
|
|
|
|
| Common shares issued upon public offering, net of tax effected cost |
|
|
38,227 |
|
|
|
— |
|
|
|
— |
|
|
|
— |
|
|
|
— |
|
|
|
— |
|
|
|
38,227 |
|
| |
|
|
|
|
|
|
|
|
|
|
|
|
|
|
|
|
|
|
|
|
|
|
|
|
|
|
|
|
| Common shares issued under employee share purchase plan |
|
|
5,319 |
|
|
|
— |
|
|
|
— |
|
|
|
— |
|
|
|
— |
|
|
|
— |
|
|
|
5,319 |
|
| |
|
|
|
|
|
|
|
|
|
|
|
|
|
|
|
|
|
|
|
|
|
|
|
|
|
|
|
|
| Share-based compensation |
|
|
— |
|
|
|
— |
|
|
|
14,849 |
|
|
|
— |
|
|
|
— |
|
|
|
— |
|
|
|
14,849 |
|
| |
|
|
|
|
|
|
|
|
|
|
|
|
|
|
|
|
|
|
|
|
|
|
|
|
|
|
|
|
| Common shares issued pursuant to share-based awards |
|
|
9,798 |
|
|
|
— |
|
|
|
(14,743 |
) |
|
|
(2,766 |
) |
|
|
— |
|
|
|
— |
|
|
|
(7,711 |
) |
|
|
|
|
|
|
|
|
|
|
|
|
|
|
|
|
|
|
|
|
|
|
|
|
|
|
|
|
|
| Repurchase of non-controlling interest (note 17) |
|
|
— |
|
|
|
— |
|
|
|
7,300 |
|
|
|
— |
|
|
|
— |
|
|
|
(12,249 |
) |
|
|
(4,949 |
) |
| Balance, December 31, 2022 |
|
$ |
6,183,943 |
|
|
$ |
184,299 |
|
|
$ |
9,413 |
|
|
$ |
(997,945 |
) |
|
$ |
(160,063 |
) |
|
$ |
1,616,792 |
|
|
$ |
6,836,439 |
|
See accompanying notes to consolidated financial statements
| Consolidated Financial Statements |
81 |
Algonquin Power & Utilities Corp.
Consolidated Statement of Equity (continued)
(thousands of U.S. dollars)
For the year ended December 31, 2021
| Algonquin Power &
Utilities Corp. Shareholders |
| |
|
Common
shares |
|
|
Preferred
shares |
|
|
Additional
paid-in
capital |
|
|
Deficit |
|
|
AOCI |
|
|
Non-
controlling
interests |
|
|
Total |
|
| Balance, December 31, 2020 |
|
$ |
4,935,304 |
|
|
$ |
184,299 |
|
|
$ |
60,729 |
|
|
$ |
45,753 |
|
|
$ |
(22,507 |
) |
|
$ |
458,612 |
|
|
$ |
5,662,190 |
|
| |
|
|
|
|
|
|
|
|
|
|
|
|
|
|
|
|
|
|
|
|
|
|
|
|
|
|
|
|
| Net earnings (loss) |
|
|
— |
|
|
|
— |
|
|
|
— |
|
|
|
264,859 |
|
|
|
— |
|
|
|
(79,202 |
) |
|
|
185,657 |
|
| |
|
|
|
|
|
|
|
|
|
|
|
|
|
|
|
|
|
|
|
|
|
|
|
|
|
|
|
|
| Effect of redeemable non-controlling interests not included in equity (note 17) |
|
|
— |
|
|
|
— |
|
|
|
— |
|
|
|
— |
|
|
|
— |
|
|
|
(4,866 |
) |
|
|
(4,866 |
) |
| |
|
|
|
|
|
|
|
|
|
|
|
|
|
|
|
|
|
|
|
|
|
|
|
|
|
|
|
|
| OCI |
|
|
— |
|
|
|
— |
|
|
|
— |
|
|
|
— |
|
|
|
(42,799 |
) |
|
|
249 |
|
|
|
(42,550 |
) |
| |
|
|
|
|
|
|
|
|
|
|
|
|
|
|
|
|
|
|
|
|
|
|
|
|
|
|
|
|
| Dividends declared and distributions to non-controlling interests |
|
|
— |
|
|
|
— |
|
|
|
— |
|
|
|
(339,531 |
) |
|
|
— |
|
|
|
(30,609 |
) |
|
|
(370,140 |
) |
| |
|
|
|
|
|
|
|
|
|
|
|
|
|
|
|
|
|
|
|
|
|
|
|
|
|
|
|
|
| Dividends and issuance of shares under dividend reinvestment plan |
|
|
92,495 |
|
|
|
— |
|
|
|
— |
|
|
|
(92,495 |
) |
|
|
— |
|
|
|
— |
|
|
|
— |
|
| |
|
|
|
|
|
|
|
|
|
|
|
|
|
|
|
|
|
|
|
|
|
|
|
|
|
|
|
|
| Contributions received from non-controlling interests, net of cost |
|
|
— |
|
|
|
— |
|
|
|
6,919 |
|
|
|
— |
|
|
|
(6,371 |
) |
|
|
1,149,757 |
|
|
|
1,150,305 |
|
| |
|
|
|
|
|
|
|
|
|
|
|
|
|
|
|
|
|
|
|
|
|
|
|
|
|
|
|
|
| Common shares issued upon conversion of convertible debentures |
|
|
16 |
|
|
|
— |
|
|
|
— |
|
|
|
— |
|
|
|
— |
|
|
|
— |
|
|
|
16 |
|
| |
|
|
|
|
|
|
|
|
|
|
|
|
|
|
|
|
|
|
|
|
|
|
|
|
|
|
|
|
| Common shares issued upon public offering, net of tax effected cost |
|
|
988,886 |
|
|
|
— |
|
|
|
— |
|
|
|
— |
|
|
|
— |
|
|
|
— |
|
|
|
988,886 |
|
| |
|
|
|
|
|
|
|
|
|
|
|
|
|
|
|
|
|
|
|
|
|
|
|
|
|
|
|
|
| Contract adjustment payments |
|
|
— |
|
|
|
— |
|
|
|
(62,240 |
) |
|
|
(160,138 |
) |
|
|
— |
|
|
|
— |
|
|
|
(222,378 |
) |
| |
|
|
|
|
|
|
|
|
|
|
|
|
|
|
|
|
|
|
|
|
|
|
|
|
|
|
|
|
| Common shares issued under employee share purchase plan |
|
|
5,108 |
|
|
|
— |
|
|
|
— |
|
|
|
— |
|
|
|
— |
|
|
|
— |
|
|
|
5,108 |
|
| |
|
|
|
|
|
|
|
|
|
|
|
|
|
|
|
|
|
|
|
|
|
|
|
|
|
|
|
|
| Share-based compensation |
|
|
— |
|
|
|
— |
|
|
|
10,036 |
|
|
|
— |
|
|
|
— |
|
|
|
— |
|
|
|
10,036 |
|
| |
|
|
|
|
|
|
|
|
|
|
|
|
|
|
|
|
|
|
|
|
|
|
|
|
|
|
|
|
| Common shares issued pursuant to share-based awards |
|
|
10,983 |
|
|
|
— |
|
|
|
(13,437 |
) |
|
|
(6,872 |
) |
|
|
— |
|
|
|
— |
|
|
|
(9,326 |
) |
| |
|
|
|
|
|
|
|
|
|
|
|
|
|
|
|
|
|
|
|
|
|
|
|
|
|
|
|
|
| Non-controlling interest assumed on asset acquisition (note 3(d)) |
|
|
— |
|
|
|
— |
|
|
|
— |
|
|
|
— |
|
|
|
— |
|
|
|
29,141 |
|
|
|
29,141 |
|
| Balance, December 31, 2021 |
|
$ |
6,032,792 |
|
|
$ |
184,299 |
|
|
$ |
2,007 |
|
|
$ |
(288,424 |
) |
|
$ |
(71,677 |
) |
|
$ |
1,523,082 |
|
|
$ |
7,382,079 |
|
See accompanying notes to consolidated financial statements
| |
ALGONQUIN | LIBERTY
|
| 82 |
2022 Annual Report |
Algonquin Power & Utilities Corp.
Consolidated Statements of Cash Flows
| (thousands of U.S. dollars) |
|
Year ended December 31 |
|
| |
|
2022 |
|
|
2021 |
|
| Cash provided by (used in): |
|
|
|
|
|
|
|
|
| Operating activities |
|
|
|
|
|
|
|
|
| Net earnings (loss) |
|
$ |
(308,155 |
) |
|
$ |
185,657 |
|
| Adjustments and items not affecting cash: |
|
|
|
|
|
|
|
|
| Depreciation and amortization |
|
|
455,520 |
|
|
|
402,963 |
|
| Deferred taxes |
|
|
(69,356 |
) |
|
|
(50,662 |
) |
| Initial value and unrealized loss (gain) on derivative financial instruments |
|
|
2,462 |
|
|
|
(5,609 |
) |
| Share-based compensation |
|
|
10,920 |
|
|
|
8,395 |
|
| Cost of equity funds used for construction purposes |
|
|
(1,896 |
) |
|
|
(637 |
) |
| Change in value of investments carried at fair value |
|
|
499,125 |
|
|
|
122,419 |
|
| Pension and post-employment expense lower than contributions |
|
|
(15,329 |
) |
|
|
(14,146 |
) |
| Distributions received from equity investments, net of income |
|
|
23,829 |
|
|
|
29,818 |
|
| Impairment of assets |
|
|
235,478 |
|
|
|
— |
|
| Other |
|
|
8,116 |
|
|
|
1,290 |
|
| Net change in non-cash operating items (note 23) |
|
|
(221,618 |
) |
|
|
(522,022 |
) |
| |
|
|
619,096 |
|
|
|
157,466 |
|
| Financing activities |
|
|
|
|
|
|
|
|
| Increase in long-term debt |
|
|
16,825,796 |
|
|
|
12,834,047 |
|
| Repayments of long-term debt |
|
|
(15,461,078 |
) |
|
|
(12,895,091 |
) |
| Issuance of common shares, net of costs |
|
|
43,546 |
|
|
|
985,619 |
|
| Cash dividends on common shares |
|
|
(378,597 |
) |
|
|
(307,115 |
) |
| Dividends on preferred shares |
|
|
(8,720 |
) |
|
|
(9,003 |
) |
| Contributions from non-controlling interests and redeemable non-controlling interests |
|
|
272,515 |
|
|
|
1,125,548 |
|
| Production-based cash contributions from non-controlling interest |
|
|
6,182 |
|
|
|
4,832 |
|
| Distributions to non-controlling interests, related party (note 17) |
|
|
(34,816 |
) |
|
|
(28,007 |
) |
| Distributions to non-controlling interests |
|
|
(43,919 |
) |
|
|
(12,830 |
) |
| Payments upon settlement of derivatives |
|
|
(28,913 |
) |
|
|
(33,782 |
) |
| Shares surrendered to fund withholding taxes on exercised share options |
|
|
(4,667 |
) |
|
|
(3,372 |
) |
| Acquisition of non-controlling interest |
|
|
(1,580 |
) |
|
|
— |
|
| Increase in other long-term liabilities |
|
|
19,324 |
|
|
|
62,000 |
|
| Decrease in other long-term liabilities |
|
|
(94,837 |
) |
|
|
(49,130 |
) |
| |
|
|
1,110,236 |
|
|
|
1,673,716 |
|
| Investing activities |
|
|
|
|
|
|
|
|
| Additions to property, plant and equipment and intangible assets |
|
|
(1,089,024 |
) |
|
|
(1,345,045 |
) |
| Increase in long-term investments |
|
|
(221,281 |
) |
|
|
(622,320 |
) |
| Acquisitions of operating entities (note 3(c)) |
|
|
(632,797 |
) |
|
|
— |
|
| Increase in other assets |
|
|
(26,527 |
) |
|
|
(43,306 |
) |
| Receipt of principal on development loans receivable |
|
|
178,300 |
|
|
|
206,319 |
|
| Decrease in long-term investments |
|
|
2,920 |
|
|
|
220 |
|
| Other proceeds |
|
|
— |
|
|
|
6,023 |
|
| |
|
|
(1,788,409 |
) |
|
|
(1,798,109 |
) |
| Effect of exchange rate differences on cash and restricted cash |
|
|
(1,127 |
) |
|
|
(1,702 |
) |
| Increase (decrease) in cash, cash equivalents and restricted cash |
|
|
(60,204 |
) |
|
|
31,371 |
|
| Cash, cash equivalents and restricted cash, beginning of year |
|
|
161,389 |
|
|
|
130,018 |
|
| Cash, cash equivalents and restricted cash, end of year |
|
$ |
101,185 |
|
|
$ |
161,389 |
|
| Consolidated Financial Statements |
83 |
Algonquin Power & Utilities Corp.
Consolidated Statements of Cash Flows (continued)
| (thousands of U.S. dollars) |
|
Year ended December 31 |
|
| |
|
2022 |
|
|
2021 |
|
| Supplemental disclosure of cash flow
information: |
|
|
|
|
|
|
|
|
| Cash paid during the year for interest expense |
|
$ |
272,734 |
|
|
$ |
219,025 |
|
| Cash paid during the year for income taxes |
|
$ |
10,962 |
|
|
$ |
5,019 |
|
| Cash received during the year for distributions from equity investments |
|
$ |
112,951 |
|
|
$ |
112,309 |
|
| |
|
|
|
|
|
|
|
|
| Non-cash financing and investing activities: |
|
|
|
|
|
|
|
|
| Property, plant and equipment acquisitions in accruals |
|
$ |
120,819 |
|
|
$ |
103,427 |
|
| Issuance of common shares under dividend reinvestment plan and share-based compensation plans |
|
$ |
112,918 |
|
|
$ |
108,586 |
|
| Property, plant and equipment, intangible assets and accrued liabilities in exchange of note
receivable |
|
$ |
90,700 |
|
|
$ |
90,821 |
|
| See accompanying notes to consolidated financial statements |
|
|
|
|
|
|
|
|
Algonquin Power & Utilities Corp.
Notes to the Consolidated Financial Statements
December 31, 2022 and 2021
(in thousands of U.S. dollars, except as noted and per share amounts)
Algonquin Power & Utilities Corp. (“AQN” or the “Company”) is an incorporated entity under the Canada Business Corporations Act.
AQN’s operations are organized across two primary business units consisting of the Regulated Services Group and the Renewable Energy Group. The Regulated Services Group owns and operates a portfolio of regulated electric, water distribution and
wastewater collection, and natural gas utility systems and transmission operations in the United States, Canada, Bermuda and Chile; the Renewable Energy Group owns and operates, or has investments in, a diversified portfolio of non-regulated renewable
and thermal energy generation assets.
|
1. |
Significant accounting policies |
The accompanying consolidated financial statements and notes have been prepared in accordance with generally accepted
accounting principles in the United States (“U.S. GAAP”) and follow disclosure required under Regulation S-X provided by the U.S. Securities and Exchange Commission.
|
(b) |
Basis of consolidation |
The accompanying consolidated financial statements of AQN include the accounts of AQN, its wholly owned subsidiaries and
variable interest entities (“VIEs”) where the Company is the primary beneficiary (note 1(m)). Intercompany transactions and balances have been eliminated. Interests in subsidiaries owned by third parties are included in non-controlling interests (note
1(s)).
|
(c) |
Business combinations, intangible assets and goodwill |
The Company accounts for acquisitions of entities or assets that meet the definition of a business as business combinations.
Business combinations are accounted for using the acquisition method. Assets acquired and liabilities assumed are measured at their fair value at the acquisition date, except for deferred income taxes, which are accounted for as described in note 1(v).
Acquisition costs are expensed in the period incurred. When the set of activities does not represent a business, the transaction is accounted for as an asset acquisition and includes acquisition costs.
Intangible assets acquired are recognized separately at fair value if they arise from contractual or other legal rights or are
separable. Power sales contracts are amortized on a straight-line basis over the remaining term of the contract ranging from 6 to 25 years from the date of acquisition. Interconnection agreements are amortized on a straight-line basis over their
estimated life of 40 years. The majority of the Company’s customer relationships are amortized on a straight-line basis over their estimated lives of 25 to 40 years. Certain customer relationships and water rights in Chile as well as brand names are
considered indefinite-lived intangibles and are not amortized, but assessed annually for indicators of impairment. Miscellaneous intangibles include renewable energy credits that are purchased by the Company’s electric utilities to satisfy renewable
portfolio standard obligations. These intangibles are not amortized but are derecognized when remitted to the respective state authority to satisfy the compliance obligation.
Goodwill represents the excess of the purchase price of an acquired business over the fair value of the net assets acquired.
Goodwill is generally not included in the rate base on which regulated utilities are allowed to earn a return and is not amortized.
As at September 30 of each year, the Company assesses qualitative and quantitative factors to determine whether it is more
likely than not that the fair value of a reporting unit to which goodwill is attributed is less than its carrying amount. If it is more likely than not that a reporting unit’s fair value is less than its carrying amount or if a quantitative assessment
is elected, the Company calculates the fair value of the reporting unit. If the carrying amount of the reporting unit as a whole exceeds the reporting unit’s fair value, an impairment charge is recorded in an amount of that excess, limited to the total
amount of goodwill allocated to that reporting unit. Goodwill is tested for impairment between annual tests if an event occurs or circumstances change that would more likely than not reduce the fair value of a reporting unit below its carrying amount.
| Notes to the Consolidated Financial Statements |
85 |
Algonquin Power & Utilities Corp.
Notes to the Consolidated Financial Statements
December 31, 2022 and 2021
(in thousands of U.S. dollars, except as noted and per share amounts)
|
1. |
Significant accounting policies (continued) |
|
(d) |
Accounting for rate regulated operations |
The operating companies within the Regulated Services Group are subject to rate regulation generally overseen by the regulatory
authorities of the jurisdictions in which they operate (the “Regulator”). The Regulator provides the final determination of the rates charged to customers. AQN’s regulated operating companies are accounted for under the principles of U.S. Financial
Accounting Standards Board (“FASB”) ASC Topic 980, Regulated Operations (“ASC 980”) except for AQN’s Chilean operating company, Empresa de Servicios de Los Lagos S.A. (“ESSAL”), which was acquired in October 2020. The rates that are approved
under the Chilean regulatory framework are designed to recover the costs of service of a model water utility. Because the rates are not designed to recover ESSAL’s specific costs of service, the utility does not meet the criteria to follow the
accounting guidance under ASC 980.
Under ASC 980, regulatory assets and liabilities are recorded to the extent that they represent probable future revenue or
expenses associated with certain charges or credits that will be recovered from or refunded to customers through the rate making process. Included in note 7, “Regulatory matters”, are details of regulatory assets and liabilities, and their current
regulatory treatment.
In the event the Company determines that its net regulatory assets are not probable of recovery, it would no longer apply the
principles of the current accounting guidance for rate regulated enterprises and would be required to record an after-tax, non-cash charge or credit against earnings for any remaining regulatory assets or liabilities. The impact could be material to
the Company’s reported financial condition and results of operations.
The U.S. electric, gas and water utilities’ accounts are maintained in accordance with the Uniform System of Accounts
prescribed by the Federal Energy Regulatory Commission (“FERC”), the applicable Regulator(s) and National Association of Regulatory Utility Commissioners in the United States. The New Brunswick Gas accounts are maintained in accordance with the New
Brunswick Gas Distribution Act Uniform Accounting Regulation.
|
(e) |
Cash and cash equivalents |
Cash and cash equivalents include all highly liquid instruments with an original maturity of three months or less.
Restricted cash represents reserves and amounts set aside pursuant to requirements of various debt agreements, deposits to be
returned back to customers, and certain requirements related to generation and transmission operations. Cash reserves segregated from AQN’s cash balances are maintained in accounts administered by a separate agent and disclosed separately as restricted
cash in these consolidated financial statements. AQN cannot access restricted cash without the prior authorization of parties not related to AQN.
Trade accounts receivable are recorded at the invoiced amount and do not bear interest. The Company maintains an allowance for
doubtful accounts for estimated losses inherent in its accounts receivable portfolio. In establishing the required allowance, management considers historical losses adjusted to take into account current market conditions and customers’ financial
condition, the amount of receivables in dispute, future economic conditions and outlook, and the receivables aging and current payment patterns. Account balances are charged against the allowance after all means of collection have been exhausted and
the potential for recovery is considered remote. The Company does not have any off-balance sheet credit exposure related to its customers.
Algonquin Power & Utilities Corp.
Notes to the Consolidated Financial Statements
December 31, 2022 and 2021
(in thousands of U.S. dollars, except as noted and per share amounts)
|
1. |
Significant accounting policies (continued) |
|
(h) |
Fuel and natural gas in storage |
Fuel and natural gas in storage is reflected at weighted average cost or first-in-first-out as required by regulators and
represents fuel, natural gas and liquefied natural gas that will be utilized in the ordinary course of business of the gas utilities and some generating facilities. Existing rate orders and other contracts allow the Company to pass through the cost of
gas purchased directly to the customers along with any applicable authorized delivery surcharge adjustments (note 7(a)). Accordingly, the net realizable value of fuel and gas in storage does not fall below the cost to the Company.
|
(i) |
Supplies and consumables inventory |
Supplies and consumables inventory (other than capital spares and rotatable spares, which are included in property, plant and
equipment) are charged to inventory when purchased and then capitalized to plant or expensed, as appropriate, when installed, used or upon becoming obsolete. These items are stated at the lower of cost and net realizable value. Through rate orders and
the regulatory environment, capitalized construction jobs are recovered through rate base and repair and maintenance expenses are recovered through a cost of service calculation. Accordingly, the cost usually reflects the net realizable value.
|
(j) |
Property, plant and equipment |
Property, plant and equipment are recorded at cost. Capitalization of development projects begins when management with the
relevant authority has authorized and committed to the funding of a project and it is probable that costs will be realized through the use of the asset or ultimate construction and operation of a facility. Project development costs for rate regulated
entities, including expenditures for preliminary surveys, plans, investigations, environmental studies, regulatory applications and other costs incurred for the purpose of determining the feasibility of capital expansion projects, are capitalized
either as regulatory assets or property, plant and equipment when it is determined that recovery of such costs through regulated revenue of the completed project is probable.
The costs of acquiring or constructing property, plant and equipment include the following: materials, labour, contractor and
professional services, construction overhead directly attributable to the capital project (where applicable), interest for non-regulated property and allowance for funds used during construction (“AFUDC”) for regulated property. Where possible,
individual components are recorded and depreciated separately in the books and records of the Company. Plant and equipment under finance leases are initially recorded at cost determined as the present value of lease payments to be made over the lease
term.
AFUDC represents the cost of borrowed funds and a return on other funds. Under ASC 980, an allowance for funds used during
construction projects that are included in rate base is capitalized. This allowance is designed to enable a utility to capitalize financing costs during periods of construction of property subject to rate regulation. For operations that do not apply
regulatory accounting, interest related only to debt is capitalized as a cost of construction in accordance with ASC 835, Interest. The interest capitalized that relates to debt reduces interest expense on the consolidated statements of
operations. The AFUDC capitalized that relates to equity funds is recorded as interest and other income under income from long-term investments on the consolidated statements of operations.
Improvements that increase or prolong the service life or capacity of an asset are capitalized. Costs incurred for major
expenditures or overhauls that occur at regular intervals over the life of an asset are capitalized and depreciated over the related interval. Maintenance and repair costs are expensed as incurred. Grants related to capital expenditures are recorded as
a reduction to the cost of assets and are amortized at the rate of the related asset as a reduction to depreciation expense. Grants related to operating expenses such as maintenance and repairs costs are recorded as a reduction of the related expense.
Contributions in aid of construction represent amounts contributed by customers, governments and developers to assist with the funding of some or all of the cost of utility capital assets. They also include amounts initially recorded as advances in aid
of construction (note 12(c)) once the advance repayment period has expired. These contributions are recorded as a reduction in the cost of utility assets and are amortized at the rate of the related asset as a reduction to depreciation expense.
| Notes to the Consolidated Financial Statements |
87 |
Algonquin Power & Utilities Corp.
Notes to the Consolidated Financial Statements
December 31, 2022 and 2021
(in thousands of U.S. dollars, except as noted and per share amounts)
|
1. |
Significant accounting policies (continued) |
|
(j) |
Property, plant and equipment (continued) |
The Company’s depreciation is based on the estimated useful lives of the depreciable assets in each category and is determined
using the straight-line method with the exception of certain wind assets, as described below. The ranges of estimated useful lives and the weighted average useful lives are summarized below:
| |
|
|
Range of useful lives |
|
|
Weighted average useful lives |
|
| |
|
|
2022 |
|
|
2021 |
|
|
2022 |
|
|
2021 |
|
| Generation |
|
|
|
3-60 |
|
|
|
3-60 |
|
|
|
33 |
|
|
|
33 |
|
| Distribution |
|
|
|
1-100 |
|
|
|
1-100 |
|
|
|
39 |
|
|
|
40 |
|
| Equipment |
|
|
|
5-54 |
|
|
|
5-50 |
|
|
|
11 |
|
|
|
11 |
|
The Company uses the unit-of-production method for certain components of its wind generating facilities where the useful life
of the component is directly related to the amount of production. The benefits of components subject to wear and tear from the power generation process are best reflected through the unit-of-production method. The Company generally uses wind studies
prepared by third parties to estimate the total expected production of each component.
In accordance with regulator-approved accounting policies, when depreciable property, plant and equipment of the Regulated
Services Group are replaced or retired, the original cost plus any removal costs incurred (net of salvage) are charged to accumulated depreciation with no gain or loss reflected in results of operations. Gains and losses will be charged to results of
operations in the future through adjustments to depreciation expense. In the absence of regulator-approved accounting policies, gains and losses on the disposition of property, plant and equipment are charged to earnings as incurred.
|
(k) |
Commonly owned facilities |
The Regulated Services Group owns undivided interests in three electric generating facilities with ownership interest ranging
from 7.52% to 60%, with a corresponding share of capacity and generation from the facility used to serve certain of its utility customers. The Company’s investment in the undivided interest is recorded as plant in service and recovered through rate
base. Commonly owned facilities represent cost of $559,630 (2021 - $557,954) and accumulated depreciation of $75,820 (2021 - $59,857). The Company’s share of operating costs is recognized in operating, maintenance and fuel expenditures excluding
depreciation expense. Total expenditures incurred on these facilities for the year ended December 31, 2022 were $110,268 (2021 - $143,255).
|
(l) |
Impairment of long-lived assets |
AQN reviews property, plant and equipment and finite-life intangible assets for impairment whenever events or changes in
circumstances indicate the carrying amount may not be recoverable.
As at September 30 of each year, the Company assesses qualitative factors to determine whether it is more likely than not that
the indefinite-lived intangible is impaired. If it is more likely than not that the indefinite-lived intangible asset is impaired, the Company calculates the fair value of the intangible asset. If the carrying value of the intangible asset exceeds its
fair value, the Company recognizes an impairment loss in an amount equal to that excess. Indefinite-life intangibles are tested for impairment between annual tests if an event occurs or circumstances change that would more likely than not reduces the
fair value below its carrying amount.
Recoverability of assets expected to be held and used is measured by comparing the carrying amount of an asset to undiscounted
expected future cash flows. If the carrying amount exceeds the recoverable amount, the asset is written down to its fair value. During the fourth quarter of 2022, the Company recorded an impairment charge of $159,568 to reduce the carrying value of the
Senate Wind Facility and other smaller assets from $259,942 to $100,374 (note 5).
Algonquin Power & Utilities Corp.
Notes to the Consolidated Financial Statements
December 31, 2022 and 2021
(in thousands of U.S. dollars, except as noted and per share amounts)
|
1. |
Significant accounting policies (continued) |
|
(m) |
Variable interest entities |
The Company performs analyses to assess whether its operations and investments represent VIEs. To identify potential VIEs,
management reviews contracts under leases, long-term purchase power agreements and jointly owned facilities. VIEs for which the Company is deemed the primary beneficiary are consolidated. In circumstances where AQN is not deemed the primary
beneficiary, the VIE is not consolidated (note 8).
The Company has equity and notes receivable interests in two power generating facilities. AQN has determined that these
entities are considered VIEs mainly based on total equity at risk not being sufficient to permit the legal entity to finance its activities without additional subordinated financial support. The key decisions that affect the generating facilities’
economic performance relate to siting, permitting, technology, construction, operations and maintenance and financing. As AQN has both the power to direct the activities of the entities that most significantly impact its economic performance and the
right to receive benefits or the obligation to absorb losses of the entities that could potentially be significant to the entities, the Company is considered the primary beneficiary.
Total net book value of assets and long-term debt of these facilities amounts to $57,241 (2021 - $59,877) and $15,024 (2021 -
18,344), respectively. The financial performance of these entities reflected on the consolidated statements of operations includes non-regulated energy sales of $19,752 (2021 - 16,772), operating expenses and amortization of $5,834 (2021 - $5,410) and
interest expense of $1,723 (2021 - $2,055).
|
(n) |
Long-term investments and notes receivable |
Investments in which AQN has significant influence but not control are either accounted for using the equity method or at fair
value. Equity-method investments are initially measured at cost including transaction costs and interest when applicable. AQN records its share in the income or loss of its equity-method investees in income from long-term investments in the
consolidated statements of operations. AQN records in the consolidated statements of operations the fluctuations in the fair value of its investees held at fair value and dividend income when it is declared by the investee.
Notes receivable are financial assets with fixed or determined payments that are not quoted in an active market. Notes
receivable are initially recorded at cost, which is generally face value. Subsequent to acquisition, the notes receivable are recorded at amortized cost using the effective interest method. The Company holds these notes receivable as long-term
investments and does not intend to sell these instruments prior to maturity. Interest from long-term investments is recorded as earned and when collectability of both the interest and principal are reasonably assured.
If a loss in value of a long-term investment is considered other than temporary, an allowance for impairment on the investment
is recorded for the amount of that loss. An allowance on notes receivable is recorded in order to present the net amount expected to be collected on the receivable. This allowance reflects the risk of loss over the remaining contractual life of the
asset, taking into consideration historical experience, current conditions, and reasonable and supportable forecasts of future economic conditions. The impairment is measured based on the present value of expected future cash flows discounted at the
note’s effective interest rate. During the fourth quarter of 2022, the Renewable Energy Group recorded an impairment charge of $75,910 to reduce the carrying value of its equity investment in the Texas Coastal Wind Facilities (as defined herein) from
$282,726 to 206,816 (note 8(c)).
| Notes to the Consolidated Financial Statements |
89 |
Algonquin Power & Utilities Corp.
Notes to the Consolidated Financial Statements
December 31, 2022 and 2021
(in thousands of U.S. dollars, except as noted and per share amounts)
|
1. |
Significant accounting policies (continued) |
|
(o) |
Pension and other post-employment plans |
The Company has established defined contribution pension plans, defined benefit pension plans, other post-employment benefit
(“OPEB”) plans, and supplemental retirement program (“SERP”) plans for its various employee groups. Employer contributions to the defined contribution pension plans are expensed as employees render service. The Company recognizes the funded status of
its defined benefit pension plans, OPEB and SERP plans on the consolidated balance sheets. The Company’s expense and liabilities are determined by actuarial valuations, using assumptions that are evaluated annually as of December 31, including discount
rates, mortality, assumed rates of return, compensation increases, turnover rates and healthcare cost trend rates. The impact of modifications to those assumptions and modifications to prior services are recorded as actuarial gains and losses in
accumulated other comprehensive income (“AOCI”) and amortized to net periodic cost over future periods using the corridor method. When settlements of the Company’s pension plans occur, the Company recognizes associated gains or losses immediately in
earnings if the cost of all settlements during the year is greater than the sum of the service cost and interest cost components of the pension plan for the year. The amount recognized is a pro rata portion of the gains and losses in AOCI equal to the
percentage reduction in the projected benefit obligation as a result of the settlement.
The costs of the Company’s pension for employees are expensed over the periods during which employees render service and the
service costs are recognized as part of administrative expenses in the consolidated statements of operations. The components of net periodic benefit cost other than the service cost component are included in other net losses in the consolidated
statements of operations.
|
(p) |
Asset retirement obligations |
The Company recognizes a liability for asset retirement obligations based on the fair value of the liability when incurred,
which is generally upon acquisition, during construction or through the normal operation of the asset. Concurrently, the Company also capitalizes an asset retirement cost, equal to the estimated fair value of the asset retirement obligation, by
increasing the carrying value of the related long-lived asset. The asset retirement costs are depreciated over the asset’s estimated useful life and are included in depreciation and amortization expense on the consolidated statements of operations.
Increases in the asset retirement obligation resulting from the passage of time are recorded as accretion of asset retirement obligation in the consolidated statements of operations. Actual expenditures incurred are charged against the obligation.
The Company accounts for leases in accordance with ASC Topic 842, Leases. The Company leases land, buildings, vehicles,
rail cars, and office equipment for use in its day-to-day operations. The Company has options to extend the lease term of many of its lease agreements, with renewal periods ranging from one to five years. As at the consolidated balance sheet date, the
Company is not reasonably certain that these renewal options will be exercised.
The Renewable Energy Group enters into land easement agreements for the operation of its generation facilities. In assessing
whether these contracts contain leases, the Company considers whether it has exclusive use of the land. In the majority of situations, the landowner or grantor of the easement still has full access to the land and can use the land in any capacity, as
long as it does not interfere with the Company’s operations. Therefore, these land easement agreements do not contain leases. For land easement agreements that provide exclusive access to and use of the land, these agreements meet the definition of a
lease and are within the scope of ASC 842.
The right-of-use assets are included in property, plant and equipment while lease liabilities are included in other liabilities
on the consolidated balance sheets. The discount rates used in the measurement of the Company’s right-of-use assets and liabilities are the discount rates at the date of lease inception. The Company’s lease balances as at December 31, 2022 and its
expected lease payments for the next five years and thereafter are not significant.
Algonquin Power & Utilities Corp.
Notes to the Consolidated Financial Statements
December 31, 2022 and 2021
(in thousands of U.S. dollars, except as noted and per share amounts)
|
1. |
Significant accounting policies (continued) |
|
(r) |
Share-based compensation |
The Company has several share-based compensation plans: a share option plan; an employee share purchase plan (“ESPP”); a
deferred share unit (“DSU”) plan; and a restricted share unit (“RSU”) and performance share unit (“PSU”) plan. Equity-classified awards are measured at the grant date fair value of the award. The Company estimates grant date fair value of options using
the Black-Scholes option pricing model. The fair value is recognized over the vesting period of the award granted, adjusted for estimated forfeitures. The compensation cost is recorded as administrative expenses in the consolidated statements of
operations and additional paid-in capital in equity. Additional paid-in capital is reduced as the awards are exercised, and the amount initially recorded in additional paid-in capital is credited to common shares.
|
(s) |
Non-controlling interests |
Non-controlling interests represent the portion of equity ownership in subsidiaries that is not attributable to the equity
holders of AQN. Non-controlling interests are initially recorded at fair value and subsequently adjusted for the proportionate share of earnings and other comprehensive income (“OCI”) attributable to the non-controlling interests and any dividends or
distributions paid to the non-controlling interests.
If a transaction results in the acquisition of all, or part, of a non-controlling interest in a consolidated subsidiary, the
acquisition of the non-controlling interest is accounted for as an equity transaction. No gain or loss is recognized in net earnings or comprehensive income as a result of changes in the non-controlling interest, unless a change results in the loss of
control by the Company.
Certain of the Company’s U.S. based wind and solar businesses are organized as limited liability corporations (“LLCs”) and
partnerships and have non-controlling membership equity investors (“tax equity partnership units”, or “Tax Equity Investors”), which are entitled to allocations of earnings, tax attributes and cash flows in accordance with contractual agreements. These
LLCs and partnership agreements have liquidation rights and priorities that are different from the underlying percentage ownership interests. In those situations, simply applying the percentage ownership interest to U.S. GAAP net income in order to
determine earnings or losses would not accurately represent the income allocation and cash flow distributions that will ultimately be received by the investors. As such, the share of earnings attributable to the non-controlling interest holders in
these entities is calculated using the Hypothetical Liquidation at Book Value (“HLBV”) method of accounting (note 17).
The HLBV method uses a balance sheet approach. A calculation is prepared at each balance sheet date to determine the amount
that Tax Equity Investors would receive if an equity investment entity were to liquidate all of its assets and distribute that cash to the investors based on the contractually defined liquidation priorities. The difference between the calculated
liquidation distribution amounts at the beginning and the end of the reporting period is the Tax Equity Investors’ share of the earnings or losses from the investment for that period.
Equity instruments subject to redemption upon the occurrence of uncertain events not solely within AQN’s control are classified
as temporary equity and presented as redeemable non-controlling interests on the consolidated balance sheets. The Company records temporary equity at issuance based on cash received less any transaction costs. As needed, the Company reevaluates the
classification of its redeemable instruments, as well as the probability of redemption. If the redemption amount is probable or currently redeemable, the Company records the instruments at their redemption value. Increases or decreases in the carrying
amount of a redeemable instrument are recorded within deficit. When the redemption feature lapses or other events cause the classification of an equity instrument as temporary equity to be no longer required, the existing carrying amount of the equity
instrument is reclassified to permanent equity at the date of the event that caused the reclassification.
|
(t) |
Recognition of revenue |
Revenue is recognized when control of the promised goods or services is transferred to the Company’s customers in an amount
that reflects the consideration the Company expects to be entitled to in exchange for those goods or services.
Refer to note 21, “Segmented information” for details of revenue disaggregation by business units.
| Notes to the Consolidated Financial Statements |
91 |
Algonquin Power & Utilities Corp.
Notes to the Consolidated Financial Statements
December 31, 2022 and 2021
(in thousands of U.S. dollars, except as noted and per share amounts)
|
1. |
Significant accounting policies (continued) |
|
(t) |
Recognition of revenue (continued) |
Regulated Services Group revenue
Regulated Services Group revenue derives primarily from the distribution of electricity, water and natural gas.
Revenue related to utility electricity and natural gas sales and distribution is recognized over time as the energy is
delivered. At the end of each month, the electricity and natural gas delivered to the customers from the date of their last meter read to the end of the month is estimated and the corresponding unbilled revenue is recorded. These estimates of unbilled
revenue and sales are based on the ratio of billable days versus unbilled days, amount of electricity or natural gas procured during that month, historical customer class usage patterns, weather, line loss, unaccounted-for natural gas and current
tariffs. Unbilled receivables are typically billed within the next month. Some customers elect to pay their bill on an equal monthly plan.
As a result, in some months cash is received in advance of the delivery of electricity. Deferred revenue is recorded for that
amount. The amount of revenue recognized in the period from the balance of deferred revenue is not significant.
Water reclamation and distribution revenue is recognized over time when water is processed or delivered to customers. At the
end of each month, the water delivered and wastewater collected from the customers from the date of their last meter read to the end of the month are estimated and the corresponding unbilled revenue is recorded. These estimates of unbilled revenue are
based on the ratio of billable days versus unbilled days, amount of water procured and collected during that month, historical customer class usage patterns and current tariffs. Unbilled receivables are typically billed within the next month.
On occasion, a utility is permitted to implement new rates that have not been formally approved by the regulatory commission,
which are subject to refund. The Company recognizes revenue based on the interim rate and, if needed, establishes a reserve for amounts that could be refunded based on experience for the jurisdiction in which the rates were implemented.
Revenue for certain of the Company’s regulated utilities is subject to alternative revenue programs approved by their
respective regulators. Under these programs, the Company charges approved annual delivery revenue on a systematic basis over the fiscal year. As a result, the difference between delivery revenue calculated based on metered consumption and approved
delivery revenue is disclosed as alternative revenue in note 21, “Segmented information” and is recorded as a regulatory asset or liability to reflect future recovery or refund, respectively, from customers (note 7). The amount subsequently billed to
customers is recorded as a recovery of the regulatory asset.
Renewable Energy Group revenue
Renewable Energy Group’s revenue derives primarily from the sale of electricity, capacity, and renewable energy credits.
Revenue related to the sale of electricity is recognized over time as the electricity is delivered. The electricity represents
a single performance obligation that represents a promise to transfer to the customer a series of distinct goods that are substantially the same and that have the same pattern of transfer to the customer.
Revenue related to the sale of capacity is recognized over time as the capacity is provided. The nature of the promise to
provide capacity is that of a stand-ready obligation. The capacity is generally expressed in monthly volumes and prices. The capacity represents a single performance obligation that represents a promise to transfer to the customer a series of distinct
services that are substantially the same and that have the same pattern of transfer to the customer.
Algonquin Power & Utilities Corp.
Notes to the Consolidated Financial Statements
December 31, 2022 and 2021
(in thousands of U.S. dollars, except as noted and per share amounts)
|
1. |
Significant accounting policies (continued) |
|
(t) |
Recognition of revenue (continued) |
Renewable Energy Group revenue (continued)
Qualifying renewable energy projects receive renewable energy credits (“RECs”) and solar renewable energy credits (“SRECs”) for
the generation and delivery of renewable energy to the power grid. The energy credit certificates represent proof that 1 MW of electricity was generated from an eligible energy source. The RECs and SRECs can be traded and the owner of the RECs or SRECs
can claim to have purchased renewable energy. RECs and SRECs are primarily sold under fixed contracts, and revenue for these contracts is recognized at a point in time, upon generation of the associated electricity. Any RECs or SRECs generated above
contracted amounts are held in inventory, with the offset recorded as a decrease in operating expenses.
The Company applies the invoicing expedient to the electricity and capacity in the Renewable Energy Group contracts. As such,
revenue is recognized at the amount to which the Company has the right to invoice for services performed. Revenue is recorded net of sales taxes.
|
(u) |
Foreign currency translation |
AQN’s reporting currency is the U.S. dollar. Within these consolidated financial statements, the Company denotes any amounts
denominated in Canadian dollars with “C$”, in Chilean pesos with “CLP” and in Chilean Unidad de Fomento with “CLF” immediately prior to the stated amounts.
Effective January 1, 2020, the functional currency of AQN, the non-consolidated parent entity, changed from the Canadian dollar
to the U.S. dollar based on a balance of facts taking into consideration its operating, financing and investing activities. As a result of the entity’s change of functional currency, changes were made to certain hedging relationships to mitigate the
remaining Canadian dollar risk (note 24).
The Company’s Canadian operations have the Canadian dollar as their functional currency since the preponderance of operating,
financing and investing transactions are denominated in Canadian dollars. Similarly, the Company’s Chilean and Bermudian operations’ functional currency is the Chilean peso and the Bermudian dollar, respectively. The financial statements of these
operations are translated into U.S. dollars using the current rate method, whereby assets and liabilities are translated at the rate prevailing at the balance sheet date, and revenue and expenses are translated using average rates for the period.
Unrealized gains or losses arising as a result of the translation of the financial statements of these entities are reported as a component of OCI and are accumulated in a component of equity on the consolidated balance sheets, and are not recorded in
income unless there is a complete or substantially complete sale or liquidation of the investment.
Income taxes are accounted for using the asset and liability method. Deferred tax assets and liabilities are recognized for the
future tax consequences attributable to differences between the financial statement carrying amounts of assets and liabilities and their respective tax bases. Deferred tax assets and liabilities are measured using enacted tax rates expected to apply to
taxable income in the years in which those temporary differences are expected to be recovered or settled. A valuation allowance is recorded against deferred tax assets to the extent that it is considered more likely than not that the deferred tax asset
will not be realized. The effect on deferred tax assets and liabilities of a change in tax rates is recognized in earnings in the period that includes the date of enactment. Investment tax credits for the rate regulated operations are deferred and
amortized as a reduction to income tax expense over the estimated useful lives of the properties. Investment tax credits along with other income tax credits in the non-regulated operations are treated as a reduction to income tax expense in the year
the credit arises.
The organizational structure of AQN and its subsidiaries is complex and the related tax interpretations, regulations and
legislation in the tax jurisdictions in which they operate are continually changing. As a result, there can be tax matters that have uncertain tax positions. The Company recognizes the effect of income tax positions only if those positions are more
likely than not of being sustained. Recognized income tax positions are measured at the largest amount that is greater than 50% likely of being realized. Changes in recognition or measurement are reflected in the period in which the change in judgment
occurs.
| Notes to the Consolidated Financial Statements |
93 |
Algonquin Power & Utilities Corp.
Notes to the Consolidated Financial Statements
December 31, 2022 and 2021
(in thousands of U.S. dollars, except as noted and per share amounts)
|
1. |
Significant accounting policies (continued) |
|
(w) |
Financial instruments and derivatives |
Accounts receivable and notes receivable are measured at amortized cost. Long-term debt and preferred shares, Series C are
measured at amortized cost using the effective interest method, adjusted for the amortization or accretion of premiums or discounts.
Transaction costs that are directly attributable to the acquisition of financial assets are accounted for as part of the
asset’s carrying value at inception. Transaction costs related to a recognized debt liability are presented in the consolidated balance sheets as a direct deduction from the carrying amount of that debt liability, consistent with debt discounts and
premiums. Costs of arranging the Company’s revolving credit facilities and intercompany loans are recorded in other assets. Deferred financing costs, premiums and discounts on long-term debt are amortized using the effective interest method while
deferred financing costs relating to the revolving credit facilities and intercompany loans are amortized on a straight-line basis over the term of the respective instrument.
The Company uses derivative financial instruments as one method to manage exposures to fluctuations in exchange rates, interest
rates and commodity prices. AQN recognizes all derivative instruments as either assets or liabilities on the consolidated balance sheets at their respective fair values. The fair value recognized on derivative instruments executed with the same
counterparty under a master netting arrangement are presented on a gross basis on the consolidated balance sheets. The amounts that could net settle are not significant. The Company applies hedge accounting to some of its financial instruments used to
manage its foreign currency risk, interest rate risk and price risk exposures associated with sales of generated electricity.
For derivatives designated in a cash flow hedge relationship, the change in fair value is recognized in OCI.
The amount recognized in AOCI is reclassified to earnings in the same period as the hedged cash flows affect earnings under the
same line item in the consolidated statements of operations as the hedged item. If the hedging instrument no longer meets the criteria for hedge accounting, expires or is sold, terminated, exercised, or the designation is revoked, then hedge accounting
is discontinued prospectively. The amount remaining in AOCI is transferred to the consolidated statements of operations in the same period that the hedged item affects earnings. If the forecasted transaction is no longer expected to occur, then the
balance in AOCI is recognized immediately in earnings.
Foreign currency gain or loss on derivative or financial instruments designated as a hedge of the foreign currency exposure of
a net investment in foreign operations that are effective as a hedge is reported in the same manner as the translation adjustment (in OCI) related to the net investment.
The Company’s electric distribution and thermal generation facilities enter into power and natural gas purchase contracts for
load serving and generation requirements. These contracts meet the exemption for normal purchase and normal sales and, as such, are not required to be recorded at fair value as derivatives and are accounted for on an accrual basis. Counterparties are
evaluated on an ongoing basis for non-performance risk to ensure it does not impact the conclusion with respect to this exemption.
|
(x) |
Fair value measurements |
The Company utilizes valuation techniques that maximize the use of observable inputs and minimize the use of unobservable
inputs to the extent possible. The Company determines fair value based on assumptions that market participants would use in pricing an asset or liability in the principal or most advantageous market. When considering market participant assumptions in
fair value measurements, the following fair value hierarchy distinguishes between observable and unobservable inputs, which are categorized in one of the following levels:
|
• |
Level 1 Inputs: Unadjusted quoted prices in active markets for identical assets or liabilities accessible to the reporting entity at the measurement date. |
|
• |
Level 2 Inputs: Other than quoted prices included in level 1, inputs that are observable for the asset or liability, either directly or indirectly, for substantially the full term of the asset or liability. |
|
• |
Level 3 Inputs: Unobservable inputs for the asset or liability used to measure fair value to the extent that observable inputs are not available, thereby allowing for situations in which there is little, if any,
market activity for the asset or liability at the measurement date. |
Algonquin Power & Utilities Corp.
Notes to the Consolidated Financial Statements
December 31, 2022 and 2021
(in thousands of U.S. dollars, except as noted and per share amounts)
|
1. |
Significant accounting policies (continued) |
|
(y) |
Commitments and contingencies |
Liabilities for loss contingencies arising from environmental remediation, claims, assessments, litigation, fines, penalties
and other sources are recorded when it is probable that a liability has been incurred and the amount can be reasonably estimated. Legal costs incurred in connection with loss contingencies are expensed as incurred.
The preparation of financial statements requires management to make estimates and assumptions that affect the reported amounts
of assets and liabilities and disclosure of contingent assets and liabilities at the date of these consolidated financial statements and the reported amounts of revenue and expenses during the year. Actual results could differ from those estimates.
During the years presented, management has made a number of estimates and valuation assumptions, including the useful lives and recoverability of property, plant and equipment, intangible assets and goodwill; the recoverability of notes receivable and
long-term investments; the recoverability of deferred tax assets; assessments of unbilled revenue; pension and OPEB obligations; timing effect of regulated assets and liabilities; contingencies related to environmental matters; the fair value of assets
and liabilities acquired in a business combination; and the fair value of financial instruments. These estimates and valuation assumptions are based on present conditions and management’s planned course of action, as well as assumptions about future
business and economic conditions. Should the underlying valuation assumptions and estimates change, the recorded amounts could change by a material amount.
|
2. |
Recently issued accounting pronouncements |
|
(a) |
Recently adopted accounting pronouncements |
The Financial Accounting Standards Board (“FASB”) issued ASU 2021-05, Leases (Topic 842): Lessors — Certain Leases with
Variable Lease Payments to address concerns relating to day-one losses for sales-type or direct financing leases with variable payments that do not depend on a reference index or rate. The update amends the lease classification requirements for lessors
to align them with past practice under Topic 840, Leases. The adoption of this update did not have an impact on the consolidated financial statements.
The FASB issued ASU 2020-06, Debt — Debt with Conversion and Other Options (Subtopic 470-20) and Derivatives and Hedging —
Contracts in Entity’s Own Equity (Subtopic 815-40): Accounting for Convertible Instruments and Contracts in an Entity’s Own Equity to address the complexity associated with accounting for certain financial instruments with characteristics of
liabilities and equity. The number of accounting models for convertible debt instruments and convertible preferred stock is being reduced and the guidance has been amended for the derivatives scope exception for contracts in an entity’s own equity to
reduce form-over-substance-based accounting conclusions. The adoption of this update did not have an impact on the consolidated financial statements.
The FASB issued ASU 2020-04, Reference Rate Reform (Topic 848): Facilitation of the Effects of Reference Rate Reform on
Financial Reporting, which provides optional expedients and exceptions to ease the potential burden in accounting for reference rate reform. The amendments apply to contracts, hedging relationships, and other transactions that reference LIBOR or
another reference rate expected to be discontinued because of the reference rate reform. The FASB issued updates to Topic 848 in ASU 2022-06 and 2021-01 to clarify that the scope of Topic 848 includes derivatives affected by the discounting transition
and extend the relief in Topic 848 to December 31, 2024, respectively. The adoption of this update did not have an impact on the consolidated financial statements.
|
(b) |
Recently issued accounting guidance not yet adopted |
The FASB issued ASU 2022-04, Liabilities — Supplier Finance Programs (Subtopic 405-50): Disclosure of Supplier Finance Program
Obligations, which require that a buyer in a supplier finance program disclose sufficient information about the program to allow a user of financial statements to understand the program’s nature, activity during the period, changes from period to
period, and potential magnitude. The amendments in this update are effective for fiscal years beginning after December 15, 2022, including interim periods within those fiscal years, except for the amendment on roll forward information, which is
effective for fiscal years beginning after December 15, 2023. Early adoption is permitted. The Company is currently assessing the relevant disclosure.
| Notes to the Consolidated Financial Statements |
95 |
Algonquin Power & Utilities Corp.
Notes to the Consolidated Financial Statements
December 31, 2022 and 2021
(in thousands of U.S. dollars, except as noted and per share amounts)
|
3. |
Business acquisitions, development projects and disposition transactions |
|
(a) |
Partial disposition of renewable assets |
On December 29, 2022, the Company closed the sale of ownership interests in a portfolio of operating wind facilities in the
United States and Canada. The transaction consisted of the sale of (1) a 49% ownership interest in three operating wind facilities in the United States totalling 551 MW of installed capacity: the Odell Wind Facility in Minnesota, the Deerfield Wind
Facility in Michigan and the Sugar Creek Wind Facility in Illinois; and (2) an 80% ownership interest in the operating 175 MW Blue Hill Wind Facility in Saskatchewan. The Company retains control over the U.S. facilities. The Company will continue to
oversee day-to-day operations and provide management services to each of the facilities.
The cash proceeds of $277,500 for the U.S. facilities, which continue to be consolidated, were recorded as non-controlling
interest (subject to certain potential future post-closing adjustments). The investment in the Blue Hill Wind Facility continues to be recorded as an equity-method investee. Cash proceeds of C$108,610 were received for the Blue Hill Wind Facility
(subject to certain potential future post-closing adjustments). A gain on disposition of $62,828 was recognized and included in gain on sale of renewable assets on the consolidated statements of operations.
|
(b) |
Pending acquisition of Kentucky Power Company and AEP Kentucky Transmission Company, Inc. |
On October 26, 2021, Liberty Utilities Co., an indirect subsidiary of AQN, entered into an agreement (the “Kentucky Acquisition
Agreement”) with American Electric Power Company, Inc. (“AEP”) and AEP Transmission Company, LLC to acquire Kentucky Power Company (“Kentucky Power”) and AEP Kentucky Transmission Company, Inc. (“Kentucky TransCo”) for a total purchase price of
approximately $2,846,000, including the assumption of approximately $1,221,000 in debt (the “Kentucky Power Transaction”). On September 29, 2022, the parties entered into an amendment to the Kentucky Acquisition Agreement that, among other things,
reduces the purchase price by $200,000.
Kentucky Power is a state rate-regulated electricity generation, distribution and transmission utility in 20 eastern Kentucky
counties and operating under a cost of service framework. Kentucky TransCo is an electricity transmission business operating in the Kentucky portion of the transmission infrastructure that is part of the Pennsylvania – New Jersey – Maryland regional
transmission organization, PJM Interconnection, L.L.C. Kentucky Power and Kentucky TransCo are both regulated by FERC.
Closing of the Kentucky Power Transaction remains subject to the
satisfaction or waiver of certain conditions precedent, which include the approval of the Kentucky Power Transaction by FERC and clearance under the Hart-Scott-Rodino Antitrust Improvements Act of 1976 (as the clearance received previously has
lapsed). On December 15, 2022, FERC issued an order denying, without prejudice, authorization for the proposed transaction. On February 14, 2023, a new application was filed with FERC for approval of the Kentucky Power Transaction. If the Kentucky
Power Transaction has not closed by April 26, 2023, either party may, if certain requirements are met, terminate the Kentucky Acquisition Agreement in accordance with its terms.
|
(c) |
Acquisition of New York American Water Company, Inc. |
Effective January 1, 2022, the Company completed the acquisition of New York American Water Company, Inc (subsequently renamed
Liberty Utilities (New York Water) Corp. (“Liberty NY Water”)). Liberty NY Water is a regulated water and wastewater utility, serving customers in eight counties in southeastern New York.
Algonquin Power & Utilities Corp.
Notes to the Consolidated Financial Statements
December 31, 2022 and 2021
(in thousands of U.S. dollars, except as noted and per share amounts)
|
3. |
Business acquisitions, development projects and disposition transactions (continued) |
|
(c) |
Acquisition of New York American Water Company, Inc. (continued) |
A purchase price of $609,000 was paid for this acquisition. The acquisition related costs were expensed through the
consolidated statement of operations (note 19). The following table summarizes the final allocation of the purchase price to the assets acquired and liabilities assumed when control was obtained.
| Working capital |
|
$ |
4,820 |
|
| Property, plant and equipment (i) |
|
|
499,252 |
|
| Goodwill (ii) |
|
|
116,254 |
|
| Regulatory assets (iii) |
|
|
65,621 |
|
| Other assets |
|
|
4,507 |
|
| Pension and other post-employment benefits |
|
|
(13,402 |
) |
| Regulatory liabilities (iii) |
|
|
(59,727 |
) |
| Other liabilities |
|
|
(8,028 |
) |
| Total net assets acquired |
|
$ |
609,297 |
|
| Cash and cash equivalents acquired |
|
|
49 |
|
| Total net assets acquired, net of cash and cash equivalents |
|
$ |
609,248 |
|
The determination of the fair value of assets acquired and liabilities assumed is based upon management’s estimates and certain
assumptions.
|
i. |
Property, plant and equipment, consist of regulated water distribution infrastructure and wastewater collection and treatment facilities. They are amortized in accordance with regulatory requirements over the
estimated useful life of the assets using the straight-line method. The weighted average useful life of Liberty NY Water’s assets is 64.74 years. |
|
ii. |
Goodwill represents the excess of the purchase price over the aggregate fair value of net assets acquired. The contributing factors to the amount recorded as goodwill include future growth, potential synergies, and
cost of savings in the delivery of certain shared administrative and other services. Goodwill is reported under the Regulated Services Group. |
|
iii. |
The Company is subject to regulation by the New York State Public Service Commission (“NYPSC”), which has jurisdiction with respect to rates, service, accounting procedures, acquisitions, and other matters. Under ASC
980, regulatory assets and liabilities are recorded to the extent that they represent probable future revenue or expenses associated with certain charges or credits that will be recovered from or refunded to customers through the rate making
process (note 7). As part of the approval of the acquisition of Liberty NY Water, a settlement agreement was approved which requires a full year of ownership prior to the filing of a new rate case. As a result, new rates would not come into
effect until 2024. |
Liberty NY Water was consolidated upon acquisition. In 2022, Liberty NY Water generated approximately $125,370 in revenue and $21,776 operating
income.
|
(d) |
Acquisition of Mid-West Wind Facilities |
In 2021, the Empire District Electric Company (“Empire Electric System”), a wholly owned subsidiary of the Company, acquired
three wind farms generating up to 600 MW of wind energy located in Barton, Dade, Lawrence, and Jasper Counties in Missouri, and in Neosho County, Kansas (collectively, the “Mid-West Wind Facilities”). Up to that point, the Company had held an interest
in the construction projects for the North Fork Ridge Wind Facility and the Kings Point Wind Facility. The Empire Electric System paid consideration to third-party developers of $97,760 and obtained control of the facilities. In 2021, subsequent to
acquisition, the tax equity investors provided additional funding of $530,880 and third-party construction loans of $789,923 were repaid. The Company accounted for these transactions as asset acquisitions since substantially all of the fair value of
gross assets acquired is concentrated in a group of similar identifiable assets.
| Notes to the Consolidated Financial Statements |
97 |
Algonquin Power & Utilities Corp.
Notes to the Consolidated Financial Statements
December 31, 2022 and 2021
(in thousands of U.S. dollars, except as noted and per share amounts)
|
3. |
Business acquisitions, development projects and disposition transactions (continued) |
|
(d) |
Acquisition of Mid-West Wind Facilities (continued) |
The following table summarizes the allocation of the aggregate purchase price to the assets acquired and liabilities assumed at
the acquisition dates.
| |
|
Mid-West Wind |
|
| Working capital |
|
$ |
(28,630 |
) |
| Property, plant and equipment |
|
|
1,141,884 |
|
| Long-term debt |
|
|
(789,804 |
) |
| Asset retirement obligation |
|
|
(27,053 |
) |
| Deferred tax liability |
|
|
(4,566 |
) |
| Other liabilities |
|
|
(104,129 |
) |
| Non-controlling interest (tax equity investors) |
|
|
(29,141 |
) |
| Total net assets acquired |
|
|
158,561 |
|
| Cash and cash equivalents |
|
|
15,860 |
|
| Net assets acquired, net of cash and cash equivalents |
|
$ |
142,701 |
|
|
(e) |
Altavista Solar Facility |
Up to April 2021, the Company held a 50% interest in Altavista Solar SponsorCo, LLC, an entity that indirectly owns an 80 MW
solar power facility located in Campbell County, Virginia. In April 2021, the Company acquired the remaining 50% interest in Altavista Solar SponsorCo, LLC for $6,735 and as a result, obtained control of the facility. Subsequent to acquisition, the
third-party construction loan of $122,024 was repaid. The Company accounted for the transaction as an asset acquisition since substantially all of the fair value of gross assets acquired is concentrated in a group of similar identifiable assets.
The following table summarizes the allocation of the purchase price to the assets acquired and liabilities assumed at the
acquisition date of the solar facility.
| |
|
Altavista Solar |
|
| Working capital |
|
$ |
870 |
|
| Property, plant and equipment |
|
|
138,343 |
|
| Long-term debt |
|
|
(122,024 |
) |
| Deferred tax liability |
|
|
(421 |
) |
| Asset retirement obligation |
|
|
(3,332 |
) |
| Total net assets acquired |
|
|
13,436 |
|
| Cash and cash equivalents |
|
|
33 |
|
| Net assets acquired, net of cash and cash equivalents |
|
$ |
13,403 |
|
|
(f) |
Maverick Creek Wind Facility and Sugar Creek Wind Facility |
Up to January 2021, the Company held 50% equity interests in Maverick Creek Wind SponsorCo, LLC and AAGES Sugar Creek Wind, LLC
(note 8). The two entities indirectly own 492 MW and 202 MW wind development projects in the state of Texas and Illinois (“Maverick Creek Wind Facility” and “Sugar Creek Wind Facility”), respectively. In January 2021, the Company acquired the remaining
50% interests in Maverick Creek Wind SponsorCo, LLC and AAGES Sugar Creek Wind, LLC for $43,797 in aggregate and obtained control of the facilities. An amount of $18,641 was withheld from the consideration for the acquisition of AAGES Sugar Creek Wind,
LLC and remains payable upon the satisfaction of certain conditions. The Company accounted for the transactions as asset acquisitions since substantially all of the fair value of gross assets acquired is concentrated in a group of similar identifiable
assets.
Algonquin Power & Utilities Corp.
Notes to the Consolidated Financial Statements
December 31, 2022 and 2021
(in thousands of U.S. dollars, except as noted and per share amounts)
|
3. |
Business acquisitions, development projects and disposition transactions (continued) |
|
(f) |
Maverick Creek Wind Facility and Sugar Creek Wind Facility (continued) |
The following table summarizes the allocation of the purchase price to the assets acquired and liabilities assumed at the
acquisition date of the two wind facilities. The existing loans between the Company and the partnerships of $87,035 were treated as additional consideration incurred to acquire the partnerships.
| |
|
Maverick Creek |
|
| |
|
and Sugar Creek |
|
| Working capital |
|
$ |
(15,557 |
) |
| Property, plant and equipment |
|
|
1,062,613 |
|
| Long-term debt |
|
|
(855,409 |
) |
| Asset retirement obligation |
|
|
(23,402 |
) |
| Deferred tax liability |
|
|
(337 |
) |
| Derivative instruments |
|
|
7,575 |
|
| Total net assets acquired |
|
|
175,483 |
|
| Cash and cash equivalents |
|
|
4,241 |
|
| Net assets acquired, net of cash and cash equivalents |
|
$ |
171,242 |
|
Tax equity investors provided funding of $147,914 and $380,829 to the Sugar Creek Wind Facility and Maverick Creek Wind
Facility, respectively, in 2021 and third-party construction loans of $284,829 and $570,578, respectively, were repaid subsequent to the acquisition of the remaining 50% interests in the facilities in 2021. A partial interest in the Sugar Creek Wind
Facility was subsequently sold in December 2022 (note 3(a)).
Accounts receivable as of December 31, 2022 include unbilled revenue of $149,015 (December 31, 2021 - $102,693) from the
Company’s regulated utilities. Accounts receivable as of December 31, 2022 are presented net of allowance for doubtful accounts of $24,857 (December 31, 2021 - $19,327).
|
5. |
Property, plant and equipment |
Property, plant and equipment consist of the following:
| 2022 |
|
|
|
|
|
|
|
|
|
| |
|
Cost |
|
|
Accumulated
depreciation
|
|
|
Net book value |
|
| Renewable generation facilities |
|
$ |
4,119,514 |
|
|
$ |
1,016,784 |
|
|
$ |
3,102,730 |
|
| Utility plant |
|
|
8,640,224 |
|
|
|
990,975 |
|
|
|
7,649,249 |
|
| Land |
|
|
113,153 |
|
|
|
— |
|
|
|
113,153 |
|
| Equipment |
|
|
111,707 |
|
|
|
50,904 |
|
|
|
60,803 |
|
| Construction in progress |
|
|
|
|
|
|
|
|
|
|
|
|
| Generation |
|
|
196,287 |
|
|
|
— |
|
|
|
196,287 |
|
| Distribution and transmission |
|
|
822,663 |
|
|
|
— |
|
|
|
822,663 |
|
| |
|
$ |
14,003,548 |
|
|
$ |
2,058,663 |
|
|
$ |
11,944,885 |
|
| Notes to the Consolidated Financial Statements |
99 |
Algonquin Power & Utilities Corp.
Notes to the Consolidated Financial Statements
December 31, 2022 and 2021
(in thousands of U.S. dollars, except as noted and per share amounts)
|
5. |
Property, plant and equipment (continued) |
| 2021 |
|
|
|
|
|
|
|
|
|
| |
|
|
|
|
Accumulated |
|
|
|
|
|
|
Cost |
|
|
depreciation |
|
|
Net book value |
|
| Renewable generation facilities |
|
$ |
4,187,197 |
|
|
$ |
751,219 |
|
|
$ |
3,435,978 |
|
| Utility plant |
|
|
7,468,236 |
|
|
|
780,537 |
|
|
|
6,687,699 |
|
| Land |
|
|
114,821 |
|
|
|
— |
|
|
|
114,821 |
|
| Equipment |
|
|
101,971 |
|
|
|
56,464 |
|
|
|
45,507 |
|
| Construction in progress |
|
|
|
|
|
|
|
|
|
|
|
|
| Generation |
|
|
148,302 |
|
|
|
— |
|
|
|
148,302 |
|
| Distribution and transmission |
|
|
610,139 |
|
|
|
— |
|
|
|
610,139 |
|
| |
|
$ |
12,630,666 |
|
|
$ |
1,588,220 |
|
|
$ |
11,042,446 |
|
During the fourth quarter of 2022, the Company
concluded that some assets in the Renewable Energy Group may not be recoverable due to declining forecasted energy prices in the Electric Reliability Council of Texas (“ERCOT”) market, mainly affecting the results of the Senate Wind Facility (which
began commercial operations in 2012). Accordingly, the Company performed fair value analysis based on the income approach and recorded an impairment charge of $159,568 to reduce the carrying value of the Senate Wind Facility and other smaller assets
from $259,942 to $100,374. Changes in assumptions of revenue forecasts, driven by expected production, basis difference and resulting spot prices, projected operating and capital expenditures would affect the estimated fair value.
Renewable generation facilities include cost of
$111,192 (2021 - $114,868) and accumulated depreciation of $46,666 (2021 - $46,649) related to facilities under financing lease or owned by consolidated VIEs. Depreciation expense of facilities under finance leases was $1,489 (2021 - $1,716). Utility
plant includes cost of $3,076 (2021 - $3,076) and accumulated depreciation of $2,041 (2021 - $1,665) related to assets under finance lease.
Utility plant includes cost of $2,033,391 (2021 - $
2,018,039) and accumulated depreciation of $133,644 (2021 - $72,484) related to regulated generation assets.
For the year ended December 31, 2022, contributions
received in aid of construction of $1,299 (2021 - $6,376) have been credited to the cost of the assets.
Interest and AFUDC capitalized to the cost of the
assets in 2022 and 2021 are as follows:
| |
|
2022 |
|
|
2021 |
|
| Interest capitalized on non-regulated property |
|
$ |
4,762 |
|
|
$ |
3,313 |
|
| AFUDC capitalized on regulated property: |
|
|
|
|
|
|
|
|
| Allowance for borrowed funds |
|
|
6,040 |
|
|
|
3,208 |
|
| Allowance for equity funds |
|
|
1,901 |
|
|
|
829 |
|
| |
|
$ |
12,703 |
|
|
$ |
7,350 |
|
| |
ALGONQUIN | LIBERTY |
| 100 |
2022 Annual Report |
Algonquin Power & Utilities Corp.
Notes to the Consolidated Financial Statements
December 31, 2022 and 2021
(in thousands of U.S. dollars, except as noted and per share amounts)
|
6. |
Intangible assets and goodwill |
Intangible assets consist of the following:
| |
|
|
|
|
Accumulated |
|
|
|
|
| 2022 |
|
Cost |
|
|
amortization |
|
|
Net book value |
|
| Power sales contracts |
|
$ |
56,926 |
|
|
$ |
42,818 |
|
|
$ |
14,108 |
|
| Customer relationships |
|
|
77,850 |
|
|
|
13,709 |
|
|
|
64,141 |
|
| Interconnection agreements |
|
|
10,098 |
|
|
|
1,851 |
|
|
|
8,247 |
|
| Other (a) |
|
|
10,338 |
|
|
|
151 |
|
|
|
10,187 |
|
| |
|
$ |
155,212 |
|
|
$ |
58,529 |
|
|
$ |
96,683 |
|
| |
|
|
|
|
|
|
|
|
|
|
|
|
| |
|
|
|
|
|
Accumulated |
|
|
|
|
|
| 2021 |
|
Cost |
|
|
amortization |
|
|
Net book value |
|
| Power sales contracts |
|
$ |
58,112 |
|
|
$ |
43,118 |
|
|
$ |
14,994 |
|
| Customer relationships |
|
|
78,140 |
|
|
|
12,337 |
|
|
|
65,803 |
|
| Interconnection agreements |
|
|
15,072 |
|
|
|
1,721 |
|
|
|
13,351 |
|
| Other (a) |
|
|
10,968 |
|
|
|
— |
|
|
|
10,968 |
|
| |
|
$ |
162,292 |
|
|
$ |
57,176 |
|
|
$ |
105,116 |
|
(a) Other includes brand names, water rights and miscellaneous intangibles
Estimated amortization expense for intangible assets
for each of the next year is $2,580 and $2,572 for years two to five.
All goodwill pertains to the Regulated Services
Group.
| |
|
2022 |
|
|
2021 |
|
| Opening balance |
|
$ |
1,201,244 |
|
|
$ |
1,208,390 |
|
| Business acquisitions (note 3) |
|
|
123,751 |
|
|
|
5,535 |
|
| Foreign exchange |
|
|
(4,416 |
) |
|
|
(12,681 |
) |
| Closing balance |
|
$ |
1,320,579 |
|
|
$ |
1,201,244 |
|
The operating companies within the Regulated
Services Group are subject to regulation by the respective Regulators of the jurisdictions in which they operate. The respective Regulators have jurisdiction with respect to rate, service, accounting policies, issuance of securities, acquisitions and
other matters. Except for ESSAL, these utilities operate under cost-of-service regulation as administered by these authorities. The Company’s regulated utility operating companies are accounted for under the principles of ASC 980, Regulated
Operations. Under ASC 980, regulatory assets and liabilities that would not be recorded under U.S. GAAP for non-regulated entities are recorded to the extent that they represent probable future revenue or expenses associated with certain
charges or credits that will be recovered from or refunded to customers through the rate setting process.
| Notes to the Consolidated Financial Statements |
101 |
Algonquin Power & Utilities Corp.
Notes to the Consolidated Financial Statements
December 31, 2022 and 2021
(in thousands of U.S. dollars, except as noted and per share amounts)
|
7. |
Regulatory matters (continued) |
At any given time, the Company can have several
regulatory proceedings underway. The financial effects of these proceedings are reflected in the consolidated financial statements based on regulatory approval obtained to the extent that there is a financial impact during the applicable reporting
period. The following regulatory proceedings were recently completed:
| Utility |
|
State, Province or Country |
|
Regulatory Proceeding Type |
|
Details |
| |
|
|
|
|
|
|
| BELCO |
|
Bermuda |
|
General rate review |
|
On March 18, 2022, the Regulatory Authority (“RA”) approved an annual increase of $22,800, for a
revenue allowance of $224,056 and $226,160 in revenue for 2022 and 2023, respectively. The RA authorized a rate of return of 7.16%, comprised of a 62% equity and an 8.92% return on equity. The new rates are effective from April 1, 2022. In
April, 2022, BELCO filed an appeal in the Supreme Court of Bermuda challenging the decisions made by the RA through the recent Retail Tariff Review. |
| |
|
|
|
|
|
|
| Empire Electric |
|
Missouri |
|
General Rate Case (GRC) and Securitization |
|
On April 6, 2022, the Missouri Public Service Commission (the “MPSC”) approved an annual base rate
increase of $35,516, as well as another $4,000 in revenues associated with the Empire Wind Facilities. The new rates became effective in June 2022.
On January 19, 2022, Empire Electric filed a petition for securitization of the costs associated with the impact of the Midwest Extreme Weather Event. On March 21, 2022, Empire Electric filed a petition for securitization of the costs
associated with the retirement of the Asbury generating plant. On August 18, 2022, and September 22, 2022, the MPSC issued and amended, respectively, a Report and Order authorizing Empire Electric to securitize approximately $290,383 in
qualified extraordinary costs (Midwest Extreme Weather Event), energy transition costs (Asbury) and upfront financing costs associated with the proposed securitization. The amounts authorized by the securitization order are generally consistent
with the costs deferred by the Company in relation to these matters. Empire Electric filed an appeal of the MPSC order on November 10, 2022 (note 7(a) and (b)). Briefing of the case is expected to be completed in April 2023. |
| |
ALGONQUIN | LIBERTY |
| 102 |
2022 Annual Report |
Algonquin Power & Utilities Corp.
Notes to the Consolidated Financial Statements
December 31, 2022 and 2021
(in thousands of U.S. dollars, except as noted and per share amounts)
|
7. |
Regulatory matters (continued) |
| Utility |
|
State, Province or Country |
|
Regulatory Proceeding Type |
|
Details |
| |
|
|
|
|
|
|
| Empire Electric |
|
Kansas |
|
GRC |
|
On May 27, 2021, Empire Electric submitted an abbreviated rate review seeking to recover costs associated with the addition of the Empire Wind
Facilities, the retirement of Asbury and non-growth related plant investments since the 2019 rate review. In May 2022, the Commission approved the unanimous partial settlement resolving the rate treatment of the Asbury retirement and the
non-wind investments resulting in a base rate decrease of $636, and granted Empire Electric’s motion to withdraw its request to recover cost associated with the Empire Wind Facilities. New rates became effective in July 2022. |
| |
|
|
|
|
|
|
| Empire District Gas Company |
|
Missouri |
|
GRC |
|
In June 2022, the Commission approved an annual increase of $1,000 in base rate revenues. New rates became effective in August 2022. |
| |
|
|
|
|
|
|
| Empire Electric |
|
Oklahoma |
|
GRC |
|
On December 29, 2022 the Commission approved a joint stipulation and agreement filed by the Company and Staff authorizing an annual base rate
revenue increase of $5,100. |
| |
|
|
|
|
|
|
| New Brunswick Gas |
|
Canada |
|
GRC |
|
On November 22, 2021, New Brunswick Gas filed its 2022 general rate application for a revenue decrease based on the Energy & Utilities
Board’s recent decision authorizing a capital structure of 45% equity and an ROE of 8.5%. In January 2022, New Brunswick Natural Gas appealed the Energy & Utilities Board’s cost of capital decision. In May 2022, the Energy & Utilities
Board issued a partial decision approving a decrease in annual revenues of $1,041 to become effective in July 2022. In June 2022, the Court of Appeal found in favour of New Brunswick Gas and remanded the cost of capital case back to the Energy
& Utilities Board. On December 22, 2022 the Board issued a Final Order and approved an annual revenue increase of $1,265 based on an ROE of 9.8%. New rates became effective January 1, 2023. |
| |
|
|
|
|
|
|
| Apple Valley Ranchos Water System |
|
California |
|
GRC |
|
Subsequent to year-end, on February 3, 2023, the Commission issued a Final Order authorizing an annual revenue increase of $1,412. New rates
are retroactive to July 1, 2022. |
| |
|
|
|
|
|
|
| Park Water System |
|
California |
|
GRC |
|
Subsequent to year-end, on February 3, 2023, the Commission issued a Final Order authorizing an annual revenue increase of $1,105. New rates
are retroactive to July 1, 2022. |
| Notes to the Consolidated Financial Statements |
103 |
Algonquin Power & Utilities Corp.
Notes to the Consolidated Financial Statements
December 31, 2022 and 2021
(in thousands of U.S. dollars, except as noted and per share amounts)
|
7. |
Regulatory matters (continued) |
Regulatory assets and liabilities consist of the
following:
| |
|
December 31, |
|
|
December 31, |
|
| |
|
2022 |
|
|
2021 |
|
| Regulatory assets |
|
|
|
|
|
|
|
|
| Fuel and commodity cost adjustments (a) |
|
$ |
388,294 |
|
|
$ |
339,900 |
|
| Retired generating plant (b) |
|
|
174,609 |
|
|
|
185,073 |
|
| Rate adjustment mechanism (c) |
|
|
136,198 |
|
|
|
117,309 |
|
| Income taxes (d) |
|
|
97,414 |
|
|
|
79,472 |
|
| Deferred capitalized costs (e) |
|
|
90,121 |
|
|
|
62,599 |
|
| Pension and post-employment benefits (f) |
|
|
80,736 |
|
|
|
134,287 |
|
| Environmental remediation (g) |
|
|
70,529 |
|
|
|
81,802 |
|
| Wildfire mitigation and vegetation management (h) |
|
|
66,156 |
|
|
|
35,726 |
|
| Clean energy and other customer programs (i) |
|
|
28,145 |
|
|
|
25,857 |
|
| Asset retirement obligation (j) |
|
|
27,172 |
|
|
|
26,810 |
|
| Debt premium (k) |
|
|
24,888 |
|
|
|
34,204 |
|
| Cost of removal (l) |
|
|
11,084 |
|
|
|
— |
|
| Rate review costs (m) |
|
|
9,481 |
|
|
|
9,167 |
|
| Long-term maintenance contract (n) |
|
|
6,504 |
|
|
|
9,134 |
|
| Other (o) |
|
|
60,170 |
|
|
|
26,285 |
|
| Total regulatory assets |
|
$ |
1,271,501 |
|
|
$ |
1,167,625 |
|
| Less: current regulatory assets |
|
|
(190,393 |
) |
|
|
(158,212 |
) |
| Non-current regulatory assets |
|
$ |
1,081,108 |
|
|
$ |
1,009,413 |
|
| |
|
|
|
|
|
|
|
|
| Regulatory liabilities |
|
|
|
|
|
|
|
|
| Income taxes (d) |
|
$ |
312,671 |
|
|
$ |
295,720 |
|
| Cost of removal (l) |
|
|
191,173 |
|
|
|
191,981 |
|
| Pension and post-employment benefits (f) |
|
|
68,085 |
|
|
|
34,468 |
|
| Fuel and commodity cost adjustments (a) |
|
|
24,991 |
|
|
|
18,175 |
|
| Clean energy and other customer programs (i) |
|
|
11,572 |
|
|
|
14,829 |
|
| Rate adjustment mechanism (c) |
|
|
343 |
|
|
|
3,316 |
|
| Other |
|
|
19,347 |
|
|
|
17,700 |
|
| Total regulatory liabilities |
|
$ |
628,182 |
|
|
$ |
576,189 |
|
| Less: current regulatory liabilities |
|
|
(69,865 |
) |
|
|
(65,809 |
) |
| Non-current regulatory liabilities |
|
$ |
558,317 |
|
|
$ |
510,380 |
|
As recovery of regulatory assets is subject to
regulatory approval, if there were any changes in regulatory positions that indicate recovery is not probable, the related cost would be charged to earnings in the period of such determination. The Company generally does not earn a return on the
regulatory balances except for carrying charges on fuel and commodity cost adjustments (a), rate adjustment mechanism (c), clean energy and other customer programs (i), and rate review costs of some jurisdictions (m). Carrying charges on regulatory
balances are recognized on the consolidated statement of operations under Interest and other income (note 8) and are computed using only the debt component of the allowed returned.
| |
ALGONQUIN | LIBERTY |
| 104 |
2022 Annual Report |
Algonquin Power & Utilities Corp.
Notes to the Consolidated Financial Statements
December 31, 2022 and 2021
(in thousands of U.S. dollars, except as noted and per share amounts)
|
7. |
Regulatory matters (continued) |
|
(a) |
Fuel and commodity cost adjustments |
The revenue from the utilities includes a component
that is designed to recover the cost of electricity and natural gas through rates charged to customers. To the extent actual costs of power or fuel purchased differ from power or fuel costs recoverable through current rates, that difference is
deferred and recorded as a regulatory asset or liability on the consolidated balance sheets. These differences are reflected in adjustments to rates and recorded as an adjustment to cost of electricity and fuel in future periods ranging mostly from 6
to 24 months, subject to regulatory review. Derivatives are often utilized to manage the price risk associated with natural gas purchasing activities in accordance with the expectations of state regulators. The gains and losses associated with these
derivatives (note 24(b)(i)) are recoverable through the commodity costs adjustment.
In February 2021, the Company’s operations were
impacted by extreme winter storm conditions experienced in Texas and parts of the central U.S. (“Midwest Extreme Weather Event”). As a result of the Midwest Extreme Weather Event, the Company incurred incremental commodity costs during the period of
record high pricing and elevated consumption. The Company has commodity cost mechanisms that allow for the recovery of prudently incurred expenses.
In early 2022, pursuant to the securitization statute,
Empire Electric sought authorization for the issuance of $221,646 in securitized utility tariff bonds associated with the Midwest Extreme Weather Event and $140,774, in securitized utility tariff bonds for its Asbury costs, which included $21,283 in
asset retirement obligations, which are estimates of costs that Empire Electric will recover from the Asbury retirement but which have not yet been incurred. On April 27, 2022, the MPSC issued an order consolidating, for purposes of hearing, these
two cases regarding the quantum financeable through securitization, which hearing was held the week of June 13, 2022. On August 18, 2022, and September 22, 2022, the MPSC issued and amended, respectively, a Report and Order authorizing Empire
Electric to securitize $290,383 in qualified extraordinary costs (Midwest Extreme Weather Event), energy transition costs (Asbury) and upfront financing costs associated with the proposed securitization. The amounts authorized by the securitization
order are generally consistent with the costs deferred by the Company in relation to these matters. Empire Electric filed a request for rehearing seeking reconsideration of the MPSC’s denial of recovery of five percent of the Midwest Extreme Weather
Event costs, its calculation of accumulated deferred income taxes, and the exclusion of certain carrying charges associated with the Asbury plant, among other issues. On October 12, 2022, the MPSC denied all rehearing motions. Empire Electric
appealed to the Missouri Court of Appeals - Western District on November 10, 2022. Briefing of the case is expected to be completed in April 2023.
|
(b) |
Retired generating plant |
On March 1, 2020, the Company’s 200 MW coal generation
facility located in Asbury, Missouri, ceased operations. The Company transferred the remaining net book value of Asbury’s plant retired from plant in-service to a regulatory asset. The net book value that may be retained as an asset on the balance
sheet for the retired plant is dependent upon amounts that may be recovered through regulated rates, including any return. An impairment charge, if any, would equal the difference between the remaining net book value of the asset and the present
value of the future revenues expected from the asset. The ultimate valuation of the regulatory asset will be determined in future commission orders. The Company is also assessing the decommissioning requirements associated with the retirement of the
facility.
Per commission orders in its jurisdictions, the
Company is required to track the impact of Asbury’s retirement on operating and capital expenses in Missouri for consideration in the next rate case. The Company recorded a regulatory liability for the estimated amount of revenues collected from
customers for Asbury from March 1, 2020 to May 2022 that AQN determined was probable of refund. This regulatory liability did not include revenues collected related to the return on investment in Asbury as AQN determined that they were not probable
of refund to customers based on the relevant facts and circumstances. AQN believes it is probable that the Asbury regulatory liability will be offset for recovery purposes against its unrecovered investment in Asbury and as a result, has netted its
regulatory liability against its retired generation facilities regulatory asset.
As noted above under (a) Fuel and commodity cost
adjustments, in March 2022, Empire Electric filed petitions for securitization of the impact of the Midwest Extreme Weather Event and the retirement of Asbury.
| Notes to the Consolidated Financial Statements |
105 |
Algonquin Power & Utilities Corp.
Notes to the Consolidated Financial Statements
December 31, 2022 and 2021
(in thousands of U.S. dollars, except as noted and per share amounts)
|
7. |
Regulatory matters (continued) |
|
(c) |
Rate adjustment mechanism |
Revenue for CalPeco Electric System, New England Gas
System, Midstates Gas system, EnergyNorth Gas System, Granite State Electric System, Peach State Gas System and BELCO is subject to a revenue decoupling mechanism approved by their respective regulator, which allows revenue decoupling from sales. As
a result, the difference between delivery revenue calculated based on metered consumption and approved delivery revenue is recorded as a regulatory asset or liability to reflect future recovery or refund, respectively, from customers over periods
ranging from one to five years. The revenue from BELCO includes a component that is designed to recover budgeted capital and operating expenses for the current year. To the extent actual capital and operating expenditures are lower than the budgeted
amounts, 80% of the shortfall is refundable to customers and is recorded as a regulatory liability. Retroactive rate adjustments for services rendered but to be collected over a period not exceeding 24 months are accrued upon approval of the final
order. The difference between New Brunswick Gas’ regulated revenues and its regulated cost of service in past years is also recorded as a regulatory asset and is recovered on a straight-line basis over 26 years. The Liberty NY Water System has
similar trackers which are recovered over periods ranging from one to two years.
The income taxes regulatory assets and liabilities
represent income taxes recoverable through future revenues required to fund flow-through deferred income tax liabilities over the life of the plants and amounts owed to customers for deferred taxes collected at a higher rate than the current
statutory rates.
|
(e) |
Deferred capitalized costs |
Deferred capitalized costs reflect deferred
construction costs and fuel-related costs of specific generating facilities of the Empire Electric System. These amounts are being recovered over the life of the plants. The amount also includes capitalized operating and maintenance costs of New
Brunswick Gas, and these amounts are being recovered at a rate of 2.43% annually.
In 2020, the Empire Electric System made an election
under Missouri law to apply the plant-in-service accounting (“PISA”) regulatory mechanism, which permits the Empire Electric System to defer, on a Missouri jurisdictional basis, 85% of the depreciation expense and carrying costs at the applicable
WACC on certain property, plant, and equipment placed in service after the election date and not included in base rates. The portions of regulatory asset balances that are not yet being recovered through rates shall include carrying costs at the
WACC, plus applicable federal, state, and local income or excise taxes. Regulatory asset balances included in rate base shall be recovered in rates through a 20-year amortization beginning on the effective date of new rates. The Company recognizes
the cost of debt on PISA deferrals as reduction of interest expense. The difference between the WACC and cost of debt will be recognized in revenue when recovery of such deferrals is reflected in customer rates.
|
(f) |
Pension and post-employment benefits |
To the extent pension and OPEB costs incurred differ
from the costs recoverable through current rates, that difference is deferred and recorded as a regulatory asset or liability as approved by the applicable Regulators and is recovered through rates over a period of 3 to 8 years. In addition, the
annual movements in AOCI for pension and OPEB for Empire Electric System, Empire Gas Systems, St. Lawrence Gas System and Liberty NY Water System (note 10(a)) are reclassified to regulatory accounts in accordance with ASC 980, Regulated
Operations. The balance is recovered through rates consistent with the treatment of OCI under ASC 712, Compensation Non-retirement Post-employment Benefits and ASC 715, Compensation Retirement Benefits. As part of certain
business acquisitions, the regulators authorized a regulatory asset or liability being set up for the amounts of pension and post-employment benefits that had not yet been recognized in net periodic cost and were presented as AOCI prior to the
acquisition. These balances are recovered through rates over the future service years of the employees (an average of 10 years) or consistent with the treatment of OCI under ASC 712, Compensation Non-retirement Post-employment Benefits and
ASC 715, Compensation Retirement Benefits before the transfer to regulatory asset occurred.
| |
ALGONQUIN | LIBERTY |
| 106 |
2022 Annual Report |
Algonquin Power & Utilities Corp.
Notes to the Consolidated Financial Statements
December 31, 2022 and 2021
(in thousands of U.S. dollars, except as noted and per share amounts)
|
7. |
Regulatory matters (continued) |
|
(g) |
Environmental remediation |
Actual expenditures incurred for the clean-up of
certain former natural gas manufacturing facilities (note 12(d)) are recovered through rates over a period of 7 years and are subject to an annual cap.
|
(h) |
Wildfire mitigation and vegetation management |
The regulatory asset includes incremental wildfire
liability insurance premium costs approved for tracking in the Company’s California operations as well as the difference between actual and adopted spending related to dead trees program, to prevent future forest fires and general vegetation
management. The assets are recovered over two years.
|
(i) |
Clean energy and other customer programs |
The regulatory asset for clean energy and customer
programs includes initiatives related to solar rebate applications processed and resulting rebate-related costs. The amount also includes other energy efficiency programs. The assets are generally included in rate base and recovered over periods of
six to ten years.
|
(j) |
Asset retirement obligation |
Asset retirement obligations are recorded for legally
required removal costs of property, plant and equipment. The costs of retirement of assets as well as the on-going liability accretion and asset depreciation expense are expected to be recovered through rates once expenditures are made.
Debt premium on acquired debt is recovered as a
component of the weighted average cost of debt.
Rates charged to customers cover for costs that are
expected to be incurred in the future to retire the utility plant. A regulatory liability (or asset) tracks the amounts that have been collected from customers net of costs incurred to date.
The cost to file, prosecute and defend rate review
applications is referred to as rate review costs. These costs are capitalized and amortized over the period of rate recovery granted by the Regulator ranging from one to five years
|
(n) |
Long-term maintenance contract |
To the extent actual costs of long-term maintenance
incurred for one of Empire Electric System’s power plants differ from the costs recoverable through current rates, that difference is generally included in rate base and recovered over five years.
The Company’s regulated utilities incur other
miscellaneous costs such as storm costs, property taxes, financing costs, and equipment costs, which are probable of recovery under existing mechanisms.
| Notes to the Consolidated Financial Statements |
107 |
Algonquin Power & Utilities Corp.
Notes to the Consolidated Financial Statements
December 31, 2022 and 2021
(in thousands of U.S. dollars, except as noted and per share amounts)
Long-term investments consist
of the following:
| |
|
December 31, 2022 |
|
|
December 31, 2021 |
|
| Long-term investments carried at fair value |
|
|
|
|
|
|
|
|
| Atlantica (a) |
|
$ |
1,268,140 |
|
|
$ |
1,750,914 |
|
| Atlantica Yield Energy Solutions Canada Inc. (b) |
|
|
74,083 |
|
|
|
95,246 |
|
| Other |
|
|
1,984 |
|
|
|
2,296 |
|
| |
|
$ |
1,344,207 |
|
|
$ |
1,848,456 |
|
| |
|
|
|
|
|
|
|
|
| Other long-term investments |
|
|
|
|
|
|
|
|
| Equity-method investees (c) |
|
$ |
381,802 |
|
|
$ |
433,850 |
|
| Development loans receivable from equity-method investees (d) |
|
|
52,923 |
|
|
|
31,468 |
|
| San Antonio Water System and other (e) |
|
|
27,600 |
|
|
|
30,508 |
|
| |
|
$ |
462,325 |
|
|
$ |
495,826 |
|
Fair value change, income (loss) and impairment expense related to
long-term investments from the years ended December 31 is as follows:
| |
|
Year ended December 31, |
|
| |
|
2022 |
|
|
2021 |
|
| Fair value gain (loss) on investments carried at fair value |
|
|
|
|
|
|
|
|
| Atlantica |
|
$ |
(482,774 |
) |
|
$ |
(107,030 |
) |
| Atlantica Yield Energy Solutions Canada Inc. |
|
|
(16,018 |
) |
|
|
(15,915 |
) |
| Other |
|
|
(333 |
) |
|
|
526 |
|
| |
|
$ |
(499,125 |
) |
|
$ |
(122,419 |
) |
| Dividend and interest income from investments carried at fair value |
|
|
|
|
|
|
|
|
| Atlantica |
|
$ |
86,664 |
|
|
$ |
83,971 |
|
| Atlantica Yield Energy Solutions Canada Inc. |
|
|
20,443 |
|
|
|
17,222 |
|
| Other |
|
|
36 |
|
|
|
330 |
|
| |
|
$ |
107,143 |
|
|
$ |
101,523 |
|
| Other long-term investments |
|
|
|
|
|
|
|
|
| Equity method loss (c) |
|
$ |
(21,416 |
) |
|
$ |
(26,337 |
) |
| Impairment of equity-method investee (c) |
|
|
(75,910 |
) |
|
|
— |
|
| Interest and other income |
|
|
24,102 |
|
|
|
20,776 |
|
| |
|
$ |
(73,224 |
) |
|
$ |
(5,561 |
) |
| Fair value change, income (loss) and impairment expense
related to long-term investments |
|
$ |
(465,206 |
) |
|
$ |
(26,457 |
) |
| |
(a) |
Investment in Atlantica |
Liberty (AY Holdings) B.V. (“AY Holdings”), an entity
controlled and consolidated by AQN, has a share ownership in Atlantica Sustainable Infrastructure PLC (“Atlantica”) of approximately 42% (2021 - 44%). AQN has the flexibility, subject to certain conditions, to increase its ownership of Atlantica up
to 48.5%. The total cost for the Atlantica shares as of December 31, 2022 is $1,167,444 (2021 - $1,167,444).
The Company has elected the fair value option under
ASC 825, Financial Instruments to account for its investment in Atlantica, with changes in fair value reflected in the consolidated statements of operations.
| |
ALGONQUIN | LIBERTY |
| 108 |
2022 Annual Report |
Algonquin Power & Utilities Corp.
Notes to the Consolidated Financial Statements
December 31, 2022 and 2021
(in thousands of U.S. dollars, except as noted and per share amounts)
|
8. |
Long-term investments (continued) |
|
(b) |
Investment in AYES Canada |
AQN and Atlantica own Atlantica Yield Energy Solutions
Canada Inc. (“AYES Canada”), a vehicle to channel co-investment opportunities in which Atlantica holds the majority of voting rights. AYES Canada invested in Windlectric Inc. (“Windlectric”). The investment by AYES Canada in Windlectric is presented
as a non-controlling interest held by a related party (notes 17).
AYES Canada is considered to be a VIE based on the
disproportionate voting and economic interests of the shareholders. Atlantica is considered to be the primary beneficiary of AYES Canada. Accordingly, AQN’s investment in AYES Canada is considered an equity method investment. Under the AYES Canada
shareholders agreement, AQN has the option to exchange approximately 3,500,000 shares of AYES Canada into ordinary shares of Atlantica on a one-for-one basis, subject to certain conditions. Consistent with the treatment of the Atlantica shares, the
Company has elected the fair value option under ASC 825, Financial Instruments to account for its investment in AYES Canada, with changes in fair value reflected in the consolidated statements of operations.
As at December 31, 2022, the Company’s maximum
exposure to loss is $74,083 (2021 - $ 95,246), which represents the fair value of the investment.
|
(c) |
Equity-method investees |
The Renewable Energy Group has non-controlling
interests in operating renewable energy facilities and projects under construction with a total carrying value of $310,103 (2021 - $ 375,460). The Regulated Services Group has non-controlling interest of $56,199 (2021 - 37,492) in a power
transmission line project under construction and other non-regulated operating entities owned by its utilities. The Liberty Development JV Inc. platform for non-regulated renewable energy, water and other sectors has a carrying value of $15,500 and
(2021 - $20,898) is reported under Corporate.
Operating entities: The Company has interests in the
operating entities listed below. The Company is not considered the primary beneficiary as the two partners have joint control and all key decisions must be unanimous. As such, the Company accounts for its interests using the equity method.
| |
|
Economic |
|
|
|
| |
|
interest |
|
Capacity |
|
| Texas Coastal Wind Facilities |
|
51% |
|
|
861 |
MW |
|
| Blue Hill Wind Facility |
|
20% |
|
|
175 |
MW |
|
| Red Lily Wind Facility |
|
75% |
|
|
26.4 |
MW |
|
| Val-Eo Wind Facility |
|
50% |
|
|
24 |
MW |
|
During 2021, the Company acquired a 51% interest in
four wind facilities located in Texas (“Texas Coastal Wind Facilities”) for $344,883. All facilities achieved commercial operations in 2021. As at December 31, 2022, the Company had issued $113,630 (2021 - $119,750) in letters of credit and
guarantees of performance obligations under energy purchase agreements and decommissioning obligations on behalf of the Texas Coastal Wind Facilities. During the fourth quarter of 2022, the Company concluded that primarily as a result of continued
challenges with congestion at the facilities, the carrying value of the interest in the Texas Coastal Wind Facilities was other-than-temporarily impaired. Accordingly, the Company performed a fair value analysis based on the income approach and
recorded an impairment charge of $75,910 to reduce the carrying value of its equity investment in the Texas Coastal Wind Facilities from $282,726 to 206,816. Changes in assumptions of revenue forecasts, driven by expected production, basis difference
and resulting spot prices, projected operating and capital expenditures would affect the estimated fair value.
Development: Pursuant to an agreement between AQN and
funds managed by the Infrastructure and Power strategy of Ares Management, LLC (“Ares”), in November 2021 Ares became AQN’s new partner in its non-regulated development platform for renewable energy, water and other sectors as both parties
contributed cash or assets of $19,688 to Liberty Development JV Inc. The Company is not considered the primary beneficiary as the two partners have joint control and all key decisions must be unanimous. As such, the Company accounts for its interests
using the equity method.
|
Notes to the Consolidated Financial Statements |
109 |
Algonquin Power & Utilities Corp.
Notes to the Consolidated Financial Statements
December 31, 2022 and 2021
(in thousands of U.S. dollars, except as noted and per share amounts)
|
8. |
Long-term investments (continued) |
|
(c) |
Equity-method investees (continued) |
Construction: The Renewable Energy Group has 50%
equity interests in several wind and solar power electric construction projects. AQN and Ares have formed Liberty Construction (US) JV LLC (“Liberty Construction JV”) to jointly construct projects under the Renewable Energy Group. During the year,
the Company contributed several projects to joint entities. The transfers resulted in a gain of $nil (2021 - $26,182). The Company holds an option to acquire the remaining interest in most construction projects at a pre-agreed price. The Company is
not considered the primary beneficiary as the partners have joint control and all key decisions must be unanimous. As such, the Company accounts for its interests using the equity method.
Changes in the carrying value of equity method
investees were as follows:
| |
|
2022 |
|
|
2021 |
|
| Carrying value, January 1 |
|
$ |
433,850 |
|
|
$ |
186,452 |
|
| Additional Investments |
|
|
110,441 |
|
|
|
418,434 |
|
| Net loss attributable to AQN |
|
|
(21,416 |
) |
|
|
(26,337 |
) |
| Other comprehensive income (loss) attributable to AQN (a) |
|
|
(67,110 |
) |
|
|
7,733 |
|
| Operating projects bought back by AQN |
|
|
— |
|
|
|
(129,075 |
) |
| Dividend received |
|
|
(1,183 |
) |
|
|
(2,981 |
) |
| Impairment |
|
|
(75,910 |
) |
|
|
— |
|
| Reclassification during the period (note 8(e)) |
|
|
— |
|
|
|
(25,634 |
) |
| Other |
|
|
3,130 |
|
|
|
5,258 |
|
| Carrying value, December 31 |
|
$ |
381,802 |
|
|
$ |
433,850 |
|
(a) Other comprehensive loss represents the Company’s proportion of the change in fair value, recorded in OCI at the investee level, on energy derivative financial instruments designated as a cash flow hedge,
Summarized combined information for AQN’s equity
method investees as at December 31 is as follows:
| |
|
2022 |
|
|
2021 |
|
| Total assets |
|
$ |
2,740,132 |
|
|
$ |
2,126,934 |
|
| Total liabilities |
|
|
1,507,079 |
|
|
|
945,971 |
|
| Net assets |
|
|
1,233,053 |
|
|
|
1,180,963 |
|
| AQN’s ownership interest in the entities |
|
|
332,663 |
|
|
|
327,555 |
|
| Difference between investment carrying amount and underlying equity in |
|
|
|
|
|
|
|
|
| net assets(a) |
|
|
49,139 |
|
|
|
106,295 |
|
| Total carrying value |
|
$ |
381,802 |
|
|
$ |
433,850 |
|
|
(a) |
The difference between the investment carrying amount and the underlying equity in net assets relates primarily to interest capitalized while the projects are under
construction, the fair value of guarantees provided by the Company in regards to the investments, development fees and transaction costs. |
| |
ALGONQUIN | LIBERTY |
| 110 |
2022 Annual Report |
Algonquin Power & Utilities Corp.
Notes to the Consolidated Financial Statements
December 31, 2022 and 2021
(in thousands of U.S. dollars, except as noted and per share amounts)
|
8. |
Long-term investments (continued) |
|
(c) |
Equity-method investees (continued) |
Summarized combined information for AQN’s equity
method investees for the year ended December 31 (presented at 100%) is as follows:
| |
|
2022 |
|
|
2021 |
|
| Revenue |
|
$ |
65,025 |
|
|
$ |
20,262 |
|
| Net loss |
|
$ |
(31,070 |
) |
|
$ |
(46,293 |
) |
| Other comprehensive income (loss) (a) |
|
$ |
(130,729 |
) |
|
$ |
15,177 |
|
| Net loss attributable to AQN |
|
$ |
(21,416 |
) |
|
$ |
(26,337 |
) |
| Other comprehensive loss attributable to
AQN (a) |
|
$ |
(67,110 |
) |
|
$ |
7,733 |
|
(a) Other comprehensive loss represents the Company’s proportion of the change in fair value, recorded in OCI at the investee level, on energy derivative financial instruments designated as a cash flow hedge,
Except for Liberty Global Energy Solutions B.V.
(formerly Abengoa-Algonquin Global Energy Solutions B.V.) (“Liberty Global Energy Solutions”), Liberty Development JV Inc. and all construction projects are considered VIEs due to the level of equity at risk and the disproportionate voting and
economic interests of the shareholders. The Company has committed loan and credit support facilities with some of its equity investees. During construction, the Company has agreed to provide cash advances and credit support for the continued
development and construction of the equity investees’ projects. As of December 31, 2022, the Company had issued letters of credit and guarantees of performance obligations: under a security of performance for a development opportunity; wind turbine
or solar panel supply agreements; engineering, procurement, and construction agreements; interconnection agreements; energy purchase agreements; renewable energy credit agreements; and construction loan agreements. The fair value of the support
provided recorded as at December 31, 2022 amounts to $8,824 (2021 - $4,612).
Summarized combined information for AQN’s VIEs as at
December 31 is as follows:
| |
|
2022 |
|
|
2021 |
|
| AQN’s maximum exposure in regards to VIEs |
|
|
|
|
|
|
|
|
| Carrying amount |
|
$ |
122,752 |
|
|
$ |
86,202 |
|
| Development loans receivable (d) |
|
|
52,923 |
|
|
|
31,468 |
|
| Performance guarantees and other commitments on behalf of VIEs |
|
|
658,224 |
|
|
|
409,232 |
|
| |
|
$ |
833,899 |
|
|
$ |
526,902 |
|
The commitments are presented on a gross basis
assuming no recoverable value in the assets of the VIEs. The majority of the amounts committed on behalf of VIEs in the above relate to wind turbine or solar panel supply agreements as well as engineering, procurement, and construction agreements.
|
(d) |
Development loans receivable from equity investees |
The Renewable Energy Group has committed loan and
credit support facilities with some of its equity investees. During construction, the Company has agreed to provide cash advances and credit support (in the form of letters of credit, escrowed cash, guarantees or indemnities) in amounts necessary for
the continued development and construction of the equity investees’ projects. The loans generally mature on the twelfth anniversary of the development agreement or commercial operation date.
|
(e) |
San Antonio Water System and other |
The Company no longer has significant influence over
its 20% interest in the San Antonio Water System (“SAWS”), and therefore has discontinued the equity method of accounting in 2021. The investment is accounted for using the cost method prospectively.
|
Notes to the Consolidated Financial Statements |
111 |
Algonquin Power & Utilities Corp.
Notes to the Consolidated Financial Statements
December 31, 2022 and 2021
(in thousands of U.S. dollars, except as noted and per share amounts)
Long-term debt consists of the following:
| |
|
Weighted |
|
|
|
|
|
|
|
|
|
|
|
|
|
| |
|
average |
|
|
|
|
|
|
|
|
December 31, |
|
|
December 31, |
|
| Borrowing type |
|
coupon |
|
|
Maturity |
|
|
Par value |
|
|
2022 |
|
|
2021 |
|
| Senior unsecured revolving credit facilities (a) |
|
|
— |
|
|
|
2024-2027 |
|
|
|
N/A |
|
|
$ |
351,786 |
|
|
$ |
368,806 |
|
| Senior unsecured bank credit facilities and
delayed draw term facility (b) |
|
|
— |
|
|
|
2023-2031 |
|
|
|
N/A |
|
|
|
773,643 |
|
|
|
141,956 |
|
| Commercial paper |
|
|
— |
|
|
|
2023 |
|
|
|
N/A |
|
|
|
407,000 |
|
|
|
338,700 |
|
| U.S. dollar borrowings |
|
|
|
|
|
|
|
|
|
|
|
|
|
|
|
|
|
|
|
|
| Senior unsecured notes (Green Equity Units) (c) |
|
|
1.18 |
% |
|
|
2026 |
|
|
$ |
1,150,000 |
|
|
|
1,142,814 |
|
|
|
1,140,801 |
|
| Senior unsecured notes (d) |
|
|
3.39 |
% |
|
|
2023-2047 |
|
|
$ |
1,505,000 |
|
|
|
1,496,101 |
|
|
|
1,689,792 |
|
| Senior unsecured utility notes |
|
|
6.34 |
% |
|
|
2023-2035 |
|
|
$ |
142,000 |
|
|
|
154,271 |
|
|
|
155,571 |
|
| Senior secured utility bonds |
|
|
4.71 |
% |
|
|
2026-2044 |
|
|
$ |
556,209 |
|
|
|
554,822 |
|
|
|
558,177 |
|
| Canadian dollar borrowings |
|
|
|
|
|
|
|
|
|
|
|
|
|
|
|
|
|
|
|
|
| Senior unsecured notes (e) |
|
|
3.68 |
% |
|
|
2027-2050 |
|
|
C$ |
1,200,000 |
|
|
|
882,899 |
|
|
|
1,099,403 |
|
| Senior secured project notes |
|
|
10.21 |
% |
|
|
2027 |
|
|
C$ |
20,349 |
|
|
|
15,024 |
|
|
|
18,344 |
|
| Chilean Unidad de Fomento borrowings |
|
|
|
|
|
|
|
|
|
|
|
|
|
|
|
|
|
|
|
|
| Senior unsecured utility bonds |
|
|
4.05 |
% |
|
|
2028-2040 |
|
|
CLF |
1,637 |
|
|
|
77,206 |
|
|
|
77,963 |
|
| |
|
|
|
|
|
|
|
|
|
|
|
|
|
$ |
5,855,566 |
|
|
$ |
5,589,513 |
|
| Subordinated U.S. dollar borrowings |
|
|
|
|
|
|
|
|
|
|
|
|
|
|
|
|
|
|
|
|
| Subordinated unsecured notes (f) |
|
|
5.25 |
% |
|
|
2082 |
|
|
C$ |
400,000 |
|
|
|
291,238 |
|
|
|
— |
|
| Subordinated unsecured notes (f) |
|
|
5.56 |
% |
|
|
2078-2082 |
|
|
$ |
1,387,500 |
|
|
|
1,365,213 |
|
|
|
621,862 |
|
| |
|
|
|
|
|
|
|
|
|
|
|
|
|
$ |
7,512,017 |
|
|
$ |
6,211,375 |
|
| Less: current portion |
|
|
|
|
|
|
|
|
|
|
|
|
|
|
(423,274 |
) |
|
|
(356,397 |
) |
| |
|
|
|
|
|
|
|
|
|
|
|
|
|
$ |
7,088,743 |
|
|
$ |
5,854,978 |
|
Short-term obligations of $705,386 that are expected
to be refinanced using the long-term credit facilities are presented as long-term debt.
Long-term debt issued at a subsidiary level (project
notes or utility bonds) relating to a specific operating facility is generally collateralized by the respective facility with no other recourse to the Company. Long-term debt issued at a subsidiary level whether or not collateralized generally has
certain financial covenants, which must be maintained on a quarterly basis. Non-compliance with the covenants could restrict cash distributions/dividends to the Company from the specific facilities.
| |
ALGONQUIN | LIBERTY |
| 112 |
2022 Annual Report |
Algonquin Power & Utilities Corp.
Notes to the Consolidated Financial Statements
December 31, 2022 and 2021
(in thousands of U.S. dollars, except as noted and per share amounts)
|
9. |
Long-term debt (continued) |
The following table sets out the bank credit
facilities available to AQN and its operating groups as at December 31, 2022:
| |
|
December 31, 2022 |
|
|
December 31, 2021 |
|
| Revolving and term credit facilities |
|
$ |
4,513,300 |
|
|
$ |
3,217,000 |
|
| Funds drawn on facilities/ commercial paper issued |
|
|
(1,532,500 |
) |
|
|
(849,600 |
) |
| Letters of credit issued |
|
|
(465,200 |
) |
|
|
(317,200 |
) |
| Liquidity available under the facilities |
|
|
2,515,600 |
|
|
|
2,050,200 |
|
| Undrawn portion of uncommitted letter of credit facilities |
|
|
(226,900 |
) |
|
|
(224,000 |
) |
| Cash on hand |
|
|
57,623 |
|
|
|
125,157 |
|
| Total liquidity and capital reserves |
|
$ |
2,346,323 |
|
|
$ |
1,951,357 |
|
Recent financing activities:
|
(a) |
Senior unsecured revolving credit facilities |
Regulated Services Group
On April 29, 2022, the Regulated Services Group
entered into two new senior unsecured revolving credit facilities: a $1,000,000 senior unsecured revolving credit facility with an initial maturity date of April 29, 2027 (the “Long-Term Regulated Services Credit Facility”) and a $500,000 short-term
senior unsecured revolving credit facility maturing originally on March 31, 2023 and extended to February 28, 2024, subsequent to year-end. Subject to the terms and conditions therein, the Long-Term Regulated Services Credit Facility may be extended
for two additional one-year periods. In conjunction with the new facilities, the Regulated Services Group’s $500,000 senior unsecured syndicated revolving credit facility was cancelled.
On December 23, 2022, the Regulated Services Group
amended and restated its $75,000 senior unsecured revolving credit facility in Bermuda with a new maturity date of December 31, 2024. On June 24, 2022, the Regulated Services Group entered into a new $25,000 senior unsecured bilateral revolving
credit facility in Bermuda that matures on June 24, 2024.
Renewable Energy Group
On July 22, 2022, the Renewable Energy Group amended
and restated its $500,000 senior unsecured syndicated revolving credit facility (the “Renewable Energy Credit Facility”) with a new maturity date of July 22, 2027. Subject to the terms and conditions therein, the Renewable Energy Credit Facility may
be extended for additional one-year periods.
On July 22, 2022, the Renewable Energy Group entered
into a new $250,000 uncommitted bilateral letter of credit facility. On November 8, 2022, the Renewable Energy Group’s $350,000 uncommitted letter of credit facility was amended and restated with a new maturity date of June 30, 2024.
|
(b) |
Senior unsecured bank credit facilities |
On November 30, 2022, the Regulated Services Group
amended and restated its $1,100,000 senior unsecured delayed draw term facility (“the “Regulated Services Delayed Draw Term Facility”) with the new maturity date of November 29, 2023.
|
(c) |
U.S dollar senior unsecured notes (Green Equity Units) |
In June 2021, the Company sold 23,000,000 equity units
(the “Green Equity Units”) for total gross proceeds of $1,150,000. Each Green Equity Unit was issued in a stated amount of $50, at issuance, consisted of a contract to purchase AQN common shares (the “share purchase contract”) and a 5% undivided
beneficial ownership interest in a remarketable senior note of AQN due June 15, 2026, issued in the principal amount of $1,000.
|
Notes to the Consolidated Financial Statements |
113 |
Algonquin Power & Utilities Corp.
Notes to the Consolidated Financial Statements
December 31, 2022 and 2021
(in thousands of U.S. dollars, except as noted and per share amounts)
|
9. |
Long-term debt (continued) |
Recent financing activities (continued):
|
(c) |
U.S dollar senior unsecured notes (Green Equity Units) (continued) |
Total annual distributions on the Green Equity Units
are at a rate of 7.75%, consisting of interest on the notes (1.18% per year) and payments under the share purchase contract (6.57% per year). The interest rate on the notes will be reset following a successful marketing, which would occur in 2024.
The present value of the contract adjustment payments was estimated at $222,378 and is recorded against additional paid-in capital (“APIC”) to the extent of the APIC balance and against retained earnings (deficit) for the remainder. The corresponding
amount of $222,378 was recorded in other liabilities and is accreted over the three-year period (note 12(a)).
Each share purchase contract requires the holder to
purchase by no later than June 15, 2024 for a price of $50 in cash, a number of AQN common shares (“common shares”) based on the applicable market value to be determined using the volume-weighted average price of the common shares over a 20-day
trading period ending June 14, 2024. The minimum settlement rate under the purchase contracts is 2.7778 common shares, which is approximately equal to the $50 stated amount per Green Equity Unit, divided by the threshold appreciation price of $18 per
common share. The maximum settlement rate under the purchase contracts is 3.3333 common shares, which is approximately equal to the $50 stated amount per Green Equity Unit, divided by $15 per common share.
The common share purchase obligation of holders of
Green Equity Units will be satisfied by the proceeds raised from a successful remarketing of the notes, unless a holder has elected to settle with separate cash. Holders’ beneficial ownership interest in each note has been pledged to AQN to secure
the holders’ obligation to purchase common shares under the related share purchase contract.
Prior to the issuance of common shares, the share
purchase contracts, if dilutive, will be reflected in the Company’s diluted earnings per share calculations using the treasury stock method.
|
(d) |
U.S. dollar senior unsecured notes |
On April 30, 2022, the Company repaid a $80,000 senior
unsecured note on its maturity.
On August 1, 2022, the Company repaid a $115,000 senior unsecured note on
its maturity.
Subsequent to year end, the Company repaid a $15,000
senior unsecured note on its maturity.
|
(e) |
Canadian dollar senior unsecured notes |
On February 15, 2022, the Company repaid a C$200,000
senior unsecured note on its maturity. On February 15, 2021, the Renewable Energy Group repaid a C$150,000 unsecured note upon its maturity. Concurrent with the repayments, the Renewable Energy Group unwound and settled the related cross-currency
fixed-for-fixed interest rate swap (note 24(b)(iii)).
On April 9, 2021, the Renewable Energy Group issued
C$400,000 senior unsecured debentures bearing interest at 2.85% with a maturity date of July 15, 2031. The notes were sold at a price of C$999.92 per C$1,000.00 principal amount. Concurrent with the offering, the Renewable Energy Group entered into a
fixed-for-fixed cross-currency interest rate swap to convert the Canadian-dollar-denominated coupon and principal payments from the offering into U.S. dollars (note 24(b)(iii)).
| |
ALGONQUIN | LIBERTY |
| 114 |
2022 Annual Report |
Algonquin Power & Utilities Corp.
Notes to the Consolidated Financial Statements
December 31, 2022 and 2021
(in thousands of U.S. dollars, except as noted and per share amounts)
|
9. |
Long-term debt (continued) |
Recent financing activities (continued):
|
(f) |
Subordinated unsecured notes |
On January 18, 2022, the Company closed (i) an
underwritten public offering in the United States (the “U.S. Offering”) of $750,000 aggregate principal amount of 4.75% fixed-to-fixed reset rate junior subordinated notes series 2022-B due January 18, 2082 (the “U.S. Notes”); and (ii) an
underwritten public offering in Canada (the “Canadian Offering” and, together with the U.S. Offering, the “Offerings”) of C$400,000 (approximately $320,000) aggregate principal amount of 5.25% fixed-to-fixed reset rate junior subordinated notes
series 2022-A due January 18, 2082 (the “Canadian Notes” and, together with the U.S. Notes, the “Notes”). Concurrent with the pricing of the Offerings, the Company entered into a cross currency interest rate swap to convert the Canadian dollar
denominated proceeds from the Canadian Offering into U.S. dollars, and a forward starting swap to fix the interest rate for the second five year term of the U.S. Notes, resulting in an anticipated effective interest rate to the Company of
approximately 4.95% throughout the first ten-year period of the Notes.
As of December 31, 2022, the Company had accrued
$70,274 in interest expense (2021 - $49,806). Interest expense for the years ended December 31 consists of the following:
| |
|
2022 |
|
|
2021 |
|
| Long-term debt |
|
$ |
261,535 |
|
|
$ |
217,123 |
|
| Commercial paper, credit facility draws and related fees |
|
|
43,015 |
|
|
|
17,065 |
|
| Accretion of fair value adjustments |
|
|
(16,547 |
) |
|
|
(18,174 |
) |
| Capitalized interest and AFUDC capitalized on regulated property |
|
|
(10,802 |
) |
|
|
(6,521 |
) |
| Other |
|
|
1,373 |
|
|
|
61 |
|
| |
|
$ |
278,574 |
|
|
$ |
209,554 |
|
Principal payments due in the next five years and
thereafter are as follows:
| 2023 |
|
|
2024 |
|
|
2025 |
|
|
2026 |
|
|
2027 |
|
|
Thereafter |
|
|
Total |
|
| $ |
1,128,660 |
|
|
$ |
359,371 |
|
|
$ |
45,262 |
|
|
$ |
1,265,711 |
|
|
$ |
719,144 |
|
|
$ |
4,019,166 |
|
|
$ |
7,537,314 |
|
|
10. |
Pension and other post-employment benefits |
The Company provides defined contribution pension
plans to substantially all of its employees. The Company’s contributions for 2022 were $12,126 (2021 - $10,836).
The Company provides a defined benefit cash balance
pension plan under which employees are credited with a percentage of base pay plus a prescribed interest rate credit. In conjunction with the utility acquisitions, the Company also assumes defined benefit pension, SERP and OPEB plans for qualifying
employees in the related acquired businesses. The legacy plans are non-contributory defined pension plans covering substantially all employees of the acquired businesses. Benefits are based on each employee’s years of service and compensation. The
Company permanently freezes the accrual of benefits for participants in legacy plans. Thereafter, employees accrue benefits under the Company’s cash balance plan. The OPEB plans provide health care and life insurance coverage to eligible retired
employees. Eligibility is based on age and length of service requirements and, in most cases, retirees must cover a portion of the cost of their coverage.
|
Notes to the Consolidated Financial Statements |
115 |
Algonquin Power & Utilities Corp.
Notes to the Consolidated Financial Statements
December 31, 2022 and 2021
(in thousands of U.S. dollars, except as noted and per share amounts)
| 10. |
Pension and other post-employment benefits (continued) |
|
(a) |
Net pension and OPEB obligation |
The following table sets forth the projected benefit obligations, fair value of plan
assets, and funded status of the Company’s plans as of December 31:
| |
|
Pension benefits |
|
|
OPEB |
|
| |
|
2022 |
|
|
2021 |
|
|
2022 |
|
|
2021 |
|
| Change in projected benefit obligation |
|
|
|
|
|
|
|
|
|
|
|
|
|
|
|
|
| Projected benefit obligation, beginning of year |
|
$ |
765,618 |
|
|
$ |
834,913 |
|
|
$ |
292,646 |
|
|
$ |
306,524 |
|
| Projected benefit obligation assumed from business combination |
|
|
87,933 |
|
|
|
— |
|
|
|
5,195 |
|
|
|
— |
|
| Plan Settlements |
|
|
(112 |
) |
|
|
(1,294 |
) |
|
|
— |
|
|
|
— |
|
| Service cost |
|
|
16,309 |
|
|
|
14,673 |
|
|
|
6,277 |
|
|
|
7,307 |
|
| Interest cost |
|
|
24,787 |
|
|
|
20,676 |
|
|
|
9,146 |
|
|
|
8,048 |
|
| Actuarial gain |
|
|
(198,074 |
) |
|
|
(36,597 |
) |
|
|
(82,991 |
) |
|
|
(18,977 |
) |
| Contributions from retirees |
|
|
— |
|
|
|
— |
|
|
|
2,220 |
|
|
|
2,040 |
|
| Plan amendments |
|
|
— |
|
|
|
237 |
|
|
|
(2,452 |
) |
|
|
310 |
|
| Medicare Part D |
|
|
— |
|
|
|
— |
|
|
|
367 |
|
|
|
373 |
|
| Benefits paid |
|
|
(68,197 |
) |
|
|
(66,800 |
) |
|
|
(13,078 |
) |
|
|
(12,979 |
) |
| Foreign exchange |
|
|
(129 |
) |
|
|
(190 |
) |
|
|
— |
|
|
|
— |
|
| Projected benefit obligation, end of year |
|
$ |
628,135 |
|
|
$ |
765,618 |
|
|
$ |
217,330 |
|
|
$ |
292,646 |
|
| Change in plan assets |
|
|
|
|
|
|
|
|
|
|
|
|
|
|
|
|
| Fair value of plan assets, beginning of year |
|
|
648,864 |
|
|
|
629,157 |
|
|
|
192,375 |
|
|
|
176,616 |
|
| Plan assets acquired in business combination |
|
|
74,532 |
|
|
|
— |
|
|
|
8,577 |
|
|
|
— |
|
| Actual return on plan assets |
|
|
(109,118 |
) |
|
|
58,721 |
|
|
|
(30,105 |
) |
|
|
15,200 |
|
| Employer contributions |
|
|
23,296 |
|
|
|
29,058 |
|
|
|
11,811 |
|
|
|
11,178 |
|
| Plan Settlements |
|
|
(112 |
) |
|
|
(1,294 |
) |
|
|
— |
|
|
|
— |
|
| Contributions from retirees |
|
|
— |
|
|
|
— |
|
|
|
2,220 |
|
|
|
1,988 |
|
| Medicare Part D subsidy receipts |
|
|
— |
|
|
|
— |
|
|
|
367 |
|
|
|
372 |
|
| Benefits paid |
|
|
(68,197 |
) |
|
|
(66,800 |
) |
|
|
(13,078 |
) |
|
|
(12,979 |
) |
| Foreign exchange |
|
|
(10 |
) |
|
|
22 |
|
|
|
— |
|
|
|
— |
|
| Fair value of plan assets, end of year |
|
$ |
569,255 |
|
|
$ |
648,864 |
|
|
$ |
172,167 |
|
|
$ |
192,375 |
|
| Unfunded status |
|
$ |
(58,880 |
) |
|
$ |
(116,754 |
) |
|
$ |
(45,163 |
) |
|
$ |
(100,271 |
) |
| Amounts recognized in the consolidated |
|
|
|
|
|
|
|
|
|
|
|
|
|
|
|
|
| balance sheets consist of: |
|
|
|
|
|
|
|
|
|
|
|
|
|
|
|
|
| Non-current assets (note 11) |
|
|
12,264 |
|
|
|
11,751 |
|
|
|
14,218 |
|
|
|
11,879 |
|
| Current liabilities |
|
|
(1,907 |
) |
|
|
(1,902 |
) |
|
|
(3,039 |
) |
|
|
(699 |
) |
| Non-current liabilities |
|
|
(69,237 |
) |
|
|
(126,603 |
) |
|
|
(56,342 |
) |
|
|
(111,451 |
) |
| Net amount recognized |
|
$ |
(58,880 |
) |
|
$ |
(116,754 |
) |
|
$ |
(45,163 |
) |
|
$ |
(100,271 |
) |
The accumulated benefit obligation for the pension and OPEB plans was $815,589 and $1,080,685 as of
December 31, 2022 and 2021, respectively.
ALGONQUIN | LIBERTY
Algonquin Power & Utilities Corp.
Notes to the Consolidated Financial Statements
December 31, 2022 and 2021
(in thousands of U.S. dollars, except as noted and per share amounts)
|
10. |
Pension and other post-employment benefits (continued) |
|
(a) |
Net pension and OPEB obligation (continued) |
Information for pension and OPEB plans with an accumulated benefit obligation in
excess of plan assets:
| |
|
Pension |
|
|
OPEB |
|
| |
|
2022 |
|
|
2021 |
|
|
2022 |
|
|
2021 |
|
| Accumulated benefit obligation |
|
$ |
413,041 |
|
|
$ |
489,043 |
|
|
$ |
198,463 |
|
|
$ |
274,649 |
|
| Fair value of plan assets |
|
$ |
364,229 |
|
|
$ |
396,679 |
|
|
$ |
139,368 |
|
|
$ |
162,592 |
|
Information for pension and OPEB plans with a projected benefit obligation in excess of plan assets:
| |
|
Pension |
|
|
OPEB |
|
| |
|
2022 |
|
|
2021 |
|
|
2022 |
|
|
2021 |
|
| Projected benefit obligation |
|
$ |
489,140 |
|
|
$ |
580,841 |
|
|
$ |
198,463 |
|
|
$ |
274,649 |
|
| Fair value of plan assets |
|
$ |
417,994 |
|
|
$ |
452,333 |
|
|
$ |
139,368 |
|
|
$ |
162,592 |
|
|
(b) |
Pension and post-employment actuarial changes |
| Change in AOCI, before tax |
|
Pension |
|
|
OPEB |
|
| |
|
Actuarial
losses (gains) |
|
|
Past service
gains |
|
|
Actuarial
losses (gains) |
|
|
Past service
losses (gains) |
|
| Balance, January 1, 2021 |
|
$ |
57,231 |
|
|
$ |
(5,306 |
) |
|
$ |
(4,299 |
) |
|
$ |
— |
|
| Additions to AOCI |
|
|
(59,754 |
) |
|
|
237 |
|
|
|
(24,126 |
) |
|
|
(24 |
) |
| Amortization in current period |
|
|
(13,130 |
) |
|
|
1,626 |
|
|
|
(2,021 |
) |
|
|
334 |
|
| Amortization due to plan settlements |
|
|
(210 |
) |
|
|
— |
|
|
|
— |
|
|
|
— |
|
| Reclassification to regulatory accounts |
|
|
31,670 |
|
|
|
(752 |
) |
|
|
14,816 |
|
|
|
— |
|
| Balance, December 31, 2021 |
|
$ |
15,807 |
|
|
$ |
(4,195 |
) |
|
$ |
(15,630 |
) |
|
$ |
310 |
|
| Additions to AOCI |
|
|
(47,473 |
) |
|
|
— |
|
|
|
(41,527 |
) |
|
|
(24 |
) |
| Amortization in current period |
|
|
(3,429 |
) |
|
|
1,584 |
|
|
|
56 |
|
|
|
(2,476 |
) |
| Amortization due to plan settlements |
|
|
15 |
|
|
|
— |
|
|
|
— |
|
|
|
— |
|
| Reclassification to regulatory accounts |
|
|
34,409 |
|
|
|
(752 |
) |
|
|
23,551 |
|
|
|
— |
|
| Balance, December 31, 2022 |
|
$ |
(671 |
) |
|
$ |
(3,363 |
) |
|
$ |
(33,550 |
) |
|
$ |
(2,190 |
) |
|
|
The movements related to pension and OPEB in AOCI for Empire Electric System, Empire Gas Systems, St. Lawrence Gas System and Liberty NY Water System are reclassified to
regulatory accounts since it is probable the unfunded amount of these plans will be afforded rate recovery (note 7(f)). |
| Notes to the Consolidated Financial Statements |
117 |
Algonquin Power & Utilities Corp.
Notes to the Consolidated Financial Statements
December 31, 2022 and 2021
(in thousands of U.S. dollars, except as noted and per share amounts)
| 10. |
Pension and other post-employment benefits (continued) |
Weighted average assumptions used to determine net benefit obligation for 2022 and
2021 were as follows:
| |
|
Pension benefits |
|
|
OPEB |
|
| |
|
2022 |
|
|
2021 |
|
|
2022 |
|
|
2021 |
|
| Discount rate |
|
|
5.48 |
% |
|
|
2.94 |
% |
|
|
5.49% |
|
|
|
3.00% |
|
| Interest crediting rate (for cash balance plans) |
|
|
4.50 |
% |
|
|
4.00 |
% |
|
|
N/A |
|
|
|
N/A |
|
| Rate of compensation increase |
|
|
3.70 |
% |
|
|
4.00 |
% |
|
|
N/A |
|
|
|
N/A |
|
| Health care cost trend rate |
|
|
|
|
|
|
|
|
|
|
|
|
|
|
|
|
| Before age 65 |
|
|
|
|
|
|
|
|
|
|
6.00% |
|
|
|
5.88% |
|
| Age 65 and after |
|
|
|
|
|
|
|
|
|
|
6.00% |
|
|
|
5.88% |
|
| Assumed ultimate medical inflation rate |
|
|
|
|
|
|
|
|
|
|
4.75% |
|
|
|
4.75% |
|
| Year in which ultimate rate is reached |
|
|
|
|
|
|
|
|
|
|
2033 |
|
|
|
2031 |
|
The mortality assumption for December 31, 2022 uses the Pri-2012 mortality table and
the projected generationally scale MP-2021, adjusted to reflect the ultimate improvement rates in the 2021 Social Security Administration intermediate assumptions for plans in the United States. The mortality assumption for the Bermuda plan as of
December 31, 2022 uses the 2014 Canadian Pensioners’ Mortality Table combined with mortality improvement scale CPM-B.
In selecting an assumed discount rate, the Company uses a modelling process that
involves selecting a portfolio of high-quality corporate debt issuances (AA- or better) whose cash flows (via coupons or maturities) match the timing and amount of the Company’s expected future benefit payments. The Company considers the results of
this modelling process, as well as overall rates of return on high-quality corporate bonds and changes in such rates over time, to determine its assumed discount rate.
The rate of return assumptions are based on projected long-term market returns for
the various asset classes in which the plans are invested, weighted by the target asset allocations.
Weighted average assumptions used to determine net benefit cost for 2022 and 2021 were as follows:
| |
|
Pension benefits |
|
|
OPEB |
|
| |
|
2022 |
|
|
2021 |
|
|
2022 |
|
|
2021 |
|
| Discount rate |
|
|
2.94 |
% |
|
|
2.49 |
% |
|
|
3.00% |
|
|
|
2.58% |
|
| Expected return on assets |
|
|
6.19 |
% |
|
|
6.20 |
% |
|
|
6.48% |
|
|
|
4.79% |
|
| Rate of compensation increase |
|
|
3.91 |
% |
|
|
3.99 |
% |
|
|
n/a |
|
|
|
n/a |
|
| Health care cost trend rate |
|
|
|
|
|
|
|
|
|
|
|
|
|
|
|
|
| Before Age 65 |
|
|
|
|
|
|
|
|
|
|
5.88% |
|
|
|
5.12% |
|
| Age 65 and after |
|
|
|
|
|
|
|
|
|
|
5.88% |
|
|
|
5.12% |
|
| Assumed ultimate medical inflation rate |
|
|
|
|
|
|
|
|
|
|
4.75% |
|
|
|
4.05% |
|
| Year in which ultimate rate is reached |
|
|
|
|
|
|
|
|
|
|
2031 |
|
|
|
2031 |
|
ALGONQUIN | LIBERTY
Algonquin Power & Utilities Corp.
Notes to the Consolidated Financial Statements
December 31, 2022 and 2021
(in thousands of U.S. dollars, except as noted and per share amounts)
|
10. |
Pension and other post-employment benefits (continued) |
The following table lists the components of net benefit cost for the pension and
OPEB plans. Service cost is recorded as part of operating expenses and non-service costs are recorded as part of other net losses in the consolidated statements of operations. The employee benefit costs related to businesses acquired are recorded in
the consolidated statements of operations from the date of acquisition.
| |
|
Pension benefits |
|
|
OPEB |
|
| |
|
2022 |
|
|
2021 |
|
|
2022 |
|
|
2021 |
|
| Service cost |
|
$ |
16,309 |
|
|
$ |
14,673 |
|
|
$ |
6,277 |
|
|
$ |
7,307 |
|
| Non-service costs |
|
|
|
|
|
|
|
|
|
|
|
|
|
|
|
|
| Interest cost |
|
|
24,787 |
|
|
|
20,676 |
|
|
|
9,146 |
|
|
|
8,048 |
|
| Expected return on plan assets |
|
|
(41,226 |
) |
|
|
(35,972 |
) |
|
|
(11,359 |
) |
|
|
(10,052 |
) |
| Amortization of net actuarial loss |
|
|
3,452 |
|
|
|
13,126 |
|
|
|
(56 |
) |
|
|
2,021 |
|
| Amortization of prior service credits |
|
|
(1,584 |
) |
|
|
(1,626 |
) |
|
|
24 |
|
|
|
11 |
|
| Amortization due to plan settlements |
|
|
(15 |
) |
|
|
198 |
|
|
|
— |
|
|
|
— |
|
| Amortization of regulatory accounts |
|
|
22,951 |
|
|
|
19,665 |
|
|
|
4,829 |
|
|
|
218 |
|
| |
|
$ |
8,365 |
|
|
$ |
16,067 |
|
|
$ |
2,584 |
|
|
$ |
246 |
|
| Net benefit cost |
|
$ |
24,674 |
|
|
$ |
30,740 |
|
|
$ |
8,861 |
|
|
$ |
7,553 |
|
The Company’s investment strategy for its pension and post-employment plan assets is
to maintain a diversified portfolio of assets with the primary goal of meeting long-term cash requirements as they become due.
The Company’s target asset allocation is as follows:
| Asset class |
|
Target (%) |
|
|
Range (%) |
|
| Equity securities |
|
|
41 |
% |
|
|
30% -100% |
|
| Debt securities |
|
|
49 |
% |
|
|
20% - 60% |
|
| Other |
|
|
10 |
% |
|
|
0% - 20% |
|
| |
|
|
100 |
% |
|
|
|
|
The fair values of investments as of December 31, 2022, by asset category, are as follows:
| Asset class |
|
2022 |
|
|
Percentage |
|
| Equity securities |
|
$ |
317,088 |
|
|
|
43 |
% |
| Debt securities |
|
|
356,654 |
|
|
|
48 |
% |
| Other |
|
|
67,680 |
|
|
|
9 |
% |
| |
|
$ |
741,422 |
|
|
|
100 |
% |
As of December 31, 2022, the plan assets do not include any material investments in AQN.
| Notes to the Consolidated Financial Statements |
119 |
Algonquin Power & Utilities Corp.
Notes to the Consolidated Financial Statements
December 31, 2022 and 2021
(in thousands of U.S. dollars, except as noted and per share amounts)
|
10. |
Pension and other post-employment benefits (continued) |
|
(e) |
Plan assets (continued) |
All investments as of December 31, 2022 were valued using level 1 inputs except for
21,904 of institutional private equity investments using level 3 fair value measurement. These private equity funds invest in the private equity secondary market and in the credit markets. These funds are not traded in the open market, and are valued
based on the underlying securities within the funds. The underlying securities are valued at fair value by the fund managers by using securities exchange quotations, pricing services, obtaining broker-dealer quotations, reflecting valuations provided
in the most recent financial reports, or at a good faith estimate using fair market value principles.
The following table summarizes the changes fair value of these level 3 assets as of
December 31:
| |
|
Level 3 |
|
| Balance, January 1, 2022 |
|
$ |
17,314 |
|
| Contributions into funds |
|
|
4,781 |
|
| Return on assets |
|
|
2,094 |
|
| Distributions |
|
|
(2,285 |
) |
| Balance, December 31, 2022 |
|
$ |
21,904 |
|
The Company expects to contribute $22,386 to its pension plans and $9,819 to its
post-employment benefit plans in 2023.
The expected benefit payments over the next ten years are as follows:
| |
|
2023 |
|
|
2024 |
|
|
2025 |
|
|
2026 |
|
|
2027 |
|
|
2028-2032 |
|
| Pension plan |
|
$ |
48,174 |
|
|
$ |
47,428 |
|
|
$ |
49,794 |
|
|
$ |
50,585 |
|
|
$ |
50,433 |
|
|
$ |
259,082 |
|
| OPEB |
|
$ |
11,483 |
|
|
$ |
12,025 |
|
|
$ |
12,548 |
|
|
$ |
12,925 |
|
|
$ |
13,479 |
|
|
$ |
72,684 |
|
Other assets consist of the following:
| |
|
2022 |
|
|
2021 |
|
| Restricted cash |
|
$ |
43,562 |
|
|
$ |
36,232 |
|
| Pension and OPEB plan assets (note 10(a)) |
|
|
26,482 |
|
|
|
23,630 |
|
| Long-term deposits and cash collateral |
|
|
22,537 |
|
|
|
14,713 |
|
| Income taxes recoverable |
|
|
7,100 |
|
|
|
7,649 |
|
| Deferred financing costs (a) |
|
|
28,586 |
|
|
|
30,544 |
|
| Other (b) |
|
|
21,596 |
|
|
|
10,913 |
|
| |
|
$ |
149,863 |
|
|
$ |
123,681 |
|
| Less: current portion |
|
|
(22,564 |
) |
|
|
(16,153 |
) |
| |
|
$ |
127,299 |
|
|
$ |
107,528 |
|
|
(a) |
Deferred financing costs |
Deferred financing costs represent costs of arranging the Company’s revolving credit
facilities and intercompany loans as well as the portion of transactions costs related to the Green Equity Units (note 9(c)) that will be recorded against the common shares when issued.
Other includes various deferred charges that are expected to be transferred to
utility plant upon reaching certain milestones as well as prepaid long-term service contracts.
ALGONQUIN | LIBERTY
Algonquin Power & Utilities Corp.
Notes to the Consolidated Financial Statements
December 31, 2022 and 2021
(in thousands of U.S. dollars, except as noted and per share amounts)
|
12. |
Other long-term liabilities |
Other long-term liabilities consist of the following:
| |
|
2022 |
|
|
2021 |
|
| Contract adjustment payments (a) |
|
$ |
113,876 |
|
|
$ |
187,580 |
|
| Asset retirement obligations (b) |
|
|
116,584 |
|
|
|
142,147 |
|
| Advances in aid of construction (c) |
|
|
88,546 |
|
|
|
82,584 |
|
| Environmental remediation obligation (d) |
|
|
42,457 |
|
|
|
55,224 |
|
| Customer deposits (e) |
|
|
34,675 |
|
|
|
32,629 |
|
| Unamortized investment tax credits (f) |
|
|
17,649 |
|
|
|
17,439 |
|
| Deferred credits and contingent consideration (g) |
|
|
39,498 |
|
|
|
43,495 |
|
| Preferred shares, Series C (h) |
|
|
12,072 |
|
|
|
13,348 |
|
| Hook up fees (i) |
|
|
32,463 |
|
|
|
21,904 |
|
| Lease liabilities (note 1(q)) |
|
|
21,834 |
|
|
|
22,512 |
|
| Contingent development support obligations (j) |
|
|
8,824 |
|
|
|
4,615 |
|
| Note payable to related party (k) |
|
|
25,808 |
|
|
|
25,808 |
|
| Other |
|
|
41,156 |
|
|
|
34,534 |
|
| |
|
$ |
595,442 |
|
|
$ |
683,819 |
|
| Less: current portion |
|
|
(134,212 |
) |
|
|
(167,908 |
) |
| |
|
$ |
461,230 |
|
|
$ |
515,911 |
|
|
(a) |
Contract adjustment payment |
In June 2021, the Company sold 23,000,000 Green Equity Units for total gross
proceeds of $1,150,000 (note 9(c)). Total annual distributions on the Green Equity Units are at a rate of 7.75%, consisting of interest on the notes (1.18% per year) and payments under the share purchase contract (6.57% per year). The present value
of the contract adjustment payments was estimated at $222,378 and recorded in other liabilities. The contract adjustment payments amount is accreted over the three-year period.
|
(b) |
Asset retirement obligations |
Asset retirement obligations mainly relate to legal requirements to: (i) remove wind
farm facilities upon termination of land leases; (ii) cut (disconnect from the distribution system), purge (cleanup of natural gas and polychlorinated biphenyls (“PCB”) contaminants) and cap natural gas mains within the natural gas distribution and
transmission system when mains are retired in place, or sections of natural gas main are removed from the pipeline system; (iii) clean and remove storage tanks containing waste oil and other waste contaminants; (iv) remove certain river water intake
structures and equipment; (v) dispose of coal combustion residuals and PCB contaminants; (vi) remove asbestos upon major renovation or demolition of structures and facilities; and (vii) decommission and restore power generation engines and related
facilities.
Changes in the asset retirement obligations are as follows:
| |
|
2022 |
|
|
2021 |
|
| Opening balance |
|
$ |
142,147 |
|
|
$ |
79,968 |
|
| Obligation assumed |
|
|
793 |
|
|
|
57,067 |
|
| Retirement activities |
|
|
(27,980 |
) |
|
|
(4,133 |
) |
| Accretion |
|
|
4,589 |
|
|
|
4,381 |
|
| Change in cash flow estimates |
|
|
(2,965 |
) |
|
|
4,864 |
|
| Closing balance |
|
$ |
116,584 |
|
|
$ |
142,147 |
|
| Notes to the Consolidated Financial Statements |
121 |
Algonquin Power & Utilities Corp.
Notes to the Consolidated Financial Statements
December 31, 2022 and 2021
(in thousands of U.S. dollars, except as noted and per share amounts)
|
12. |
Other long-term liabilities (continued) |
|
(b) |
Asset retirement obligations (continued) |
As the cost of retirement of utility assets in the United States is expected to be
recovered through rates, a corresponding regulatory asset is recorded for liability accretion and asset depreciation expense (note 7(j)).
|
(c) |
Advances in aid of construction |
The Company’s regulated utilities have various agreements with real estate
development companies (the “developers”) conducting business within the Company’s utility service territories, whereby funds are advanced to the Company by the developers to assist with funding some or all of the costs of the development.
In many instances, developer advances can be subject to refund, but the refund is
non-interest bearing. Refunds of developer advances are made over periods generally ranging from 5 to 40 years. Advances not refunded within the prescribed period are usually not required to be repaid. After the prescribed period has lapsed, any
remaining unpaid balance is transferred to contributions in aid of construction and recorded as an offsetting amount to the cost of property, plant and equipment. In 2022, $1,299 (2021 - $6,376) was transferred from advances in aid of construction to
contributions in aid of construction.
|
(d) |
Environmental remediation obligation |
A number of the Company’s regulated utilities were named as potentially responsible
parties for remediation of several sites at which hazardous waste is alleged to have been disposed as a result of historical operations of manufactured natural gas plants (“MGP”) and related facilities. The Company is currently investigating and
remediating, as necessary, those MGP and related sites in accordance with plans submitted to the agency with authority for each of the respective sites.
The Company estimates the remaining undiscounted, unescalated cost of the
environmental cleanup activities will be $48,346 (2021 - $57,167), which at discount rates ranging from 3.4% to 4.2% represents the recorded accrual of $42,457 as of December 31, 2022 (2021 - $55,224). Approximately $27,410 is expected to be incurred
over the next three years, with the balance of cash flows to be incurred over the following 30 years.
Changes in the environmental remediation obligation are as follows:
| |
|
2022 |
|
|
2021 |
|
| Opening balance |
|
$ |
55,224 |
|
|
$ |
69,383 |
|
| Remediation activities |
|
|
(5,243 |
) |
|
|
(9,865 |
) |
| Accretion |
|
|
2,167 |
|
|
|
1,025 |
|
| Changes in cash flow estimates |
|
|
1,344 |
|
|
|
2,265 |
|
| Revision in assumptions |
|
|
(11,035 |
) |
|
|
(7,584 |
) |
| Closing balance |
|
$ |
42,457 |
|
|
$ |
55,224 |
|
The Regulators for the New England Gas System and Energy North Gas System provide
for the recovery of actual expenditures for site investigation and remediation over a period of 7 years and, accordingly, as of December 31, 2022, the Company has reflected a regulatory asset of $70,529 (2021 - $81,802) for the MGP and related sites
(note 7(g)).
Customer deposits result from the Company’s obligation by Regulators to collect a
deposit from customers of its facilities under certain circumstances when services are connected. The deposits are refundable as allowed under the facilities’ regulatory agreement.
ALGONQUIN | LIBERTY
Algonquin Power & Utilities Corp.
Notes to the Consolidated Financial Statements
December 31, 2022 and 2021
(in thousands of U.S. dollars, except as noted and per share amounts)
|
12. |
Other long-term liabilities (continued) |
|
(f) |
Unamortized investment tax credits |
The unamortized investment tax credits were assumed in connection with the
acquisition of the Empire Electric System. The investment tax credits are associated with an investment made in a generating station. The credits are being amortized over the life of the generating station.
|
(g) |
Deferred credits and contingent consideration |
Deferred credits and contingent consideration include unresolved contingent
consideration related to prior acquisitions which is expected to be paid. In 2021, the Company recorded contingent consideration related to the acquisition of AAGES Sugar Creek Wind, LLC in an amount of $18,641 (note 3(f)).
|
(h) |
Preferred shares, Series C |
AQN has 100 redeemable preferred shares, Series C issued and outstanding. The
preferred shares are mandatorily redeemable in 2031 for C$53,400 per share and have a contractual cumulative cash dividend paid quarterly until the date of redemption based on a prescribed payment schedule indexed in proportion to the increase in CPI
over the term of the shares. The preferred shares, Series C are convertible into common shares at the option of the holder and the Company, at any time after May 20, 2031 and before June 19, 2031, at a conversion price of C$53,400 per share.
As these shares are mandatorily redeemable for cash, they are classified as
liabilities in the consolidated financial statements. The preferred shares, Series C are accounted for under the effective interest method, resulting in accretion of interest expense over the term of the shares. Dividend payments are recorded as a
reduction of the preferred shares, Series C carrying value.
Estimated dividend payments due in the next five years and dividend and redemption payments thereafter
are as follows:
| 2023 |
|
|
$ |
1,245 |
|
| 2024 |
|
|
|
1,443 |
|
| 2025 |
|
|
|
1,459 |
|
| 2026 |
|
|
|
1,316 |
|
| 2027 |
|
|
|
1,262 |
|
| Thereafter to 2031 |
|
|
|
4,654 |
|
| Redemption amount |
|
|
|
3,943 |
|
| |
|
|
$ |
15,322 |
|
| Less: amounts representing interest |
|
|
|
(3,250 |
) |
| |
|
|
$ |
12,072 |
|
| Less current portion |
|
|
|
(1,245 |
) |
| |
|
|
$ |
10,827 |
|
Hook up fees result from the collection from customers of funds for installation and
connection to the utility’s infrastructure. The fees are refundable as allowed under the facilities’ regulatory agreement.
|
(j) |
Contingent development support obligations |
The Company provides credit support necessary for the continued development and
construction of its equity investees’ wind and solar power electric development projects and infrastructure development projects. The contingent development support obligations represent the fair value of the support provided (note 8(c)).
| Notes to the Consolidated Financial Statements |
123 |
Algonquin Power & Utilities Corp.
Notes to the Consolidated Financial Statements
December 31, 2022 and 2021
(in thousands of U.S. dollars, except as noted and per share amounts)
|
12. |
Other long-term liabilities (continued) |
|
(k) |
Note payable to related party |
In 2020, a subsidiary of the Company made a tax equity investment into Altavista Solar
Subco, LLC, an equity investee of the Company and indirect owner of the Altavista Solar Project. Following the closing of the construction financing facility for the Altavista Solar Project, certain excess funds were distributed to the Company and in
return the Company issued a promissory note payable of $30,493 to Altavista Solar Subco, LLC. The promissory note bears an interest rate of 0.675%, compounded annually. The note was repaid in full during the second quarter of 2021.
In 2021, a subsidiary of the Company made a tax equity investment into New Market
Solar Investco, LLC, an equity investee of the Company and indirect owner of the New Market Solar Project (note 8(c)). Following the closing of the construction financing facility for the New Market Solar Project, certain excess funds were
distributed to the Company and in return the Company issued a promissory note of $25,808 payable to New Market Solar Investco, LLC. The promissory note bears an interest rate of 4% annually and has a maturity date of December 16, 2031.
|
13. |
Shareholders’ capital |
Number of common shares
| |
|
2022 |
|
|
2021 |
|
| Common shares, beginning of year |
|
|
671,960,276 |
|
|
|
597,142,219 |
|
| Public offering |
|
|
2,861,709 |
|
|
|
67,611,465 |
|
| Dividend reinvestment plan |
|
|
7,676,666 |
|
|
|
6,184,686 |
|
| Exercise of share-based awards (c) |
|
|
1,115,398 |
|
|
|
1,020,020 |
|
| Conversion of convertible debentures |
|
|
754 |
|
|
|
1,886 |
|
| Common shares, end of year |
|
|
683,614,803 |
|
|
|
671,960,276 |
|
Authorized
AQN is authorized to issue an unlimited number of common shares. The holders of the
common shares are entitled to dividends if, as and when declared by the board of directors of AQN (the “Board”); to one vote per share at meetings of the holders of common shares; and upon liquidation, dissolution or winding up of AQN to receive pro
rata the remaining property and assets of AQN, subject to the rights of any shares having priority over the common shares.
The Company has a shareholders’ rights plan (the “Rights Plan”), which expires in
2025. Under the Rights Plan, one right is issued with each issued share of the Company. The rights remain attached to the shares and are not exercisable or separable unless one or more certain specified events occur. If a person or group acting in
concert acquires 20 percent or more of the outstanding shares (subject to certain exceptions) of the Company, the rights will entitle the holders thereof (other than the acquiring person or group) to purchase shares at a 50 percent discount from the
then-current market price. The rights provided under the Rights Plan are not triggered by any person making a “Permitted Bid”, as defined in the Rights Plan.
(i) Public offering
On November 8, 2021, AQN issued 44,080,000 common shares at a price of $14.63
(C$18.15)per share for total gross proceeds of $642,664 (C$800,052) before issuance costs of $26,173 (C$32,583), which AQN intends to use to partially finance the Kentucky Power Transaction; provided that, in the short-term, prior to the closing of
the Kentucky Power Transaction, the Company has used the net proceeds to repay certain indebtedness of AQN and its subsidiaries (note 3(b)). Forward contracts were used to manage the Canadian dollar risk (note 24(b)(iv)).
ALGONQUIN | LIBERTY
Algonquin Power & Utilities Corp.
Notes to the Consolidated Financial Statements
December 31, 2022 and 2021
(in thousands of U.S. dollars, except as noted and per share amounts)
|
13. |
Shareholders’ capital (continued) |
|
(a) |
Common shares (continued) |
|
(ii) |
At-the-market equity program |
On August 15, 2022, AQN re-established its at-the-market equity program
(“ATM program”) which allows the Company to issue up to $500,000 (or the equivalent in Canadian dollars) of common shares from treasury to the public from time to time, at the Company’s discretion, at the prevailing market price when issued on the
Toronto Stock Exchange (“TSX”), the New York Stock Exchange (“NYSE”), or any other existing trading market for the common shares of the Company in Canada or the United States. During the year ended December 31, 2022, the Company issued 2,861,709
common shares under the ATM program at an average price of $13.94 per common share for gross proceeds of $38,923 ($38,534 net of commissions). Other related costs were $558.
The Company has issued since the inception of the ATM program in 2019 a
cumulative total of 36,814,536 common shares at an average price of $15.00 per share for gross proceeds of $551,086 ($544,295 net of commissions). Other related costs, primarily related to the establishment and subsequent re-establishments of the ATM
program, were $4,843.
(iii) Dividend reinvestment plan
The Company has a common shareholder dividend reinvestment plan, which,
when the plan is active, provides an opportunity for holders of AQN’s common shares who reside in Canada, the United States, or, subject to AQN’s consent, other jurisdictions, to reinvest the cash dividends paid on their common shares in additional
common shares which, at AQN’s election, are either purchased on the open market or newly issued from treasury. Effective March 3, 2022, common shares purchased under the plan were issued at a 3% discount (previously at 5%) to the prevailing market
price (as determined in accordance with the terms of the plan). Subsequent to year-end, AQN issued an additional 4,370,289 common shares under the dividend reinvestment plan. Effective March 16, 2023, AQN suspended the dividend reinvestment plan.
Dividends will only be paid in cash while the reinvestment plan is suspended.
AQN is authorized to issue an unlimited number of preferred shares,
issuable in one or more series, containing terms and conditions as approved by the Board.
The Company has the following preferred shares, Series A and preferred
shares, Series D issued and outstanding as at December 31, 2022 and 2021:
| Preferred shares |
|
Number of
shares |
|
|
Price per
share |
|
|
Carrying
amount C$ |
|
|
Carrying
amount $ |
|
| Series A |
|
|
4,800,000 |
|
|
C$ |
25 |
|
|
C$ |
116,546 |
|
|
$ |
100,463 |
|
| Series D |
|
|
4,000,000 |
|
|
C$ |
25 |
|
|
C$ |
97,259 |
|
|
$ |
83,836 |
|
| |
|
|
|
|
|
|
|
|
|
|
|
|
|
$ |
184,299 |
|
The holders of preferred shares, Series A are entitled to receive
quarterly fixed cumulative preferential cash dividends, if, as and when declared by the Board. The dividend for each year up to, but excluding, December 31, 2023 will be an annual amount of C$1.2905 per share. The Series A dividend rate will reset on
December 31, 2023 and every five years thereafter at a rate equal to the then five-year Government of Canada bond yield plus 2.94%. The preferred shares, Series A are redeemable at C$25 per share at the option of the Company on December 31, 2023 and
every fifth year thereafter. The holders of preferred shares, Series A have the right to convert their shares into cumulative floating rate preferred shares, Series B, subject to certain conditions, on December 31, 2023, and every fifth year
thereafter.
The holders of preferred shares, Series D are entitled to receive fixed
cumulative preferential dividends as and when declared by the Board at an annual amount of C$1.2728 per share for each year up to, but excluding, March 31, 2024. The Series D dividend will reset on March 31, 2024 and every five years thereafter at a
rate equal to the then five-year Government of Canada bond plus 3.28%. The preferred shares, Series D are redeemable at C$25 per share at the option of the Company on March 31, 2024 and every fifth year thereafter. The holders of preferred shares,
Series D have the right to convert their shares into cumulative floating rate preferred shares, Series E, subject to certain conditions, on March 31, 2024, and every fifth year thereafter.
| Notes to the Consolidated Financial Statements |
125 |
Algonquin Power & Utilities Corp.
Notes to the Consolidated Financial Statements
December 31, 2022 and 2021
(in thousands of U.S. dollars, except as noted and per share amounts)
|
13. |
Shareholders’ capital (continued) |
|
(b) |
Preferred shares (continued) |
The Company has 100 redeemable preferred shares, Series C issued and
outstanding. The mandatorily redeemable preferred shares, Series C are recorded as a liability on the consolidated balance sheets as they are mandatorily redeemable for cash (note 12(h)).
|
(c) |
Share-based compensation |
For the year ended December 31, 2022, AQN recorded $10,920 (2021 -
$8,395) in total share-based compensation expense as follows:
| |
|
2022 |
|
|
2021 |
|
| Share options |
|
$ |
980 |
|
|
$ |
939 |
|
| Director deferred share units |
|
|
960 |
|
|
|
821 |
|
| Employee share purchase |
|
|
562 |
|
|
|
592 |
|
| Performance and restricted share units |
|
|
8,418 |
|
|
|
6,043 |
|
| Total share-based compensation |
|
$ |
10,920 |
|
|
$ |
8,395 |
|
The compensation expense is recorded with operating expenses in the
consolidated statements of operations. The portion of share-based compensation costs capitalized as cost of construction is insignificant.
As of December 31, 2022, total unrecognized compensation costs related
to non-vested share-based awards was $10,732 and is expected to be recognized over a period of 1.8 years.
The Company’s share option plan (the “Plan”) permits the grant of share
options to officers, directors, employees and selected service providers. The aggregate number of shares that may be reserved for issuance under the Plan must not exceed 8% of the number of shares outstanding at the time the options are granted.
The number of shares subject to each option, the option price, the
expiration date, the vesting and other terms and conditions relating to each option shall be determined by the Board (or the compensation committee of the Board (“Compensation Committee”)) from time to time. Dividends on the underlying shares do not
accumulate during the vesting period. Option holders may elect to surrender any portion of the vested options that is then exercisable in exchange for the “In-the-Money Amount”. In accordance with the Plan, the “In-The-Money Amount” represents the
excess, if any, of the market price of a share at such time over the option price, in each case such “In-the-Money Amount” being payable by the Company in cash or common shares at the election of the Company. As the Company does not expect to settle
these instruments in cash, these options are accounted for as equity awards.
The Compensation Committee may accelerate the vesting of the unvested
options then held by the optionee at the Compensation Committee’s discretion. In the event that the Company restates its financial results, any unpaid or unexercised options may be cancelled at the discretion of the Compensation Committee in
accordance with the terms of the Company’s clawback policy.
The estimated fair value of options, including the effect of estimated
forfeitures, is recognized as expense on a straight-line basis over the options’ vesting periods while ensuring that the cumulative amount of compensation cost recognized at least equals the value of the vested portion of the award at that date. The
Company determines the fair value of options granted using the Black-Scholes option-pricing model. The risk-free interest rate is based on the zero-coupon Canada Government bond with a similar term to the expected life of the options at the grant
date. Expected volatility was estimated based on the historical volatility of the Company’s common shares. The expected life was based on experience to date. The dividend yield rate was based upon recent historical dividends paid on AQN common
shares.
Algonquin Power & Utilities Corp.
Notes to the Consolidated Financial Statements
December 31, 2022 and 2021
(in thousands of U.S. dollars, except as noted and per share amounts)
|
13. |
Shareholders’ capital (continued) |
|
(c) |
Share-based compensation (continued) |
|
(ii) |
Share option plan (continued) |
The following assumptions were used in determining the fair value of share options granted:
| |
|
2022 |
|
|
2021 |
|
| Risk-free interest rate |
|
|
1.9 |
% |
|
|
1.1 |
% |
| Expected volatility |
|
|
23 |
% |
|
|
23 |
% |
| Expected dividend yield |
|
|
4.3 |
% |
|
|
4.1 |
% |
| Expected life |
|
|
5.50 years |
|
|
5.50 years |
| Weighted average grant date fair value per option |
|
C$ |
2.44 |
|
|
C$ |
2.46 |
|
Share option activity during the years is as follows:
| |
|
|
Number of
awards |
|
|
Weighted
average
exercise
price |
|
|
Weighted
average
remaining
contractual
term (years) |
|
|
Aggregate
intrinsic
value |
|
| Balance, January 1, 2021 |
|
|
|
2,110,448 |
|
|
C$ |
15.45 |
|
|
|
6.55 |
|
|
C$ |
11,604 |
|
| Granted |
|
|
|
437,006 |
|
|
|
19.64 |
|
|
|
7.22 |
|
|
|
— |
|
| Exercised |
|
|
|
(506,926 |
) |
|
|
13.92 |
|
|
|
5.95 |
|
|
|
1,453 |
|
| Forfeited |
|
|
|
— |
|
|
|
— |
|
|
|
— |
|
|
|
— |
|
| Balance, December 31, 2021 |
|
|
|
2,040,528 |
|
|
C$ |
15.45 |
|
|
|
6.11 |
|
|
C$ |
3,145 |
|
| Granted |
|
|
|
646,090 |
|
|
|
19.11 |
|
|
|
7.22 |
|
|
|
— |
|
| Exercised |
|
|
|
(40,074 |
) |
|
|
13.92 |
|
|
|
5.95 |
|
|
|
103 |
|
| Forfeited |
|
|
|
(19,764 |
) |
|
|
19.11 |
|
|
|
— |
|
|
|
— |
|
| Balance, December 31, 2022 |
|
|
|
2,626,780 |
|
|
C$ |
16.02 |
|
|
|
5.63 |
|
|
C$ |
— |
|
| Exercisable, December 31, 2022 |
|
|
|
2,052,946 |
|
|
C$ |
17.35 |
|
|
|
5.63 |
|
|
C$ |
— |
|
|
(iii) |
Employee share purchase plan |
Under the Company’s ESPP, eligible employees may have a portion of
their earnings withheld to be used to purchase the Company’s common shares. The Company will match 20% of the employee contribution amount for the first five thousand dollars per employee contributed annually and 10% of the employee contribution
amount for contributions over five thousand dollars up to ten thousand dollars annually. Common shares purchased through the Company match portion shall not be eligible for sale by the participant for a period of one year following the purchase date
on which such shares were acquired. At the Company’s option, the common shares may be (i) issued to participants from treasury at the average share price or (ii) acquired on behalf of participants by purchases through the facilities of the TSX or
NYSE by an independent broker. The aggregate number of common shares reserved for issuance from treasury by AQN under the ESPP shall not exceed 4,000,000 common shares.
| Notes to the Consolidated Financial Statements |
127 |
Algonquin Power & Utilities Corp.
Notes to the Consolidated Financial Statements
December 31, 2022 and 2021
(in thousands of U.S. dollars, except as noted and per share amounts)
|
13. |
Shareholders’ capital (continued) |
|
(c) |
Share-based compensation (continued) |
|
(iii) |
Employee share purchase plan (continued) |
The Company uses the fair value based method to measure the
compensation expense related to the Company’s contribution. For the year ended December 31, 2022, a total of 414,338 common shares (2021 - 355,096) were issued to employees under the ESPP.
|
(iv) |
Director’s deferred share units |
Under the Company’s DSU plan, non-employee directors of the Company may
elect annually to receive all or any portion of their compensation in DSUs in lieu of cash compensation. Directors’ fees are paid on a quarterly basis and at the time of each payment of fees, the applicable amount is converted to DSUs. A DSU has a
value equal to one of the Company’s common shares. Dividends accumulate in the DSU account and are converted to DSUs based on the market value of the shares on that date. DSUs cannot be redeemed until the director retires, resigns, or otherwise
leaves the Board. The DSUs provide for settlement in cash or common shares at the election of the Company. As the Company does not expect to settle these instruments in cash, these options are accounted for as equity awards. For the year ended
December 31, 2022, a total of 120,513 DSUs (2021 - 73,467) were issued and 5,176 DSUs (2021 - 87,582) were settled in exchange for 2,403 common shares issued from treasury, and 2,773 DSUs were settled at their cash value as payment for tax
withholding related to the settlement of the awards. As of December 31, 2022, 645,714 (2021 - 530,378) DSUs were outstanding pursuant to the election of the directors to defer a percentage of their director’s fee in the form of DSUs. The aggregate
number of common shares reserved for issuance from treasury by AQN under the DSU plan shall not exceed 1,000,000 common shares.
|
(v) |
Performance and restricted share units |
The Company offers a PSU and RSU plan to its employees as part of the
Company’s long-term incentive program. PSUs have been granted annually for three-year overlapping performance cycles. The PSUs vest at the end of the three-year cycle and are calculated based on established performance criteria. At the end of the
three-year performance periods, the number of common shares issued can range from 2.5% to 237% of the number of PSUs granted. RSU vesting conditions and dates vary by grant and are outlined in each award letter. RSUs are not subject to performance
criteria. Dividends accumulating during the vesting period are converted to PSUs and RSUs based on the market value of the shares on that date and are recorded in equity as the dividends are declared. None of the PSUs or RSUs have voting rights. Any
PSUs or RSUs not vested at the end of a performance period will expire. The PSUs and RSUs provide for settlement in cash or common shares at the election of the Company. As the Company does not expect to settle these instruments in cash, these units
are accounted for as equity awards. The aggregate number of common shares reserved for issuance from treasury by AQN under the PSU and RSU plan shall not exceed 7,000,000 common shares.
Compensation expense associated with PSUs is recognized rateably over
the performance period. Achievement of the performance criteria is estimated at the consolidated balance sheet dates. Compensation cost recognized is adjusted to reflect the performance conditions estimated to date.
Algonquin Power & Utilities Corp.
Notes to the Consolidated Financial Statements
December 31, 2022 and 2021
(in thousands of U.S. dollars, except as noted and per share amounts)
|
13. |
Shareholders’ capital (continued) |
|
(c) |
Share-based compensation (continued) |
|
(v) |
Performance and restricted share units (continued) |
| |
|
|
| |
A summary of the PSUs and RSUs follows: |
| |
|
Number of
awards |
|
|
Weighted
average
grant-date
fair value |
|
|
Weighted
average
remaining
contractual
term (years) |
|
|
Aggregate
intrinsic
value |
|
| Balance, January 1, 2021 |
|
|
2,721,207 |
|
|
C$ |
16.58 |
|
|
|
0.93 |
|
|
C$ |
54,560 |
|
| Granted, including dividends |
|
|
805,433 |
|
|
|
19.94 |
|
|
|
2.77 |
|
|
|
12,881 |
|
| Exercised |
|
|
(865,067 |
) |
|
|
13.79 |
|
|
|
— |
|
|
|
17,005 |
|
| Forfeited |
|
|
(217,901 |
) |
|
|
18.64 |
|
|
|
— |
|
|
|
3,981 |
|
| Balance, December 31, 2021 |
|
|
2,443,672 |
|
|
C$ |
18.07 |
|
|
|
1.72 |
|
|
C$ |
44,646 |
|
| Granted, including dividends |
|
|
1,090,457 |
|
|
|
17.99 |
|
|
|
2.00 |
|
|
|
17,524 |
|
| Exercised |
|
|
(1,221,620 |
) |
|
|
12.62 |
|
|
|
— |
|
|
|
23,636 |
|
| Forfeited |
|
|
(202,799 |
) |
|
|
18.94 |
|
|
|
— |
|
|
|
418 |
|
| Balance, December 31, 2022 |
|
|
2,109,710 |
|
|
C$ |
18.38 |
|
|
|
1.76 |
|
|
C$ |
18,608 |
|
| Exercisable, December 31, 2022 |
|
|
769,458 |
|
|
C$ |
18.70 |
|
|
|
0.10 |
|
|
C$ |
6,787 |
|
Eligible employees have the option to receive a portion or all of their
annual bonus payment in RSUs in lieu of cash. These RSUs provide for settlement in shares, and therefore these RSUs are accounted for as equity awards. The RSUs granted are 100% vested and, therefore, compensation expense associated with these RSUs
is recognized immediately upon issuance.
During the year ended December, 31, 2022, 55,445 (2021 - 56,686) bonus
deferral RSUs were granted to employees of the Company. In addition, t he Company settled 178,368 (2021 - 152,564) bonus deferral RSUs in exchange for 82,886 (2021 - 70,571) common shares issued from treasury, and 95,482 (2021- 81,993) RSUs were
settled at their cash value as payment for tax withholdings related to the settlement of the RSUs. As of December 31, 2022, 158,486 (2021 - 281,411) bonus deferral RSUs were outstanding.
| Notes to the Consolidated Financial Statements |
129 |
Algonquin Power & Utilities Corp.
Notes to the Consolidated Financial Statements
December 31, 2022 and 2021
(in thousands of U.S. dollars, except as noted and per share amounts)
|
14. |
Accumulated other comprehensive income (loss) |
AOCI consists of the following balances, net of tax:
| |
|
Foreign
currency
cumulative
translation
|
|
Unrealized
gain on cash
flow hedges
|
|
Pension and
post-
employment
actuarial
changes
|
|
Total |
| Balance, January 1, 2021 |
|
$ |
(39,725 |
) |
|
$ |
50,817 |
|
|
$ |
(33,599 |
) |
|
$ |
(22,507 |
) |
| Other comprehensive income (loss) |
|
|
(25,982 |
) |
|
|
(97,103 |
) |
|
|
32,247 |
|
|
|
(90,838 |
) |
| Amounts reclassified from AOCI to the consolidated statement of
operations |
|
|
(4,288 |
) |
|
|
42,772 |
|
|
|
9,804 |
|
|
|
48,288 |
|
| Net current period OCI |
|
$ |
(30,270 |
) |
|
$ |
(54,331 |
) |
|
$ |
42,051 |
|
|
$ |
(42,550 |
) |
| OCI attributable to the non-controlling interests |
|
|
(249 |
) |
|
|
— |
|
|
|
— |
|
|
|
(249 |
) |
| Net current period OCI attributable to shareholders of AQN |
|
$ |
(30,519 |
) |
|
$ |
(54,331 |
) |
|
$ |
42,051 |
|
|
$ |
(42,799 |
) |
| Amount reclassified from AOCI to non-controlling interest |
|
|
(6,371 |
) |
|
|
— |
|
|
|
— |
|
|
|
(6,371 |
) |
| Balance, December 31, 2021 |
|
$ |
(76,615 |
) |
|
$ |
(3,514 |
) |
|
$ |
8,452 |
|
|
$ |
(71,677 |
) |
| Other comprehensive income (loss) |
|
|
(18,013 |
) |
|
|
(128,838 |
) |
|
|
23,722 |
|
|
|
(123,129 |
) |
| Amounts reclassified from AOCI to the consolidated statement of
operations |
|
|
(5,489 |
) |
|
|
34,543 |
|
|
|
4,039 |
|
|
|
33,093 |
|
| Net current period OCI |
|
$ |
(23,502 |
) |
|
|
(94,295 |
) |
|
|
27,761 |
|
|
$ |
(90,036 |
) |
| OCI attributable to the non-controlling interests |
|
|
1,650 |
|
|
|
— |
|
|
|
— |
|
|
|
1,650 |
|
| Net current period OCI attributable to shareholders of AQN |
|
$ |
(21,852 |
) |
|
|
(94,295 |
) |
|
|
27,761 |
|
|
$ |
(88,386 |
) |
| Balance, December 31, 2022 |
|
$ |
(98,467 |
) |
|
$ |
(97,809 |
) |
|
$ |
36,213 |
|
|
$ |
(160,063 |
) |
Amounts reclassified from AOCI for foreign currency cumulative translation
affected interest expense and derivative gain (loss); those for unrealized gain (loss) on cash flow hedges affected revenue from non-regulated energy sales, interest expense and derivative gain (loss) while those for pension and post-employment
actuarial changes affected pension and post-employment non-service costs.
All dividends of the Company are made on a
discretionary basis as determined by the Board. The Company declares and pays the dividends on its common shares in U.S. dollars. Dividends declared were as follows:
| |
|
2022 |
|
|
2021 |
|
| |
|
|
|
|
Dividend per |
|
|
|
|
|
Dividend per |
|
| |
|
Dividend |
|
|
share |
|
|
Dividend |
|
|
share |
|
| Common shares |
|
$ |
486,043 |
|
|
$ |
0.7130 |
|
|
$ |
423,023 |
|
|
$ |
0.6669 |
|
| Preferred shares, Series A |
|
C$ |
6,194 |
|
|
C$ |
1.2905 |
|
|
C$ |
6,194 |
|
|
C$ |
1.2905 |
|
| Preferred shares, Series D |
|
C$ |
5,091 |
|
|
C$ |
1.2728 |
|
|
C$ |
5,091 |
|
|
C$ |
1.2728 |
|
| |
ALGONQUIN | LIBERTY |
| 130 |
2022 Annual Report |
Algonquin Power & Utilities Corp.
Notes to the Consolidated Financial Statements
December 31, 2022 and 2021
(in thousands of U.S. dollars, except as noted and per share amounts)
|
16. |
Related party transactions |
|
(a) |
Equity-method investments |
The Company provides administrative and development
services to its equity-method investees and is reimbursed for incurred costs. To that effect, during 2022, the Company charged its equity-method investees $63,861 (2021 - $25,778). Additionally, Liberty Development JV Inc., an equity-method investee
(note 8(c)) provides development services to the Company on specified projects, for which it earns a development fee upon reaching certain milestones. During the year, the development fees charged to the Company were $12,628 (2021 - $2,036).
Investment and acquisition transactions with
equity-method investments are described in note 8(c). In addition, during 2021, the Company paid $1,500 to Abengoa S.A. (“Abengoa”) to purchase all of Abengoa’s interests in the AAGES, AAGES Development Canada Inc., and AAGES Development Spain, S.A.
joint ventures. The assets acquired for AAGES Development Spain S.A. included project development assets for $2,662 and working capital of $1,507. The loan at that date between the Company and AAGES Development Spain S.A. of $3,089 was treated as
additional consideration paid to acquire the partnership.
In 2020, the Company issued a promissory note of
$30,493 payable to Altavista Solar Subco, LLC, an equity investee of the Company at the time. The note was repaid in full during the second quarter of 2021. During the fourth quarter of 2021, the Company issued a promissory note of $25,808 payable to
New Market Solar Investco, LLC, an equity investee of the Company (note 12(k)).
|
(b) |
Non-controlling interest and redeemable non-controlling interest held by related party |
Non-controlling interest and redeemable
non-controlling interest held by related party are described in note 17.
|
(c) |
Transactions with Atlantica |
During 2021, the Company sold Colombian solar assets
to Atlantica for consideration of $23,863, with a gain on sale of $878, and contingent consideration of $2,600. The contingency was resolved in 2022 and, as a result, an additional gain of $1,200 was recognized.
The above related party transactions have been
recorded at the exchange amounts agreed to by the parties to the transactions.
|
17. |
Non-controlling interests and redeemable non-controlling interests |
Net effect attributable to non-controlling interests
for the years ended December 31 consists of the following:
| |
|
2022 |
|
2021 |
| HLBV and other adjustments attributable to: |
|
|
|
|
|
|
|
|
| Non-controlling interests - tax equity partnership units |
|
$ |
108,695 |
|
|
$ |
88,417 |
|
| Non-controlling interests - redeemable tax equity partnership units |
|
|
6,298 |
|
|
|
6,902 |
|
| Other net earnings attributable to: |
|
|
|
|
|
|
|
|
| Non-controlling interests |
|
|
(3,670 |
) |
|
|
(5,682 |
) |
| |
|
$ |
111,323 |
|
|
$ |
89,637 |
|
| Redeemable non-controlling interest, held by
related party |
|
|
(15,157 |
) |
|
|
(10,435 |
) |
| Net effect of non-controlling interests |
|
$ |
96,166 |
|
|
$ |
79,202 |
|
The non-controlling tax equity investors (“tax
equity partnership units”) in the Company’s U.S. wind power and solar power generating facilities are entitled to allocations of earnings, tax attributes and cash flows in accordance with contractual agreements. The share of earnings attributable to
the non-controlling interest holders in these subsidiaries is calculated using the HLBV method of accounting as described in note 1(s).
| Notes to the Consolidated Financial Statements |
131 |
Algonquin Power & Utilities Corp.
Notes to the Consolidated Financial Statements
December 31, 2022 and 2021
(in thousands of U.S. dollars, except as noted and per share amounts)
|
17. |
Non-controlling interests and redeemable non-controlling interests (continued) |
Non-controlling interests
| |
|
Non-controlling interests - tax |
|
Other non-controlling |
|
Non-controlling interests |
|
| |
|
|
equity partnership units (a) |
|
|
interests (b) |
|
|
held by related parties (c) |
|
| |
|
|
2022 |
|
|
|
2021 |
|
|
|
2022 |
|
|
|
2021 |
|
|
2022 |
|
|
2021 |
|
| Opening balance |
|
$ |
1,377,117 |
|
|
$ |
388,253 |
|
|
$ |
64,807 |
|
|
$ |
11,234 |
|
$ |
81,158 |
|
$ |
59,125 |
|
| Net earnings attributable to NCI |
|
|
(105,371 |
) |
|
|
(87,422 |
) |
|
|
345 |
|
|
|
3,354 |
|
|
— |
|
|
— |
|
| Contributions received, net |
|
|
6,182 |
|
|
|
1,058,929 |
|
|
|
267,515 |
|
|
|
51,451 |
|
|
— |
|
|
39,376 |
|
| Dividends and distributions declared |
|
|
(40,086 |
) |
|
|
(11,795 |
) |
|
|
— |
|
|
|
(1,021 |
) |
|
(20,978 |
) |
|
(17,793 |
) |
| Repurchase of non-controlling interest |
|
|
(12,249 |
) |
|
|
— |
|
|
|
— |
|
|
|
— |
|
|
— |
|
|
— |
|
| Non-controlling interest assumed on asset acquisition |
|
|
— |
|
|
|
29,141 |
|
|
|
— |
|
|
|
— |
|
|
— |
|
|
— |
|
| OCI |
|
|
15 |
|
|
|
11 |
|
|
|
695 |
|
|
|
(211 |
) |
|
(2,358 |
) |
|
450 |
|
| Closing balance |
|
$ |
1,225,608 |
|
|
$ |
1,377,117 |
|
|
$ |
333,362 |
|
|
$ |
64,807 |
|
$ |
57,822 |
|
$ |
81,158 |
|
|
(a) |
Non-controlling interests - tax equity partnership units |
The Company obtained control of the three Mid-West
Wind Facilities, Sugar Creek Wind Facility and Maverick Creek Wind Facility in 2021 (notes 3(d) and 3(f)), assuming non-controlling interest of $29,141. Post acquisition in 2021, third-party tax equity investors funded $530,880, $380,829 and
$147,914, to the Mid-West Wind Facilities, the Sugar Creek Wind Facility and the Maverick Creek Wind Facility, respectively, in exchange for Class A partnership units in the entities.
|
(b) |
Other non-controlling interests |
On December 29, 2022, the Company sold a 49%
non-controlling interest in three operating wind facilities in the United States totalling 551 MW of installed capacity: the Odell Wind Facility in Minnesota, the Deerfield Wind Facility in Michigan and the Sugar Creek Wind Facility in Illinois. The
consideration of $277,500 was recorded as an increase to non-controlling interest, except for a portion of $5,000, which is subject to refund if some conditions are met and as such was recorded as redeemable non-controlling interest.
In January 2021, the Company sold a 32% interest in
Eco Acquisitionco SpA, the holding company through which AQN’s interest in ESSAL is held, to a third party for consideration of $51,750. This represents an interest of 30% in the aggregate interest in ESSAL, which was reflected by a corresponding
increase in non-controlling interest. This transaction resulted in no gain or loss. Following this transaction, AQN indirectly owns approximately 64% of the outstanding shares of ESSAL and continues to consolidate ESSAL’s operations.
|
(c) |
Non-controlling interest held by related parties |
In November 2021, Liberty Development JV Inc. invested
$39,376 i n Algonquin (AY Holdco) B.V., a consolidated subsidiary of the Company. In May 2019, AYES Canada acquired an interest in a consolidated subsidiary of the Company for $96,752 (C$130,103) (note 8(b)). The investment by AYES Canada and Liberty
Development JV Inc. are presented as a non-controlling interest held by related parties.
| |
ALGONQUIN | LIBERTY
|
| 132 |
2022 Annual Report |
Algonquin Power & Utilities Corp.
Notes to the Consolidated Financial Statements
December 31, 2022 and 2021
(in thousands of U.S. dollars, except as noted and per share amounts)
|
17. |
Non-controlling interests and redeemable non-controlling interests (continued) |
Redeemable non-controlling interests
Non-controlling interests in subsidiaries that are
redeemable upon the occurrence of uncertain events not solely within AQN’s control are classified as temporary equity on the consolidated balance sheets. If the redemption is probable or currently redeemable, the Company records the instruments at
their redemption value. Redemption is not considered probable as of December 31, 2022.
Liberty Global Energy Solutions (note 8(c)), an
equity investee of the Company, has a secured credit facility in the amount of $306,500 maturing on January 26, 2024. It is collateralized through a pledge of Atlantica ordinary shares held by AY Holdings. A collateral shortfall would occur if the
net obligation (as defined in the credit agreement) would equal or exceed 50% of the market value of such Atlantica shares, in which case the lenders would have the right to sell Atlantica shares to eliminate the collateral shortfall. The Liberty
Global Energy Solutions secured credit facility is repayable on demand if Atlantica ceases to be a public company or if certain other events are announced or completed that could restrict AY Holdings’ ability to sell or transfer its Atlantica
ordinary shares. Liberty Global Energy Solutions has a preference share ownership in AY Holdings which AQN reflects as redeemable non-controlling interest held by related party.
Changes in redeemable non-controlling interests are
as follows:
| |
|
|
Redeemable non-controlling
interests held by related party
|
|
|
|
Redeemable non-controlling
interests
|
|
| |
|
|
2022 |
|
|
|
2021 |
|
|
|
2022 |
|
|
|
2021 |
|
| Opening balance |
|
$ |
306,537 |
|
|
$ |
306,316 |
|
|
$ |
12,989 |
|
|
$ |
20,859 |
|
| Net earnings attributable to NCI |
|
|
15,157 |
|
|
|
10,435 |
|
|
|
(6,298 |
) |
|
|
(6,902 |
) |
| Contributions, net of costs |
|
|
— |
|
|
|
— |
|
|
|
5,000 |
|
|
|
— |
|
| Dividends and distributions declared |
|
|
(13,838 |
) |
|
|
(10,214 |
) |
|
|
(171 |
) |
|
|
(968 |
) |
| Closing balance |
|
$ |
307,856 |
|
|
$ |
306,537 |
|
|
$ |
11,520 |
|
|
$ |
12,989 |
|
The provision for income taxes in the consolidated
statements of operations represents an effective tax rate different than the Canadian enacted statutory rate of 26.5% (2021 - 26.5%). The differences are as follows:
| |
|
2022 |
|
2021 |
| Expected income tax expense at Canadian statutory rate |
|
$ |
(97,962 |
) |
|
$ |
37,691 |
|
| Increase (decrease) resulting from: |
|
|
|
|
|
|
|
|
| Effect of differences in tax rates on transactions in and within foreign jurisdictions and change in tax rates |
|
|
(55,315 |
) |
|
|
(47,600 |
) |
| Adjustments from investments carried at fair value |
|
|
51,314 |
|
|
|
2,709 |
|
| Non-controlling interests share of income |
|
|
30,025 |
|
|
|
25,135 |
|
| Change in valuation allowance |
|
|
41,702 |
|
|
|
(118 |
) |
| Non-deductible acquisition costs |
|
|
1,341 |
|
|
|
3,733 |
|
| Acquisition related state deferred tax adjustments |
|
|
5,998 |
|
|
|
— |
|
| Capital gain rate differential on disposal of renewable assets |
|
|
(7,340 |
) |
|
|
— |
|
| Tax credits |
|
|
(18,440 |
) |
|
|
(49,415 |
) |
| Adjustment relating to prior periods |
|
|
(1,390 |
) |
|
|
1,333 |
|
| Deferred income taxes on regulated income recorded as regulatory assets |
|
|
(2,155 |
) |
|
|
(3,807 |
) |
| Amortization and settlement of excess deferred income tax |
|
|
(14,855 |
) |
|
|
(16,778 |
) |
| Other |
|
|
5,564 |
|
|
|
3,692 |
|
| Income tax recovery |
|
$ |
(61,513 |
) |
|
$ |
(43,425 |
) |
| Notes to the Consolidated Financial Statements |
133 |
Algonquin Power & Utilities Corp.
Notes to the Consolidated Financial Statements
December 31, 2022 and 2021
(in thousands of U.S. dollars, except as noted and per share amounts)
|
18. |
Income taxes (continued) |
For the years ended December 31, 2022 and 2021,
earnings (loss) before income taxes consist of the following:
| |
|
2022 |
|
|
2021 |
|
| Canada (1) |
|
$ |
(363,050 |
) |
|
$ |
(60,848 |
) |
| U.S. |
|
|
(37,322 |
) |
|
|
153,719 |
|
| Other regions |
|
|
30,704 |
|
|
|
49,361 |
|
| |
|
$ |
(369,668 |
) |
|
$ |
142,232 |
|
(1) Inclusive of fair value gain (loss) on investments carried at fair value (note 8)
Income tax expense (recovery) attributable to income
(loss) consists of:
| |
|
Current |
|
|
Deferred |
|
|
Total |
|
| Year ended December 31, 2022 |
|
|
|
|
|
|
|
|
|
|
|
|
| Canada |
|
$ |
4,184 |
|
|
$ |
(74,595 |
) |
|
$ |
(70,411 |
) |
| United States |
|
|
1,579 |
|
|
|
6,183 |
|
|
|
7,762 |
|
| Other regions |
|
|
2,080 |
|
|
|
(944 |
) |
|
|
1,136 |
|
| |
|
$ |
7,843 |
|
|
$ |
(69,356 |
) |
|
$ |
(61,513 |
) |
| Year ended December 31, 2021 |
|
|
|
|
|
|
|
|
|
|
|
|
| Canada |
|
$ |
4,560 |
|
|
$ |
(33,993 |
) |
|
$ |
(29,433 |
) |
| United States |
|
|
1,024 |
|
|
|
(19,772 |
) |
|
|
(18,748 |
) |
| Other regions |
|
|
1,653 |
|
|
|
3,103 |
|
|
|
4,756 |
|
| |
|
$ |
7,237 |
|
|
$ |
(50,662 |
) |
|
$ |
(43,425 |
) |
| |
ALGONQUIN | LIBERTY |
| 134 |
2022 Annual Report |
Algonquin Power & Utilities Corp.
Notes to the Consolidated Financial Statements
December 31, 2022 and 2021
(in thousands of U.S. dollars, except as noted and per share amounts)
|
18. |
Income taxes (continued) |
The tax effect of temporary differences between the
financial statement carrying amounts of assets and liabilities and their respective tax bases that give rise to significant portions of the deferred tax assets and deferred tax liabilities as of December 31, 2022 and 2021 are presented below:
| |
|
2022 |
|
|
2021 |
|
| Deferred tax assets: |
|
|
|
|
|
|
|
|
| Non-capital loss, investment tax credits, currently non-deductible interest expenses, and financing costs |
|
$ |
878,000 |
|
|
$ |
761,666 |
|
| Pension and OPEB |
|
|
16,845 |
|
|
|
46,580 |
|
| Environmental obligation |
|
|
12,118 |
|
|
|
15,271 |
|
| Regulatory liabilities |
|
|
156,285 |
|
|
|
166,939 |
|
| Other |
|
|
61,917 |
|
|
|
64,460 |
|
| Total deferred income tax assets |
|
$ |
1,125,165 |
|
|
$ |
1,054,916 |
|
| Less: valuation allowance |
|
|
(107,583 |
) |
|
|
(27,471 |
) |
| Total deferred tax assets |
|
$ |
1,017,582 |
|
|
$ |
1,027,445 |
|
| Deferred tax liabilities: |
|
|
|
|
|
|
|
|
| Property, plant and equipment |
|
$ |
846,331 |
|
|
$ |
782,829 |
|
| Outside basis differentials |
|
|
315,581 |
|
|
|
412,665 |
|
| Regulatory accounts |
|
|
303,059 |
|
|
|
300,072 |
|
| Other |
|
|
33,834 |
|
|
|
30,471 |
|
| Total deferred tax liabilities |
|
$ |
1,498,805 |
|
|
$ |
1,526,037 |
|
| Net deferred tax liabilities |
|
$ |
(481,223 |
) |
|
$ |
(498,592 |
) |
| Consolidated balance sheets classification: |
|
|
|
|
|
|
|
|
| Deferred tax assets |
|
$ |
84,416 |
|
|
$ |
31,595 |
|
| Deferred tax liabilities |
|
|
(565,639 |
) |
|
|
(530,187 |
) |
| Net deferred tax liabilities |
|
$ |
(481,223 |
) |
|
$ |
(498,592 |
) |
The valuation allowance for deferred tax assets as
of December 31, 2022 was $107,583 (2021 - $27,471). The valuation allowance primarily relates to operating losses that, in the judgment of management, are not more likely than not to be realized. In assessing the realizability of deferred tax assets,
management considers whether it is more likely than not that some portion or all of the deferred tax assets will not be realized. The ultimate realization of deferred tax assets is dependent upon the generation of future taxable income during the
periods in which those temporary differences become deductible. Management considers the scheduled reversal of deferred tax liabilities (including the impact of available carryback and carryforward periods), projected future taxable income, and
tax-planning strategies in making this assessment. The amount of the deferred tax asset considered realizable, however, could be adjusted if estimates of future taxable income during the carryforward period are reduced or increased or if objective
negative evidence in the form of cumulative losses is no longer present and additional weight is given to subjective evidence such as Management projections for growth.
Primarily as a result of the impairment charges
discussed in notes 5 and 8(c), the U.S. entities in the Renewable Energy Group, which have historically been in an overall deferred tax liability position, are in an overall deferred tax asset position as at December 31, 2022. In the course of
assessing the U.S. deferred tax assets in the Renewable Energy Group, management concluded that, during the fourth quarter of 2022, it was no longer probable that the Renewable Energy Group would generate sufficient taxable income to realize the
benefit of the deferred tax assets of such group. AQN’s conclusion is based on the balance of all available positive and negative evidence applicable to the Renewable Energy Group, including material impairment charges recorded on certain assets,
insufficient taxable temporary differences to allow the full utilization of the deferred tax asset, insufficient forecasted taxable income and a historical 3 year cumulative loss position.
| Notes to the Consolidated Financial Statements |
135 |
Algonquin Power & Utilities Corp.
Notes to the Consolidated Financial Statements
December 31, 2022 and 2021
(in thousands of U.S. dollars, except as noted and per share amounts)
|
18. |
Income taxes (continued) |
The following table illustrates the annual movement
in the deferred tax valuation allowance:
| |
|
2022 |
|
|
2021 |
|
| Beginning balance |
|
$ |
27,471 |
|
|
$ |
29,824 |
|
| Charged to income tax expense (recovery) |
|
|
41,702 |
|
|
|
(118 |
) |
| Charged (reduction) to OCI |
|
|
40,613 |
|
|
|
(1,707 |
) |
| Reductions to other accounts |
|
|
(2,203 |
) |
|
|
(528 |
) |
| Ending balance |
|
$ |
107,583 |
|
|
$ |
27,471 |
|
As of December 31, 2022, the Company had non-capital
losses carried forward and tax credits available to reduce future years’ taxable income, which expire as follows:
| Non-capital loss carryforward and credits |
|
2023—2027 |
|
|
2028+ |
|
|
Total |
|
| Canada |
|
$ |
3,261 |
|
|
$ |
728,529 |
|
|
$ |
731,790 |
|
| US |
|
|
9,962 |
|
|
|
1,707,139 |
|
|
|
1,717,101 |
|
| Total non-capital loss carryforward |
|
$ |
13,223 |
|
|
$ |
2,435,668 |
|
|
$ |
2,448,891 |
|
| Tax credits |
|
$ |
4,428 |
|
|
$ |
151,676 |
|
|
$ |
156,104 |
|
The Company has provided for deferred income taxes
for the estimated tax cost of distributed earnings of certain of its subsidiaries. Deferred income taxes have not been provided on approximately $824,052 of undistributed earnings of certain foreign subsidiaries, as the Company has concluded that
such earnings are indefinitely reinvested and should not give rise to additional tax liabilities. A determination of the amount of the unrecognized tax liability relating to the remittance of such undistributed earnings is not practicable.
Other net losses consist of the following:
| |
|
2022 |
|
|
2021 |
|
| Acquisition and transition-related costs |
|
$ |
17,442 |
|
|
$ |
14,507 |
|
| Other (a) |
|
|
3,949 |
|
|
|
8,442 |
|
| |
|
$ |
21,391 |
|
|
$ |
22,949 |
|
Other losses primarily consist of costs pertaining to
a condemnation proceeding, and miscellaneous asset write-downs, net of miscellaneous gains. Other losses in 2021 also included an adjustment to a regulatory liability pertaining to the true-up of prior period tracking accounts.
| |
ALGONQUIN | LIBERTY |
| 136 |
2022 Annual Report |
Algonquin Power & Utilities Corp.
Notes to the Consolidated Financial Statements
December 31, 2022 and 2021
(in thousands of U.S. dollars, except as noted and per share amounts)
|
20. |
Basic and diluted net earnings (loss) per share |
Basic and diluted earnings per share have been
calculated on the basis of net earnings attributable to the common shareholders of the Company and the weighted average number of common shares and bonus deferral restricted share units outstanding. Diluted net earnings per share is computed using
the weighted-average number of common shares, additional shares issued subsequent to year-end under the dividend reinvestment plan, PSUs, RSUs and DSUs outstanding during the year and, if dilutive, potential incremental common shares related to the
convertible debentures or resulting from the application of the treasury stock method to outstanding share options and Green Equity Units (note 9(c)).
The reconciliation of the net earnings and the
weighted average shares used in the computation of basic and diluted earnings per share are as follows:
| |
|
2022 |
|
|
2021 |
|
| Net earnings (loss) attributable to shareholders of AQN |
|
$ |
(211,989 |
) |
|
$ |
264,859 |
|
| Preferred shares, Series A dividend |
|
|
4,786 |
|
|
|
4,942 |
|
| Preferred shares, Series D dividend |
|
|
3,934 |
|
|
|
4,061 |
|
| Net earnings (loss) attributable to common shareholders of AQN – basic and diluted |
|
$ |
(220,709 |
) |
|
$ |
255,856 |
|
| Weighted average number of shares |
|
|
|
|
|
|
|
|
| Basic |
|
|
677,862,207 |
|
|
|
622,347,677 |
|
| Effect of dilutive securities |
|
|
— |
|
|
|
6,600,185 |
|
| Diluted |
|
|
677,862,207 |
|
|
|
628,947,862 |
|
This calculation of diluted shares excludes the
potential impact of the Green Equity Units and all potential incremental shares that may become issuable pursuant to outstanding securities of the Company for the year ended December 31, 2022, as they are antidilutive. The common shares potentially
issuable for the year ended December 31, 2021, as a result of 437,006 share options are excluded from this calculation as they are anti-dilutive.
| Notes to the Consolidated Financial Statements |
137 |
Algonquin Power & Utilities Corp.
Notes to the Consolidated Financial Statements
December 31, 2022 and 2021
(in thousands of U.S. dollars, except as noted and per share amounts)
|
21. |
Segmented information |
The Company is managed under two primary business
units consisting of the Regulated Services Group and the Renewable Energy Group. The two business units are the two segments of the Company.
The Regulated Services Group, the Company’s
regulated operating unit, owns and operates a portfolio of electric, water distribution and wastewater collection, and natural gas utility systems and transmission operations in the United States, Canada, Bermuda and Chile; the Renewable Energy
Group, the Company’s non-regulated operating unit, owns and operates, or has investments in, a diversified portfolio of renewable and thermal energy generation assets.
For purposes of evaluating the performance of the
business units, the Company allocates the realized portion of any gains or losses on financial instruments to the specific business units. Dividend income from Atlantica and AYES Canada are included in the operations of the Renewable Energy Group,
while interest income from SAWS is included in the operations of the Regulated Services Group. Equity method gains and losses are included in the operations of the Regulated Services Group or Renewable Energy Group based on the nature of the
activities of the investees. The change in value of investments carried at fair value and unrealized portion of any gains or losses on derivative instruments not designated in a hedging relationship are not considered in management’s evaluation of
divisional performance and are therefore allocated and reported under corporate.
| |
|
Year ended December 31, 2022 |
|
| |
|
|
|
| |
|
Regulated
Services Group |
|
|
Renewable
Energy Group |
|
|
Corporate |
|
|
Total |
|
| Revenue (1)(2) |
|
$ |
2,328,536 |
|
|
$ |
350,939 |
|
|
$ |
— |
|
|
$ |
2,679,475 |
|
| Other revenue |
|
|
55,732 |
|
|
|
28,447 |
|
|
|
1,501 |
|
|
|
85,680 |
|
| Fuel, power and water purchased |
|
|
824,670 |
|
|
|
41,826 |
|
|
|
— |
|
|
|
866,496 |
|
| Net revenue |
|
|
1,559,598 |
|
|
|
337,560 |
|
|
|
1,501 |
|
|
|
1,898,659 |
|
| Operating expenses |
|
|
736,515 |
|
|
|
114,463 |
|
|
|
511 |
|
|
|
851,489 |
|
| Administrative expenses |
|
|
46,484 |
|
|
|
26,424 |
|
|
|
7,324 |
|
|
|
80,232 |
|
| Depreciation and amortization |
|
|
317,300 |
|
|
|
137,203 |
|
|
|
1,017 |
|
|
|
455,520 |
|
| Asset impairment expense |
|
|
— |
|
|
|
159,568 |
|
|
|
— |
|
|
|
159,568 |
|
| Loss on foreign exchange |
|
|
— |
|
|
|
— |
|
|
|
13,833 |
|
|
|
13,833 |
|
| |
|
|
459,299 |
|
|
|
(100,098 |
) |
|
|
(21,184 |
) |
|
|
338,017 |
|
| Gain on sale of renewable assets |
|
|
— |
|
|
|
64,028 |
|
|
|
— |
|
|
|
64,028 |
|
| Operating income (loss) |
|
|
459,299 |
|
|
|
(36,070 |
) |
|
|
(21,184 |
) |
|
|
402,045 |
|
| Interest expense |
|
|
(113,482 |
) |
|
|
(64,285 |
) |
|
|
(100,807 |
) |
|
|
(278,574 |
) |
| Income (loss) from long-term investments |
|
|
21,884 |
|
|
|
15,254 |
|
|
|
(502,344 |
) |
|
|
(465,206 |
) |
| Other |
|
|
(14,765 |
) |
|
|
(570 |
) |
|
|
(12,598 |
) |
|
|
(27,933 |
) |
| Earnings (loss) before income taxes |
|
$ |
352,936 |
|
|
$ |
(85,671 |
) |
|
$ |
(636,933 |
) |
|
$ |
(369,668 |
) |
| Property, plant and equipment |
|
$ |
8,554,938 |
|
|
$ |
3,360,687 |
|
|
$ |
29,260 |
|
|
$ |
11,944,885 |
|
| Investments carried at fair value |
|
|
1,984 |
|
|
|
1,342,223 |
|
|
|
— |
|
|
|
1,344,207 |
|
| Equity-method investees |
|
|
56,199 |
|
|
|
310,103 |
|
|
|
15,500 |
|
|
|
381,802 |
|
| Total assets |
|
|
12,109,575 |
|
|
|
5,251,933 |
|
|
|
266,105 |
|
|
|
17,627,613 |
|
| Capital expenditures |
|
$ |
908,676 |
|
|
$ |
180,348 |
|
|
$ |
— |
|
|
$ |
1,089,024 |
|
(1) Renewable Energy Group revenue includes $63,717 related to net hedging loss from energy derivative contracts and availability credits for the year ended December 31,
2022 that do not represent revenue recognized from contracts with customers.
(2) Regulated Services Group revenue includes $21,640 related to alternative revenue programs for the year ended December 31, 2022 that do not represent revenue recognized
from contracts with customers.
| |
ALGONQUIN | LIBERTY |
| 138 |
2022 Annual Report |
Algonquin Power & Utilities Corp.
Notes to the Consolidated Financial Statements
December 31, 2022 and 2021
(in thousands of U.S. dollars, except as noted and per share amounts)
|
21. |
Segmented information (continued) |
| |
|
Year ended December 31, 2021 |
|
| |
|
Regulated
Services Group |
|
|
Renewable
Energy Group |
|
|
Corporate |
|
|
Total |
|
| Revenue (1)(2) |
|
$ |
1,944,171 |
|
|
$ |
256,633 |
|
|
$ |
— |
|
|
$ |
2,200,804 |
|
| Other revenue |
|
|
53,441 |
|
|
|
18,339 |
|
|
|
1,558 |
|
|
|
73,338 |
|
| Fuel and power purchased |
|
|
682,602 |
|
|
|
31,313 |
|
|
|
— |
|
|
|
713,915 |
|
| Net revenue |
|
|
1,315,010 |
|
|
|
243,659 |
|
|
|
1,558 |
|
|
|
1,560,227 |
|
| Operating expenses |
|
|
597,850 |
|
|
|
104,262 |
|
|
|
16 |
|
|
|
702,128 |
|
| Administrative expenses |
|
|
37,179 |
|
|
|
28,298 |
|
|
|
1,249 |
|
|
|
66,726 |
|
| Depreciation and amortization |
|
|
280,452 |
|
|
|
121,414 |
|
|
|
1,097 |
|
|
|
402,963 |
|
| Loss on foreign exchange |
|
|
— |
|
|
|
— |
|
|
|
4,371 |
|
|
|
4,371 |
|
| |
|
|
399,529 |
|
|
|
(10,315 |
) |
|
|
(5,175 |
) |
|
|
384,039 |
|
| Gain on sale of renewable assets |
|
|
— |
|
|
|
29,063 |
|
|
|
— |
|
|
|
29,063 |
|
| Operating income (loss) |
|
|
399,529 |
|
|
|
18,748 |
|
|
|
(5,175 |
) |
|
|
413,102 |
|
| Interest expense |
|
|
(93,411 |
) |
|
|
(71,598 |
) |
|
|
(44,545 |
) |
|
|
(209,554 |
) |
| Income (loss) from long-term investments |
|
|
18,306 |
|
|
|
84,046 |
|
|
|
(128,809 |
) |
|
|
(26,457 |
) |
| Other |
|
|
(24,177 |
) |
|
|
(2,956 |
) |
|
|
(7,726 |
) |
|
|
(34,859 |
) |
| Earnings (loss) before income taxes |
|
$ |
300,247 |
|
|
$ |
28,240 |
|
|
$ |
(186,255 |
) |
|
$ |
142,232 |
|
| Property, plant and equipment |
|
$ |
7,394,151 |
|
|
$ |
3,615,915 |
|
|
$ |
32,380 |
|
|
$ |
11,042,446 |
|
| Investments carried at fair value |
|
|
2,296 |
|
|
|
1,846,160 |
|
|
|
— |
|
|
|
1,848,456 |
|
| Equity-method investees |
|
|
37,492 |
|
|
|
375,460 |
|
|
|
20,898 |
|
|
|
433,850 |
|
| Total assets |
|
|
10,524,466 |
|
|
|
6,123,888 |
|
|
|
149,149 |
|
|
|
16,797,503 |
|
| Capital expenditures |
|
$ |
998,855 |
|
|
$ |
338,637 |
|
|
$ |
7,553 |
|
|
$ |
1,345,045 |
|
(1) Renewable Energy Group revenue includes $57,018 related to net hedging loss from energy derivative contracts for the year ended December 31, 2021 that do not represent revenue
recognized from contracts with customers.
(2) Regulated Services Group revenue includes $19,043 related to alternative revenue programs for the year ended December 31, 2021 that do not represent revenue recognized from contracts
with customers.
The majority of non-regulated energy sales are earned
from contracts with large public utilities. The Company has sought to mitigate its credit risk by selling energy to large utilities in various North American locations. None of the utilities contribute more than 10% of total revenue.
| Notes to the Consolidated Financial Statements |
139 |
Algonquin Power & Utilities Corp.
Notes to the Consolidated Financial Statements
December 31, 2022 and 2021
(in thousands of U.S. dollars, except as noted and per share amounts)
|
21. |
Segmented information (continued) |
AQN operates in the independent power and utility
industries in the United States, Canada and other regions. Information on operations by geographic area is as follows:
| |
|
2022 |
|
|
2021 |
|
| Revenue |
|
|
|
|
|
|
|
|
| United States |
|
$ |
2,232,959 |
|
|
$ |
1,790,539 |
|
| Canada |
|
|
175,005 |
|
|
|
157,854 |
|
| Other regions |
|
|
357,191 |
|
|
|
325,749 |
|
| |
|
$ |
2,765,155 |
|
|
$ |
2,274,142 |
|
| Property, plant and equipment |
|
|
|
|
|
|
|
|
| United States |
|
$ |
10,351,736 |
|
|
$ |
9,464,716 |
|
| Canada |
|
|
848,560 |
|
|
|
882,454 |
|
| Other regions |
|
|
744,589 |
|
|
|
695,276 |
|
| |
|
$ |
11,944,885 |
|
|
$ |
11,042,446 |
|
| Intangible assets |
|
|
|
|
|
|
|
|
| United States |
|
$ |
18,818 |
|
|
$ |
23,575 |
|
| Canada |
|
|
19,038 |
|
|
|
21,780 |
|
| Other regions |
|
|
58,827 |
|
|
|
59,761 |
|
| |
|
$ |
96,683 |
|
|
$ |
105,116 |
|
Revenue is attributed to the regions based on the location of the
underlying generating and utility facilities.
| |
ALGONQUIN | LIBERTY |
| 140 |
2022 Annual Report |
Algonquin Power & Utilities Corp.
Notes to the Consolidated Financial Statements
December 31, 2022 and 2021
(in thousands of U.S. dollars, except as noted and per share amounts)
|
22. |
Commitments and contingencies |
AQN and its subsidiaries are involved in various
claims and litigation arising out of the ordinary course and conduct of its business. Although such matters cannot be predicted with certainty, management does not consider AQN’s exposure to such litigation to be material to these consolidated
financial statements. Accruals for any contingencies related to these items are recorded in the consolidated financial statements at the time it is concluded that its occurrence is probable and the related liability is estimable.
Condemnation expropriation proceedings
On January 7, 2016, the Town of Apple Valley filed a
lawsuit seeking to condemn the utility assets of Liberty Utilities (Apple Valley Ranchos Water) Corp. (“Liberty Apple Valley”). On May 7, 2021, the Court issued a Tentative Statement of Decision denying the Town of Apple Valley’s attempt to take the
Apple Valley Water System by eminent domain. The ruling confirmed that Liberty Apple Valley’s continued ownership and operation of the water system is in the best interest of the community. On October 14, 2021, the Court issued the Final Statement of
Decision. The Court signed and entered an Order of Dismissal and Judgment on November 12, 2021. On January 7, 2022, the Town filed a notice of appeal of the judgment entered by the Court. On August 2, 2022, the Court issued a ruling awarding Liberty
Apple Valley approximately $13,222 in attorney’s fees and litigation costs. The Town filed a notice of appeal of the fee award on August 22, 2022. The Town’s appeal of the condemnation judgment and fee award have been consolidated into one appellate
docket. The Company has not recorded the possible recovery of these attorney’s fees and litigation costs.
Mountain View fire
On November 17, 2020, a wildfire now known as the
Mountain View Fire occurred in the territory of Liberty Utilities (CalPeco Electric) LLC (“Liberty CalPeco”). The cause of the fire remains under investigation, and CAL FIRE has not yet released its final report. There are currently 17 active
lawsuits that name certain subsidiaries of the Company as defendants in connection with the Mountain View Fire, as well as one non-litigation claim brought by the U.S. Department of Agriculture seeking reimbursement for alleged fire suppression
costs. Twelve lawsuits are brought by groups of individual plaintiffs alleging causes of action including negligence, inverse condemnation, nuisance, trespass, and violations of Cal. Pub. Util. Code 2106 and Cal. Health and Safety Code 13007 (one of
these twelve lawsuits also alleges the wrongful death of an individual and various subrogation claims on behalf of insurance companies). In another lawsuit, County of Mono, Antelope Valley Fire Protection District, Toiyabe Indian Health Project, and
Bridgeport Indian Colony allege similar causes of action and seek damages for fire suppression costs, law enforcement costs, property and infrastructure damage, and other costs. In four other lawsuits, insurance companies allege inverse condemnation
and negligence and seek recovery of amounts paid and to be paid to their insureds. The likelihood of success in these lawsuits cannot be reasonably predicted. Liberty CalPeco intends to vigorously defend them. The Company has wildfire liability
insurance that is expected to apply up to applicable policy limits.
In addition to the commitments related to the proposed
acquisitions and development projects disclosed in notes 3(b) and 8, the following significant commitments exist as of December 31, 2022.
AQN has outstanding purchase commitments for power
purchases, natural gas supply and service agreements, service agreements, capital project commitments and land easements.
| Notes to the Consolidated Financial Statements |
141 |
Algonquin Power & Utilities Corp.
Notes to the Consolidated Financial Statements
December 31, 2022 and 2021
(in thousands of U.S. dollars, except as noted and per share amounts)
|
22. |
Commitments and contingencies (continued) |
|
(b) |
Commitments (continued) |
Detailed below are estimates of future commitments
under these arrangements:
| |
|
Year 1 |
|
|
Year 2 |
|
|
Year 3 |
|
|
Year 4 |
|
|
Year 5 |
|
|
Thereafter |
|
|
Total |
|
| Power purchase (i) |
|
$ |
89,846 |
|
|
$ |
32,490 |
|
|
$ |
32,726 |
|
|
$ |
12,274 |
|
|
$ |
12,520 |
|
|
$ |
142,586 |
|
|
$ |
322,442 |
|
| |
|
|
|
|
|
|
|
|
|
|
|
|
|
|
|
|
|
|
|
|
|
|
|
|
|
|
|
|
| Natural gas supply and service agreements (ii) |
|
|
113,775 |
|
|
|
81,719 |
|
|
|
57,014 |
|
|
|
40,372 |
|
|
|
31,457 |
|
|
|
188,138 |
|
|
|
512,475 |
|
| |
|
|
|
|
|
|
|
|
|
|
|
|
|
|
|
|
|
|
|
|
|
|
|
|
|
|
|
|
| Service agreements |
|
|
67,477 |
|
|
|
57,886 |
|
|
|
55,835 |
|
|
|
49,596 |
|
|
|
46,511 |
|
|
|
298,516 |
|
|
|
575,821 |
|
| |
|
|
|
|
|
|
|
|
|
|
|
|
|
|
|
|
|
|
|
|
|
|
|
|
|
|
|
|
| Capital projects |
|
|
7,163 |
|
|
|
— |
|
|
|
— |
|
|
|
— |
|
|
|
— |
|
|
|
— |
|
|
|
7,163 |
|
| |
|
|
|
|
|
|
|
|
|
|
|
|
|
|
|
|
|
|
|
|
|
|
|
|
|
|
|
|
| Land easements |
|
|
13,295 |
|
|
|
13,316 |
|
|
|
13,503 |
|
|
|
13,667 |
|
|
|
13,837 |
|
|
|
463,785 |
|
|
|
531,403 |
|
| Total |
|
$ |
291,556 |
|
|
$ |
185,411 |
|
|
$ |
159,078 |
|
|
$ |
115,909 |
|
|
$ |
104,325 |
|
|
$ |
1,093,025 |
|
|
$ |
1,949,304 |
|
|
(i) |
Power purchase: AQN’s electric distribution facilities have commitments to purchase physical quantities
of power for load serving requirements. The commitment amounts included in the table above are based on market prices as of December 31, 2022. However, the effects of purchased power unit cost adjustments are mitigated through a purchased power
rate-adjustment mechanism. |
|
(ii) |
Natural gas supply and service agreements: AQN’s natural gas distribution facilities and thermal
generation facilities have commitments to purchase physical quantities of natural gas under contracts for purposes of load serving requirements and of generating power. |
|
23. |
Non-cash operating items |
The changes in non-cash operating items consist of
the following:
| |
|
2022 |
|
|
2021 |
|
| Accounts receivable |
|
$ |
(124,631 |
) |
|
$ |
(56,751 |
) |
| Fuel and natural gas in storage |
|
|
(21,140 |
) |
|
|
(43,642 |
) |
| Supplies and consumables inventory |
|
|
(24,088 |
) |
|
|
445 |
|
| Income taxes recoverable |
|
|
549 |
|
|
|
(3,025 |
) |
| Prepaid expenses |
|
|
(4,269 |
) |
|
|
(1,189 |
) |
| Accounts payable |
|
|
24,395 |
|
|
|
(33,399 |
) |
| Accrued liabilities |
|
|
127,076 |
|
|
|
31,845 |
|
| Current income tax liability |
|
|
(2,741 |
) |
|
|
4,363 |
|
| Asset retirements and environmental obligations |
|
|
(22,342 |
) |
|
|
(1,185 |
) |
| Net regulatory assets and liabilities |
|
|
(174,427 |
) |
|
|
(419,484 |
) |
| |
|
$ |
(221,618 |
) |
|
$ |
(522,022 |
) |
| |
ALGONQUIN | LIBERTY |
| 142 |
2022 Annual Report |
Algonquin Power & Utilities Corp.
Notes to the Consolidated Financial Statements
December 31, 2022 and 2021
(in thousands of U.S. dollars, except as noted and per share amounts)
|
24. |
Financial instruments |
|
(a) |
Fair value of financial instruments |
| |
|
Carrying |
|
|
Fair |
|
|
|
|
|
|
|
|
|
|
| December 31, 2022 |
|
amount |
|
|
value |
|
|
Level 1 |
|
|
Level 2 |
|
|
Level 3 |
|
| Long-term investments carried at fair value |
|
$ |
1,344,207 |
|
|
$ |
1,344,207 |
|
|
$ |
1,270,138 |
|
|
$ |
— |
|
|
$ |
74,083 |
|
| Development loans and other receivables |
|
|
53,680 |
|
|
|
50,300 |
|
|
|
— |
|
|
|
50,300 |
|
|
|
— |
|
| Derivative instruments: |
|
|
|
|
|
|
|
|
|
|
|
|
|
|
|
|
|
|
|
|
| Energy contracts not designated as cash flow hedge |
|
|
393 |
|
|
|
393 |
|
|
|
— |
|
|
|
— |
|
|
|
393 |
|
| Interest rate swap designated as a hedge |
|
|
69,188 |
|
|
|
69,188 |
|
|
|
— |
|
|
|
69,188 |
|
|
|
— |
|
| Interest rate cap not designated as a hedge |
|
|
2,659 |
|
|
|
2,659 |
|
|
|
— |
|
|
|
2,659 |
|
|
|
— |
|
| Congestion revenue rights not designated as a cash flow hedge |
|
|
10,110 |
|
|
|
10,110 |
|
|
|
— |
|
|
|
— |
|
|
|
10,110 |
|
| Cross currency swap designated as a net investment hedge |
|
|
1,267 |
|
|
|
1,267 |
|
|
|
— |
|
|
|
1,267 |
|
|
|
— |
|
| Commodity contracts for regulated operations |
|
|
283 |
|
|
|
283 |
|
|
|
— |
|
|
|
283 |
|
|
|
— |
|
| Total derivative instruments |
|
|
83,900 |
|
|
|
83,900 |
|
|
|
— |
|
|
|
73,397 |
|
|
|
10,503 |
|
| Total financial assets |
|
$ |
1,481,787 |
|
|
$ |
1,478,407 |
|
|
$ |
1,270,138 |
|
|
$ |
123,697 |
|
|
$ |
84,586 |
|
| Long-term debt |
|
$ |
7,512,017 |
|
|
$ |
6,699,031 |
|
|
$ |
2,623,628 |
|
|
$ |
4,075,403 |
|
|
$ |
— |
|
| Notes payable to related |
|
|
25,808 |
|
|
|
15,180 |
|
|
|
— |
|
|
|
15,180 |
|
|
|
— |
|
| Convertible debentures |
|
|
245 |
|
|
|
276 |
|
|
|
276 |
|
|
|
— |
|
|
|
— |
|
| Preferred shares, Series C |
|
|
12,072 |
|
|
|
11,675 |
|
|
|
— |
|
|
|
11,675 |
|
|
|
— |
|
| Derivative instruments: |
|
|
|
|
|
|
|
|
|
|
|
|
|
|
|
|
|
|
|
|
| Energy contracts designated as a cash flow hedge |
|
|
120,284 |
|
|
|
120,284 |
|
|
|
— |
|
|
|
— |
|
|
|
120,284 |
|
| Energy contracts not designated as a cash flow hedge |
|
|
8,617 |
|
|
|
8,617 |
|
|
|
— |
|
|
|
— |
|
|
|
8,617 |
|
| Cross-currency swap designated as a net investment hedge |
|
|
24,371 |
|
|
|
24,371 |
|
|
|
— |
|
|
|
24,371 |
|
|
|
— |
|
| Cross currency swap designated as a cash flow hedge |
|
|
15,435 |
|
|
|
15,435 |
|
|
|
— |
|
|
|
15,435 |
|
|
|
— |
|
| Commodity contracts for regulated operations |
|
|
1,614 |
|
|
|
1,614 |
|
|
|
— |
|
|
|
1,614 |
|
|
|
— |
|
| Total derivative instruments |
|
|
170,321 |
|
|
|
170,321 |
|
|
|
— |
|
|
|
41,420 |
|
|
|
128,901 |
|
| Total financial liabilities |
|
$ |
7,720,463 |
|
|
$ |
6,896,483 |
|
|
$ |
2,623,904 |
|
|
$ |
4,143,678 |
|
|
$ |
128,901 |
|
| Notes to the Consolidated Financial Statements |
143 |
Algonquin Power & Utilities Corp.
Notes to the Consolidated Financial Statements
December 31, 2022 and 2021
(in thousands of U.S. dollars, except as noted and per share amounts)
|
24. |
Financial instruments (continued) |
|
(a) |
Fair value of financial instruments (continued) |
| |
|
Carrying |
|
|
Fair |
|
|
|
|
|
|
|
|
|
|
| December 31, 2021 |
|
amount |
|
|
value |
|
|
Level 1 |
|
|
Level 2 |
|
|
Level 3 |
|
| Long-term investment |
|
|
|
|
|
|
|
|
|
|
|
|
|
|
|
|
|
|
|
|
| carried at fair value |
|
$ |
1,848,456 |
|
|
$ |
1,848,456 |
|
|
$ |
1,753,210 |
|
|
$ |
— |
|
|
$ |
95,246 |
|
| Development loans and |
|
|
|
|
|
|
|
|
|
|
|
|
|
|
|
|
|
|
|
|
| other receivables |
|
|
32,261 |
|
|
|
33,286 |
|
|
|
— |
|
|
|
33,286 |
|
|
|
— |
|
| Derivative instruments: |
|
|
|
|
|
|
|
|
|
|
|
|
|
|
|
|
|
|
|
|
| Energy contracts designated as a cash flow hedge |
|
|
15,362 |
|
|
|
15,362 |
|
|
|
— |
|
|
|
— |
|
|
|
15,362 |
|
| Interest rate swap designated as a hedge |
|
|
1,581 |
|
|
|
1,581 |
|
|
|
— |
|
|
|
1,581 |
|
|
|
— |
|
| Cross-currency swap designated as a net investment hedge |
|
|
1,958 |
|
|
|
1,958 |
|
|
|
— |
|
|
|
1,958 |
|
|
|
— |
|
| Commodity contracts for regulated operations |
|
|
1,721 |
|
|
|
1,721 |
|
|
|
— |
|
|
|
1,721 |
|
|
|
— |
|
| Total derivative instruments |
|
|
20,622 |
|
|
|
20,622 |
|
|
|
— |
|
|
|
5,260 |
|
|
|
15,362 |
|
| Total financial assets |
|
$ |
1,901,339 |
|
|
$ |
1,902,364 |
|
|
$ |
1,753,210 |
|
|
$ |
38,546 |
|
|
$ |
110,608 |
|
| Long-term debt |
|
$ |
6,211,375 |
|
|
$ |
6,543,933 |
|
|
$ |
2,418,580 |
|
|
$ |
4,125,352 |
|
|
$ |
— |
|
| Notes payable to related party |
|
|
25,808 |
|
|
|
25,808 |
|
|
|
— |
|
|
|
25,808 |
|
|
|
— |
|
| Convertible debentures |
|
|
277 |
|
|
|
519 |
|
|
|
519 |
|
|
|
— |
|
|
|
— |
|
| Preferred shares, Series C |
|
|
13,348 |
|
|
|
14,580 |
|
|
|
— |
|
|
|
14,580 |
|
|
|
— |
|
| Derivative instruments: |
|
|
|
|
|
|
|
|
|
|
|
|
|
|
|
|
|
|
|
|
| Energy contracts designated as a cash flow hedge |
|
|
60,462 |
|
|
|
60,462 |
|
|
|
— |
|
|
|
— |
|
|
|
60,462 |
|
| Energy contracts not designated as a cash flow hedge |
|
|
1,169 |
|
|
|
1,169 |
|
|
|
— |
|
|
|
— |
|
|
|
1,169 |
|
| Cross-currency swap designated as a net investment hedge |
|
|
50,258 |
|
|
|
50,258 |
|
|
|
— |
|
|
|
50,258 |
|
|
|
— |
|
| Interest rate swaps designated as a hedge |
|
|
7,008 |
|
|
|
7,008 |
|
|
|
— |
|
|
|
7,008 |
|
|
|
— |
|
| Commodity contracts for regulated operations |
|
|
1,348 |
|
|
|
1,348 |
|
|
|
— |
|
|
|
1,348 |
|
|
|
— |
|
| Total derivative instruments |
|
|
120,245 |
|
|
|
120,245 |
|
|
|
— |
|
|
|
58,614 |
|
|
|
61,631 |
|
| Total financial liabilities |
|
$ |
6,371,053 |
|
|
$ |
6,705,085 |
|
|
$ |
2,419,099 |
|
|
$ |
4,224,354 |
|
|
$ |
61,631 |
|
The Company has determined that the carrying value of its short-term financial assets and liabilities approximates fair value
as of December 31, 2022 and 2021 due to the short-term maturity of these instruments.
Algonquin Power & Utilities Corp.
Notes to the Consolidated Financial Statements
December 31, 2022 and 2021
(in thousands of U.S. dollars, except as noted and per share amounts)
|
24. |
Financial instruments (continued) |
|
(a) |
Fair value of financial instruments (continued) |
The fair value of the investment in Atlantica (level 1) is measured at the closing price on the NASDAQ stock exchange.
The fair value of development loans and other receivables (level 2) is determined using a discounted cash flow method, using
estimated current market rates for similar instruments adjusted for estimated credit risk as determined by management.
The Company’s level 1 fair value of long-term debt is measured at the closing price on the NYSE and the Canadian
over-the-counter closing price. The Company’s level 2 fair value of long-term debt at fixed interest rates, notes payable to related party and preferred shares Series C has been determined using a discounted cash flow method and current interest rates.
The Company’s level 2 fair value of convertible debentures has been determined as the greater of their face value and the quoted value of AQN’s common shares on a converted basis.
The Company’s level 2 fair value derivative instruments primarily consist of swaps, options, rights, caps, subscription
agreements and forward physical derivatives where market data for pricing inputs are observable. Level 2 pricing inputs are obtained from various market indices and utilize discounting based on quoted interest rate curves, which are observable in the
marketplace.
The Company’s level 3 instruments consist of energy contracts for electricity sales, congestion revenue rights (“CRRs”) and the
fair value of the Company’s investment in AYES Canada. The significant unobservable inputs used in the fair value measurement of energy contracts are the internally developed forward market prices ranging from $23.32 to $109.91 with a weighted average
of $44.76 as of December 31, 2022. The weighted average forward market prices are developed based on the quantity of energy expected to be sold monthly and the expected forward price during that month. The change in the fair value of the energy
contracts is detailed in notes 24(b)(ii) and 24(b)(iv). The significant unobservable inputs used in the fair value measurement of CRRs are recent CRR auction prices ranging from $nil to $23.20 with a weighted average of $7.83 as at December 31, 2022.
The fair value of the investment in AYES Canada is determined using a discounted cash flow approach combined with a binomial tree approach. The significant unobservable inputs used in the fair value measurement of the Company’s AYES Canada investment
are the expected cash flows, the discount rates applied to these cash flows ranging from 8.00% to 8.50% with a weighted average of 8.34%, and the expected volatility of Atlantica’s share price ranging from 26.99% to 34.89% as of December 31, 2022.
Significant increases (decreases) in expected cash flows or increases (decreases) in discount rate in isolation would have resulted in a significantly lower (higher) fair value measurement.
|
(b) |
Derivative instruments |
Derivative instruments are recognized on the consolidated balance sheets as either assets or liabilities and measured at fair
value at each reporting period.
|
(i) |
Commodity derivatives – regulated accounting |
The Company uses derivative financial instruments to reduce the cash flow variability associated with the purchase price for a
portion of future natural gas purchases associated with its regulated natural gas and electric service territories. The Company’s strategy is to minimize fluctuations in natural gas sale prices to regulated customers.
The following are commodity volumes, in dekatherms (“dths”), associated with the above derivative contracts:
| |
2022 |
|
| Financial contracts: |
Swaps |
1,687,217 |
|
| |
Options |
35,824 |
|
| |
1,723,041 |
|
| Notes to the Consolidated Financial Statements |
145 |
Algonquin Power & Utilities Corp.
Notes to the Consolidated Financial Statements
December 31, 2022 and 2021
(in thousands of U.S. dollars, except as noted and per share amounts)
|
24. |
Financial instruments (continued) |
|
(b) |
Derivative instruments (continued) |
|
(i) |
Commodity derivatives – regulated accounting (continued) |
The accounting for these derivative instruments is subject to guidance for rate regulated enterprises. Therefore, the fair
value of these derivatives is recorded as current or long-term assets and liabilities, with offsetting positions recorded as regulatory assets and regulatory liabilities in the consolidated balance sheets. Most of the gains or losses on the settlement
of these contracts are included in the calculation of the fuel and commodity costs adjustments (note 7(a)). As a result, the changes in fair value of these natural gas derivative contracts and their offsetting adjustment to regulatory assets and
liabilities had no earnings impact.
The Company reduces the price risk on the expected future sale of power generation by entering into the following long-term
energy derivative contracts. Upon the acquisition of the Sugar Creek Wind Facility in 2021 (note 3(f)), the Company redesignated a long-term energy derivative contract to mitigate the price risk on the expected future sale of power generation. The fair
value of the derivative on the redesignation date will be amortized into earnings over the remaining life of the contract.
|
Notional quantity
(MW-hrs)
|
Expiry |
Receive average
prices (per MW-hr)
|
Pay floating price
(per MW-hr)
|
| 4,059,905 |
September 2030 |
$24.54 |
Illinois Hub |
| 413,620 |
December 2028 |
$29.15 |
PJM Western HUB |
| 1,977,766 |
December 2027 |
$22.05 |
NI HUB |
| 1,665,318 |
December 2027 |
$36.46 |
ERCORT North HUB |
The Company is party to two interest rate swap contracts as cash flow hedges to mitigate the risk that interest rates will
increase over the life of certain term loan facilities. Under the terms of the interest rate swap contracts, the Company has fixed its interest rate expense on such term loan facilities. The fair value of the derivative on the designation date is
amortized into earnings over the remaining life of the contract.
The Company is party to a forward-starting interest rate swap in order to reduce the interest rate risk related to the
quarterly interest payments between July 1, 2024 and July 1, 2029 on the $350,000 subordinated unsecured notes. The Company designated the entire notional amount of the pay-variable and receive-fixed interest rate swaps as a hedge of the future
quarterly variable-rate interest payments associated with the subordinated unsecured notes.
In January 2022, the Company entered into a cross-currency interest rate swap, coterminous with the Canadian Notes, to
effectively convert the C$400,000 Canadian Offering into U.S. dollars. The change in the carrying amount of the Canadian Notes due to changes in spot exchange rates is recognized each period in the consolidated statements of operations as loss (gain)
on foreign exchange. The Company designated the entire notional amount of the cross-currency fixed-for-fixed interest rate swap as a hedge of the foreign currency exposure related to cash flows for the interest and principal repayments on the Canadian
Notes. An offsetting portion of the AOCI balance related to changes in fair value of the cross-currency fixed-for-fixed interest rate swap attributable to changes in the spot exchange rates is also immediately reclassified into the consolidated
statements of operations as an offsetting (gain) loss on foreign exchange.
Algonquin Power & Utilities Corp.
Notes to the Consolidated Financial Statements
December 31, 2022 and 2021
(in thousands of U.S. dollars, except as noted and per share amounts)
|
24. |
Financial instruments (continued) |
|
(b) |
Derivative instruments (continued) |
|
(ii) |
Cash flow hedges (continued) |
The following table summarizes OCI attributable to derivative financial instruments designated as a cash flow hedge:
| |
|
2022 |
|
|
2021 |
|
| Effective portion of cash flow hedge |
|
$ |
(128,838 |
) |
|
$ |
(97,103 |
) |
| Amortization of cash flow hedge |
|
|
(12,180 |
) |
|
|
(2,132 |
) |
| Amounts reclassified from AOCI |
|
|
46,723 |
|
|
|
44,904 |
|
| OCI attributable to shareholders of AQN |
|
$ |
(94,295 |
) |
|
$ |
(54,331 |
) |
The Company expects $32,467 of unrealized losses currently in AOCI to be reclassified, net of taxes into non-regulated energy
sales, investment loss, interest expense and derivative gains, respectively, within the next 12 months, as the underlying hedged transactions settle.
|
(iii) |
Foreign exchange hedge of net investment in foreign operation |
The functional currency of most of AQN’s operations is the U.S. dollar. The Company designates obligations denominated in
Canadian dollars as a hedge of the foreign currency exposure of its net investment in its Canadian investments and subsidiaries. The related foreign currency transaction gain or loss designated as, and effective as, a hedge of the net investment in a
foreign operation is reported in the same manner as the translation adjustment (in OCI) related to the net investment. A foreign currency gain of $2,262 for the year ended December 31, 2022 (2021 - loss of $168) was recorded in OCI.
On May 23, 2019, the Company entered into a cross-currency swap, coterminous with the subordinated unsecured notes issued on
such date, to effectively convert the $350,000 U.S. dollar denominated offering into Canadian dollars. The change in the carrying amount of the notes due to changes in spot exchange rates is recognized each period in the consolidated statements of
operations as loss (gain) on foreign exchange. The Company designated the entire notional amount of the cross-currency fixed-for-fixed interest rate swap as a hedge of the foreign currency exposure related to cash flows for the interest and principal
repayments on the notes. Upon the change in functional currency of AQN to the U.S. dollar on January 1, 2020, this hedge was dedesignated. The OCI related to this hedge will be amortized into earnings in the period that future interest payments affect
earnings over the remaining life of the original hedge. The Company redesignated this swap as a hedge of AQN’s net investment in its Canadian subsidiaries.
The related foreign currency transaction gain or loss designated as a hedge of the net investment in a foreign operation is
reported in the same manner as the translation adjustment (in OCI) related to the net investment. The fair value of the derivative on the redesignation date will be amortized over the remaining life of the original hedge. A foreign currency gain of
$22,091 for the year ended December 31, 2022 (2021 - loss of $4,232 was recorded in OCI).
Canadian operations
The Company is exposed to currency fluctuations from its Canadian-based operations. AQN manages this risk primarily through the
use of natural hedges by using Canadian long-term debt to finance its Canadian operations and a combination of foreign exchange forward contracts and spot purchases.
The Company’s Canadian operations are determined to have the Canadian dollar as their functional currency and are exposed to
currency fluctuations from their U.S. dollar transactions. The Company designates obligations denominated in U.S. dollars as a hedge of the foreign currency exposure of its net investment in its U.S. investments and subsidiaries. The related foreign
currency transaction gain or loss designated as, and effective as, a hedge of the net investment in a foreign operation is reported in the same manner as the translation adjustment (in OCI) related to the net investment. A foreign currency loss of
$18,561 for the year ended December 31, 2022 (2021 - gain of $1,595) was recorded in OCI.
| Notes to the Consolidated Financial Statements |
147 |
Algonquin Power & Utilities Corp.
Notes to the Consolidated Financial Statements
December 31, 2022 and 2021
(in thousands of U.S. dollars, except as noted and per share amounts)
|
24. |
Financial instruments (continued) |
|
(b) |
Derivative instruments (continued) |
|
(iii) |
Foreign exchange hedge of net investment in foreign operation (continued) |
Canadian operations (continued)
The Company is party to C $300,000 (December 31, 2021 - $500,000) fixed-for-fixed cross-currency cross currency swaps to
effectively convert Canadian dollar debentures into U.S. dollars. In February 2022, the Company settled the cross-currency swap related to its C$200,000 (2021 - C$150,000) debenture that was repaid. The Company designated the entire notional amount of
the cross-currency fixed-for-fixed interest rate swap and related short-term U.S. dollar payables created by the monthly accruals of the swap settlement as a hedge of the foreign currency exposure of its net investment in the Renewable Energy Group’s
U.S. operations. The gain or loss related to the fair value changes of the swap and the related foreign currency gains and losses on the U.S. dollar accruals that are designated as, and are effective as, a hedge of the net investment in a foreign
operation are reported in the same manner as the translation adjustment (in OCI) related to the net investment. A loss of $11,082 for the year ended December 31, 2022 (2021 - gain of $7,824) was recorded in OCI.
On April 9, 2021, the Renewable Energy Group entered into a fixed-for-fixed cross-currency interest rate swap, coterminous with
the senior unsecured debentures issued on such date (note 9(g)), to effectively convert the C$400,000 Canadian-dollar-denominated offering into U.S. dollars. The Renewable Energy Group designated the entire notional amount of the fixed-for-fixed
cross-currency interest rate swap and related short-term U.S. dollar payables created by the monthly accruals of the swap settlement as a hedge of the foreign currency exposure of its net investment in the Renewable Energy Group’s U.S. operations. The
gain or loss related to the fair value changes of the swap and the related foreign currency gains and losses on the U.S. dollar accruals that are designated as, and are effective as, a hedge of the net investment in a foreign operation are reported in
the same manner as the translation adjustment (in OCI) related to the net investment. A loss of $13,374 for the year ended December 31, 2022 (2021 - loss of $1,925) was recorded in OCI.
Chilean operations
The Company is exposed to currency fluctuations from its Chilean-based operations. The Company’s Chilean operations are
determined to have the Chilean peso as their functional currency. Chilean long-term debt used to finance the operations is denominated in Chilean Unidad de Fomento.
|
(iv) |
Other derivatives and risk management |
In the normal course of business, the Company is exposed to financial risks that potentially impact its operating results. The
Company employs risk management strategies with a view to mitigating these risks to the extent possible on a cost-effective basis. Derivative financial instruments are used to manage certain exposures to fluctuations in exchange rates, interest rates
and commodity prices. The Company does not enter into derivative financial agreements for speculative purposes. For derivatives that are not designated as hedges, the changes in the fair value are immediately recognized in earnings.
The Company mitigates the volatility of energy congestion charges at the ERCOT transmission grid by entering into CRRs, which
as of December 31, 2022 had notional quantity of 1,328,510 MW-hours at prices ranging from $1.58 per MW-hr to $19.06 per MW-hr with a weighted average of $7.80 per MW-hr for January 2023 to April 2025. These CRRs are not designated as an accounting
hedge.
On December 17, 2022, the Company entered into an interest rate cap agreement in the amount of $390,000 for the period between
January 15, 2023 and January 15, 2024. The Company was party to an interest rate swap to mitigate the interest rate risk related to debt at its Blue Hill Wind Facility. The contract was novated upon the sale of the Blue Hill Wind Facility. The loss
recognized on the derivative was recorded as a reduction of the gain on sale of renewable assets on the consolidated statements of operations (note 3(a)).
Algonquin Power & Utilities Corp.
Notes to the Consolidated Financial Statements
December 31, 2022 and 2021
(in thousands of U.S. dollars, except as noted and per share amounts)
|
24. |
Financial instruments (continued) |
|
(b) |
Derivative instruments (continued) |
|
(iv) |
Other derivatives and risk management (continued) |
The Company mitigates the price risk on the expected future sale of power generation of one of its solar facilities through a
long-term energy derivative contract with a notional quantity of 516,202 MW-hours, a price of $25.15 per MW-hr and expiring in August 2030 as an economic hedge to the price of energy sales. The derivative contract is not designated as an accounting
hedge.
During 2021, the Company executed on currency forward contracts to manage the currency exposure to the Canadian dollar shares
issuance (note 13(a)). A foreign currency gain of $2,329 was recorded in 2021 as a result of the settlement.
The effects on the consolidated statements of operations of derivative financial instruments not designated as hedges consist
of the following:
| |
|
2022 |
|
|
2021 |
|
| Unrealized gain (loss) on derivative financial instruments: |
|
|
|
|
|
|
|
|
| Energy derivative contracts |
|
$ |
(945 |
) |
|
$ |
(5,353 |
) |
| Commodity contracts |
|
|
185 |
|
|
|
— |
|
| Total unrealized loss on derivative financial instruments |
|
$ |
(760 |
) |
|
$ |
(5,353 |
) |
| Realized gain (loss) on derivative financial instruments: |
|
|
|
|
|
|
|
|
| Energy derivative contracts |
|
$ |
6,939 |
|
|
$ |
(108 |
) |
| Currency forward contract |
|
|
— |
|
|
|
2,329 |
|
| Interest rate swaps |
|
|
(7,185 |
) |
|
|
— |
|
| Total realized gain (loss) on derivative financial instruments |
|
$ |
(246 |
) |
|
$ |
2,221 |
|
| Loss on derivative financial instruments not accounted for as hedges |
|
|
(1,006 |
) |
|
|
(3,132 |
) |
| Amortization of AOCI gains frozen as a result of hedge dedesignation |
|
|
3,465 |
|
|
|
3,712 |
|
| |
|
$ |
2,459 |
|
|
$ |
580 |
|
| Consolidated statements of operations classification: |
|
|
|
|
|
|
|
|
| Gain on derivative financial instruments |
|
$ |
4,408 |
|
|
$ |
4,403 |
|
| Gain on foreign exchange |
|
|
— |
|
|
|
2,329 |
|
| Renewable energy sales |
|
|
5,236 |
|
|
|
(6,152 |
) |
| Reduction to gain on sale of renewable assets |
|
|
(7,185 |
) |
|
|
— |
|
| |
|
$ |
2,459 |
|
|
$ |
580 |
|
| Notes to the Consolidated Financial Statements |
149 |
Algonquin Power & Utilities Corp.
Notes to the Consolidated Financial Statements
December 31, 2022 and 2021
(in thousands of U.S. dollars, except as noted and per share amounts)
|
24. |
Financial instruments (continued) |
|
(c) |
Risk management (continued) |
In addition to the risk management strategies described above, the Company manages
exposure to risks arising from financial instruments, including credit risk and liquidity risk.
Credit risk
Credit risk is the risk of an unexpected loss if a customer or counterparty to a
financial instrument fails to meet its contractual obligations. The Company’s financial instruments that are exposed to concentrations of credit risk are primarily cash and cash equivalents, accounts receivable, notes receivable and derivative
instruments. The Company limits its exposure to credit risk with respect to cash equivalents by ensuring available cash is deposited with its senior lenders, all of which have a credit rating of A or better. The Company does not consider the risk
associated with the accounts receivable to be significant as the majority of revenue from power generation is earned from large utility customers having a credit rating of Baa2 or better by Moody’s, or BBB or higher by S&P, or BBB or higher by
DBRS. Revenue is generally invoiced and collected within 45 days.
The remaining revenue is primarily earned by the Regulated Services Group, which
consists of electric, water distribution and wastewater, and natural gas utilities in the United States, Canada, Bermuda and Chile. In this regard, the credit risk related to Regulated Services Group accounts receivable balances of $404,258 is spread
over hundreds of thousands of customers. The Company has processes in place to monitor and evaluate this risk on an ongoing basis including background credit checks and security deposits from new customers. In addition, most of the Regulators of the
Regulated Services Group allow for a reasonable bad debt expense to be incorporated in the rates and therefore recovered from rate payers.
As of December 31, 2022, the Company’s maximum exposure to credit risk for these
financial instruments was as follows:
| |
|
2022 |
|
| Cash and cash equivalents and restricted cash |
|
$ |
101,185 |
|
| Accounts receivable |
|
|
552,914 |
|
| Allowance for doubtful accounts |
|
|
(24,857 |
) |
| Notes receivable |
|
|
53,680 |
|
| |
|
$ |
682,922 |
|
In addition, the Company monitors the creditworthiness of the counterparties to its
foreign exchange, interest rate, and energy derivative contracts and assesses each counterparty’s ability to perform on the transactions set forth in the contracts. The counterparties consist primarily of financial institutions. This concentration of
counterparties may impact the Company’s overall exposure to credit risk, either positively or negatively, in that the counterparties may be similarly affected by changes in economic, regulatory or other conditions.
Liquidity risk
Liquidity risk is the risk that the Company will not be able to meet its financial
obligations as they fall due. The Company’s approach to managing liquidity risk is to take steps to ensure, to the extent possible, that it will have sufficient liquidity to meet liabilities when due. As of December 31, 2022, in addition to cash on
hand of $57,623, the Company had $2,288,765 available to be drawn on its revolving and term credit facilities. Each of the Company’s revolving credit facilities contain covenants that may limit amounts available to be drawn.
ALGONQUIN | LIBERTY
Algonquin Power & Utilities Corp.
Notes to the Consolidated Financial Statements
December 31, 2022 and 2021
(in thousands of U.S. dollars, except as noted and per share amounts)
|
24. |
Financial instruments (continued) |
|
(c) |
Risk management (continued) |
Liquidity risk (continued)
The Company’s liabilities mature as follows:
| |
|
Due less |
|
|
Due 2 to 3 |
|
|
Due 4 to 5 |
|
|
Due after |
|
|
|
|
| |
|
than 1 year |
|
|
years |
|
|
years |
|
|
5 years |
|
|
Total |
|
| Long-term debt obligations |
|
$ |
1,128,660 |
|
|
$ |
404,633 |
|
|
$ |
1,984,855 |
|
|
$ |
4,019,166 |
|
|
$ |
7,537,314 |
|
| Interest on long-term debt |
|
|
310,863 |
|
|
|
447,227 |
|
|
|
386,560 |
|
|
|
3,936,205 |
|
|
|
5,080,855 |
|
| Purchase obligations |
|
|
741,888 |
|
|
|
— |
|
|
|
— |
|
|
|
— |
|
|
|
741,888 |
|
| Environmental obligation |
|
|
9,326 |
|
|
|
18,084 |
|
|
|
1,915 |
|
|
|
19,021 |
|
|
|
48,346 |
|
| Advances in aid of construction |
|
|
1,554 |
|
|
|
— |
|
|
|
— |
|
|
|
86,992 |
|
|
|
88,546 |
|
| Derivative financial instruments: |
|
|
|
|
|
|
|
|
|
|
|
|
|
|
|
|
|
|
|
|
| Cross-currency swap |
|
|
3,205 |
|
|
|
5,541 |
|
|
|
6,279 |
|
|
|
24,781 |
|
|
|
39,806 |
|
| |
|
|
|
|
|
|
|
|
|
|
|
|
|
|
|
|
|
|
|
|
| Energy derivative and commodity contracts |
|
|
29,286 |
|
|
|
49,865 |
|
|
|
29,896 |
|
|
|
21,468 |
|
|
|
130,515 |
|
| Contract adjustment payments on Green Equity Units |
|
|
76,208 |
|
|
|
37,668 |
|
|
|
— |
|
|
|
— |
|
|
|
113,876 |
|
| Other obligations |
|
|
37,209 |
|
|
|
6,392 |
|
|
|
5,080 |
|
|
|
271,962 |
|
|
|
320,643 |
|
| Total obligations |
|
$ |
2,338,199 |
|
|
$ |
969,410 |
|
|
$ |
2,414,585 |
|
|
$ |
8,379,595 |
|
|
$ |
14,101,789 |
|
Certain of the comparative figures have been reclassified to conform to the
consolidated financial statement presentation adopted in the current year.
| Notes to the Consolidated Financial Statements |
151 |

ALGONQUIN | LIBERTY

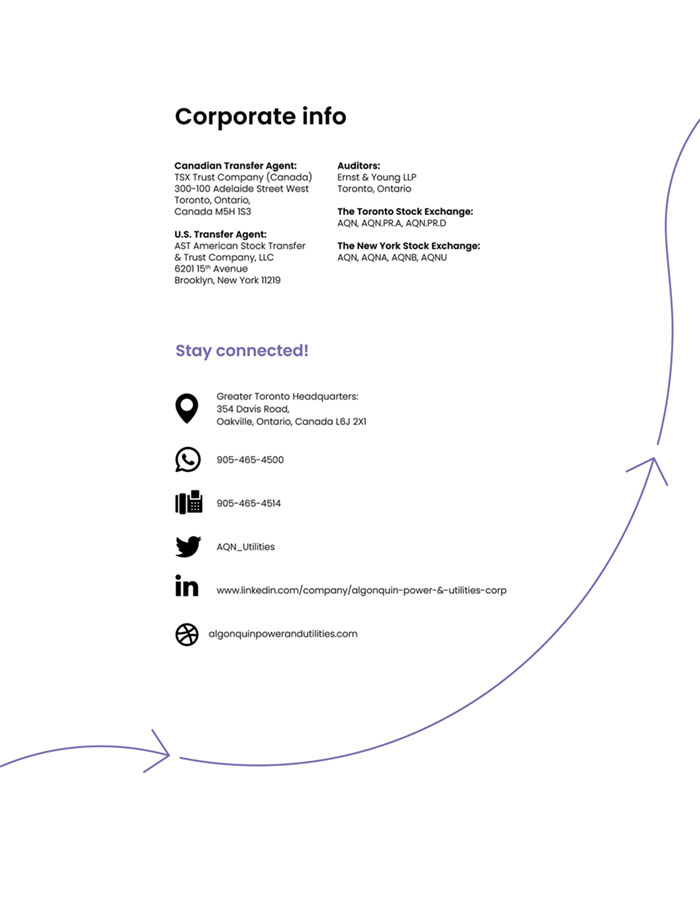
Algonquin Power and Util... (PK) (USOTC:AGQPF)
Historical Stock Chart
From Apr 2024 to May 2024
 Charts.")
Algonquin Power and Util... (PK) (USOTC:AGQPF)
Historical Stock Chart
From May 2023 to May 2024
 Charts.")