AMERICAN BUSINESS BANK (Bank) (OTCBB: AMBZ) today reported net
income of $3,043,000 for the second quarter of 2014. Earnings per
share (basic) in the second quarter of 2014 were $0.61 versus $0.74
in the second quarter of 2013. During the second quarter of 2013,
the Bank was able to realize gains from its securities portfolio to
add to capital. After adjusting results for securities gains on an
after-tax basis, “core” earnings per share increased 66% to $0.59
in the second quarter of 2014 versus $0.35 in the second quarter of
2013.
“The second quarter continued to be one of growth for the Bank
as we successfully added new relationship customers to our client
list. We also saw growth in our interest income and a reduction in
our overall interest expense. Additionally, during the quarter we
were able to recover over $400,000 on a loan that was charged-off
in 2013. Over the first six months of 2014 we have recovered more
than $611,000 of previously charged-off loans,” said Wes Schaefer,
Vice Chairman and CFO.
“American Business Bank’s second quarter results were excellent.
The balance sheet grew 12% and included over 10% in increased
customer deposits. Our loans, made to our relationship customers,
also showed a healthy 12% growth rate in the quarter. Earnings
followed this growth pattern, a result of the efficiencies inherent
in our banking model,” said Robert Schack, Chairman.
Leon Blankstein, President and CEO, added “These above results
are excellent, especially given the current tough economic
environment. We would like to thank our staff and Officers for a
job well done.”
Total assets increased 12% or $157 million to $1.455 billion at
June 30, 2014 as compared to $1.298 billion at June 30, 2013. The
loan portfolio (net) increased 11.8% or $65 million to $621 million
at June 30, 2014 as compared to $556 million at June 30, 2013.
Deposits increased 11% or $122 million to $1.264 billion at June
30, 2014 as compared to $1.142 billion at June of 2013. Borrowings
from the Federal Home Loan Bank increased from $46 million at the
end of the second quarter in 2013 to $75 million at the end of the
second quarter in 2014.
During the second quarter of 2014, Net Interest Income increased
$535,000 or 5.4% to $10,400,000 from $9,865,000 during the second
quarter in 2013.
Non-Interest income during the second quarter of 2014 decreased
$2,230,000 to $1,015,000 from $3,245,000 during the second quarter
of 2013. This change was centered in investment gains as mentioned
above.
Non-Interest expense during the second quarter of 2014 showed a
marginal decrease of $13,000 or 0.2% to $6,610,000 from $6,623,000
during the second quarter in 2013.
Asset quality at the end of the second quarter of 2014 remains
excellent, with $279,000 of non-performing loans, or 0.04% of total
loans; and, no OREO. At the end of June 2014, the allowance for
loan losses stood at $12,314,000 or 1.94% of loans. During the
six months ended June 30th of 2014, the Bank has a net recovery of
previously charged-off loans for $611,000.
AMERICAN BUSINESS BANK headquartered in downtown Los Angeles
offers a wide range of financial services to the business
marketplace. Clients include wholesalers, manufacturers, service
businesses, professionals and non-profits. The Bank has opened four
Loan Production Offices in strategic areas including our Orange
County Office in Irvine, our South Bay Office in Torrance, our San
Fernando Valley Office in the Warner Center and our Inland Empire
Office in Ontario.
American Business Bank Figures in $000,
except per share amounts
CONSOLIDATED BALANCE
SHEET (unaudited) As of:
June June Change
2014 2013 %
Assets: Cash & Equivalents $ 62,310
$ 48,360 28.8 % Fed Funds Sold 5,000 5,000 0.0 % Interest Bearing
Balances 28 28 0.0 %
Investment Securities: US
Agencies 415,813 355,326 17.0 % Mortgage Backed Securities 121,510
131,219 -7.4 % State & Municipals 173,967 161,114 8.0 %
Other 3,009
3,100 -2.9 % Total Investment Securities 714,299
650,759 9.8 %
Gross Loans: Commercial Real Estate
380,782 323,826 17.6 % Commercial & Industrial 201,786 202,378
-0.3 % Other Real Estate 45,816 35,411 29.4 % Other
5,240 4,787
9.5 % Total Gross Loans 633,624 566,402 11.9 %
Allowance for Loan & Lease Losses (12,314
) (10,743 ) 14.6 % Net Loans 621,310 555,659
11.8 % Premises & Equipment 925 640 44.5 % Other Assets
51,208
37,897 35.1 %
Total Assets
$ 1,455,080
$ 1,298,343 12.1 %
Liabilities: Demand Deposits $ 600,014 $
557,005 7.7 % Money Market 591,488 503,118 17.6 % Time
Deposits and Savings 72,999
82,115 -11.1 % Total Deposits 1,264,501 1,142,238
10.7 % FHLB Advances / Other Borrowings 75,000 46,000 63.0 %
Other Liabilities 5,892
10,621 -44.5 %
Total
Liabilities $ 1,345,393
$ 1,198,859 12.2 %
Shareholders' Equity: Common Stock &
Retained Earnings $ 113,734 $ 100,339 13.3 % Accumulated
Other Comprehensive Income / (Loss) (4,047 )
(855 ) 373.3 %
Total Shareholders'
Equity $ 109,687
$ 99,484 10.3 %
Total
Liabilities & Shareholders' Equity $
1,455,080 $ 1,298,343
12.1 %
Capital Adequacy: Tangible
Common Equity / Tangible Assets 7.54 % 7.66 % -- Tier 1 Leverage
Ratio 8.02 % 7.79 % -- Tier 1 Capital Ratio / Risk Weighted Assets
15.18 % 15.60 % -- Total Risk-Based Ratio 16.44 % 16.86 % --
Per Share Information: Common Shares
Outstanding 4,952,416 4,878,716 -- Book Value Per Share $ 22.20 $
20.40 8.8 % Tangible Book Value Per Share $ 22.20 $ 20.40 8.8 %
American Business Bank Figures in $000,
except per share amounts
CONSOLIDATED
INCOME STATEMENT (unaudited) For the 3-month
period ended: June June Change
2014 2013
% Interest Income: Loans &
Leases $ 7,001 $ 6,294 11.2 % Investment Securities
3,789 4,033 -6.1 %
Total Interest Income 10,790 10,327 4.5 %
Interest Expense: Money Market, NOW Accounts
& Savings 302 329 -8.2 % Time Deposits 71 90 -21.1 %
Repurchase Agreements / Other Borrowings 17
43 -60.5 % Total Interest Expense 390 462
-15.6 % Net Interest Income 10,400 9,865 5.4 %
Provision for Loan Losses (250 )
(850 ) -70.6 % Net Interest Income After Provision for Loan
Losses 10,150 9,015 12.6 %
Non-Interest
Income: Deposit Fees 326 277 17.7 % Realized Securities
Gains 210 2,960 -92.9 % Other
479 8 5887.5 %
Total Non-Interest Income 1,015 3,245 -68.7 %
Non-Interest Expense: Compensation &
Benefits 3,912 3,956 -1.1 % Occupancy & Equipment 529 492 7.5 %
Other 2,169
2,175 -0.3 % Total Non-Interest Expense
6,610 6,623 -0.2 % Pre-Tax Income 4,555 5,637 -19.2 %
Provision for Income Tax (1,512 )
(2,007 ) -24.7 %
Net
Income $ 3,043 $
3,630 -16.2 % Less: After-Tax Realized Securities
Gains $ 140
$ 1,906
Core Net Income $ 2,903
$ 1,724 68.4 %
Per Share
Information: Average Shares Outstanding (for the
quarter) 4,951,749 4,878,032 -- Earnings Per Share - Basic $ 0.61 $
0.74 -17.4 % Earnings Per Share " CORE" - Basic $ 0.59 $
0.35 65.9 %
American Business Bank
Figures in $000, except per share amounts
June June Change
2014 2013 %
Performance Ratios Return on
Average Assets (ROAA) 0.83 % 1.17 % -- Return on Average Equity
(ROAE) 11.07 % 14.36 % -- Return on Average Assets " CORE"
(ROAA) 0.81 % 0.60 % -- Return on Average Equity " CORE" (ROAE)
10.78 % 7.33 % --
Asset Quality
Overview Non-Performing Loans $ - $ - NA Loans
90+Days Past Due 279
705 -60.4 % Total Non-Performing Loans $ 279 $
705 -60.4 % Restructured Loans (TDR's) $ 2,538 $ 6,335 -59.9
% Other Real Estate Owned 0 0 -- ALLL / Gross Loans
1.94 % 1.90 % -- ALLL / Non-Performing Loans * 4413.62 % 1523.83 %
-- Non-Performing Loans / Total Loans * 0.04 % 0.12 % --
Non-Performing Assets / Total Assets * 0.02 % 0.05 % -- Net
Charge-Offs $ (611 ) $ 944 -- Net Charge-Offs / Average Gross Loans
-0.11 % 0.18 % -- * Excludes Restructured Loans
American Business BankWes E. SchaeferVice Chairman and Chief
Financial Officer(213) 430-4000
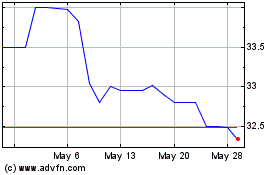
American Business Bank (QX) (USOTC:AMBZ)
Historical Stock Chart
From Dec 2024 to Jan 2025

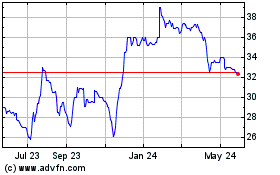
American Business Bank (QX) (USOTC:AMBZ)
Historical Stock Chart
From Jan 2024 to Jan 2025
