-- Year-to-Date Net Loans Increase 13% --
Farmers & Merchants Bank of Long Beach (OTCBB:FMBL) today
reported financial results for the third quarter ended September
30, 2013.
“We achieved continued growth in the third quarter in key
metrics, including loans and deposits, reflecting the strength of
our brand and the F&M team in a highly competitive landscape,”
said Henry Walker, president of Farmers & Merchants Bank of
Long Beach. “During the quarter, F&M demonstrated its
commitment to maintaining its leadership in the region by expanding
our executive management team with the appointment of Melissa
Lanfre as the Bank’s chief operating officer.”
Income Statement
For the 2013 third quarter, interest income amounted to $40.9
million, compared with $41.5 million earned in the 2012 third
quarter, reflecting the protracted low interest rate environment.
Interest income for the nine-month period ended September 30, 2013
was $119.7 million, compared with $130.7 million reported for the
same period in 2012.
Interest expense for the 2013 third quarter declined to $1.6
million from $1.7 million in last year’s third quarter. Interest
expense for the nine-month period ended September 30, 2013 declined
to $4.6 million from $5.4 million reported for the same period last
year.
Net interest income for the 2013 third quarter was $39.3
million, compared with $39.8 million for the third quarter of 2012,
and $115.1 million for the first nine months of 2013, versus $125.3
million for the same period in 2012.
Farmers & Merchants’ net interest margin was 3.28% for the
2013 third quarter, compared with 3.51% for the 2012 third quarter.
Net interest margin was 3.25% for the first nine months of 2013,
compared with 3.76% for the same period in 2012.
The Bank did not have a provision for loan losses in the first
nine months of 2013, nor in the same period a year ago, amid
continued strength in the quality of its loan portfolio. The Bank’s
allowance for loan losses as a percentage of loans outstanding was
2.32% at September 30, 2013, compared with 2.57% at December 31,
2012.
Non-interest income increased to $10.5 million for the 2013
third quarter from $9.5 million in the third quarter a year ago.
Non-interest income was $30.6 million for the nine-month period
ended September 30, 2013, compared with $20.4 million for the same
period in 2012.
Non-interest expense for the 2013 third quarter was $27.9
million, versus $28.1 million for the same period last year.
Non-interest expense for the first nine months of 2013 was $77.0
million, compared with $72.2 million last year.
Net income for the 2013 third quarter increased to $15.1
million, or $114.95 per diluted share, from $14.9 million, or
$113.68 per diluted share, in the year-ago period. The Bank’s net
income for the first nine months of 2013 was $47.2 million, or
$360.39 per diluted share, compared with $50.1 million, or $383.02
per diluted share, for the same period in 2012.
Balance Sheet
At September 30, 2013, net loans totaled $2.18 billion, compared
with $1.93 billion at December 31, 2012. The Bank’s deposits
totaled $3.84 billion at the end of the 2013 third quarter,
compared with $3.69 billion at December 31, 2012. Non-interest
bearing deposits represented 40.4% of total deposits at September
30, 2013, versus 40.0% of total deposits at December 31, 2012.
Total assets increased to $5.15 billion at the close of the 2013
third quarter, compared with $4.99 billion at the close of the
prior year.
At September 30, 2013, Farmers & Merchants Bank remained
“well-capitalized” under all regulatory categories, with a total
risk-based capital ratio of 28.72%, a Tier 1 risk-based capital
ratio of 27.46%, and a Tier 1 leverage ratio of 14.43%. The minimum
ratios for capital adequacy for a well-capitalized bank are 10.00%,
6.00% and 5.00%, respectively.
“Results for the third quarter demonstrate F&M’s sound and
stable reputation, which continues to pervade throughout Southern
California,” said Daniel Walker, chief executive officer and
chairman of the board. “Additionally, the strength of our balance
sheet positions us well, as we embark on the next phase of growth
and development for the Bank.”
About Farmers & Merchants Bank
Founded in Long Beach in 1907 by C.J. Walker, Farmers &
Merchants Bank has 21 branches in L.A. and Orange Counties. The
Bank specializes in commercial and small business banking along
with business loan programs. Farmers & Merchants Bank of Long
Beach is a California state chartered bank with deposits insured by
the Federal Deposit Insurance Corporation (Member FDIC) and an
Equal Housing Lender. For more information about F&M, please
visit www.fmb.com.
FARMERS & MERCHANTS BANK OF LONG BEACH Income
Statements (Unaudited) (In thousands except per share
data) Three Months Ended Sept.
30, Nine Months Ended Sept. 30,
2013 2012 2013
2012 Interest income:
Loans $ 26,002 $ 26,741 $ 76,813 $ 86,097 Securities
available-for-sale 1,980 2,639 6,289 8,430 Securities
held-to-maturity 12,800 11,848 36,117 35,392 Deposits with banks
105 294 457 764 Total interest income 40,887 41,522 119,676 130,683
Interest expense: Deposits 1,268 1,433 3,753
4,512 Securities sold under repurchase agreements 283 305 839 854
Total interest expense 1,551 1,738 4,592 5,366 Net interest
income 39,336 39,784 115,084 125,317
Provision for loan
losses - - - - Net interest income after provision for
loan losses 39,336 39,784 115,084 125,317
Non-interest
income: Service charges on deposit accounts 1,135 1,110
3,403 3,462 Gains on sale of securities - - 1,048 42 Other real
estate owned income 3,275 2,504 3,275 2,504 Merchant bankcard
income 2,448 3,418 7,010 6,644 Other income 3,623 2,477 15,894
7,780 Total non-interest income 10,481 9,509 30,630 20,432
Non-interest expense: Salaries and employee benefits
13,536 11,695 40,260 35,259 FDIC and other insurance expense 1,303
1,634 4,702 4,813 Occupancy expense 2,340 2,032 5,044 4,768
Equipment expense 1,619 1,366 4,592 4,082 Other real estate owned
expense 712 2,905 243 3,443 Amortization of public welfare
investments 2,020 1,866 6,061 5,897 Merchant bankcard expense 1,904
2,902 5,564 5,072 Legal and professional services 970 883 2,719
1,929 Marketing expense 1,573 1,313 2,980 2,425 Other expense 1,939
1,455 4,860 4,477 Total non-interest expense 27,916 28,051 77,025
72,165 Income before income tax expense 21,901 21,242 68,689
73,584
Income tax expense 6,851 6,359 21,504 23,436
Net income $ 15,050 $
14,883 $ 47,185 $ 50,148
Basic and diluted earnings per common share $ 114.95 $ 113.68 $
360.39 $ 383.02
FARMERS & MERCHANTS BANK OF
LONG BEACH Balance Sheets (Unaudited) (In thousands
except share and per share data)
Sept. 30, 2013 Dec. 31,
2012 Assets Cash and due from banks:
Noninterest-bearing balances $ 65,017 $ 60,914 Interest-bearing
balances 34,059 253,087 Securities available-for-sale 492,346
630,055 Securities held-to-maturity 2,219,970 1,942,085 Loan held
for sale 1,663 2,365 Gross loans 2,228,103 1,982,075 Less allowance
for loan losses (51,621 ) (50,994 ) Less unamortized deferred loan
fees, net (708 ) (364 ) Net loans 2,175,774 1,930,718
Other real estate owned, net 14,298 17,696 Public welfare
investments 29,743 35,804 Bank premises and equipment, net 65,911
60,504 Net deferred tax assets 24,452 26,060 Other assets 22,154
29,674
Total assets $
5,145,387 $ 4,988,961
Liabilities and Stockholders' Equity
Liabilities: Deposits: Demand, non-interest bearing $
1,549,200 $ 1,474,215 Demand, interest bearing 379,142 346,991
Savings and money market savings 1,070,754 1,011,029 Time deposits
837,239 853,631 Total deposits 3,836,335 3,685,866
Securities sold under repurchase agreements 527,728 551,293
Other liabilities 30,135 34,543
Total
liabilities 4,394,198 4,271,702
Stockholders' Equity:
Common Stock, par value $20; authorized
250,000shares; issued and outstanding 130,928 shares
2,619 2,619 Additional paid-in capital 12,044 12,044 Retained
earnings 733,713 695,169 Other comprehensive income 2,813
7,427
Total stockholders' equity
751,189 717,259 Total
liabilities and stockholders' equity $ 5,145,387
$ 4,988,961
Farmers & Merchants BankJohn HinrichsExecutive Vice
President562-437-0011, ext. 5035orPondelWilkinson Inc.Evan
PondelInvestor Relations310-279-5980investor@pondel.com
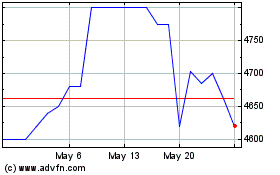
Farmers and Merchants Bank (QX) (USOTC:FMBL)
Historical Stock Chart
From Dec 2024 to Jan 2025

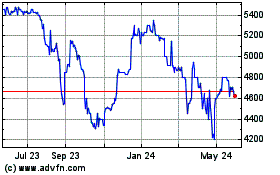
Farmers and Merchants Bank (QX) (USOTC:FMBL)
Historical Stock Chart
From Jan 2024 to Jan 2025
