BlackRock Commodities Income Investment Trust Plc - Portfolio Update
July 20 2018 - 5:50AM
PR Newswire (US)
| BLACKROCK
COMMODITIES INCOME INVESTMENT TRUST plc
(LEI:54930040ALEAVPMMDC31) |
|
| All information is at
30 June 2018 and unaudited. |
|
|
|
|
| Performance at month
end with net income reinvested |
|
|
|
|
|
One |
Three |
Six |
One |
Three |
Five |
|
|
Month |
Months |
Months |
Year |
Years |
Years |
|
| Net asset value |
0.3% |
17.6% |
9.0% |
28.8% |
39.6% |
15.3% |
|
| Share price |
4.6% |
17.9% |
12.8% |
29.1% |
29.6% |
11.7% |
|
|
|
|
|
|
|
|
|
| Sources: Datastream,
BlackRock |
|
|
|
|
| At month end |
|
|
|
|
|
| Net asset value –
capital only: |
87.14p |
|
| Net asset value cum
income*: |
87.55p |
|
| Share price: |
83.90p |
|
| Discount to NAV (cum
income): |
4.2% |
|
| Net yield: |
4.8% |
|
| Gearing - cum
income: |
6.1% |
|
| Total assets^: |
£107.4m |
|
| Ordinary shares in
issue: |
116,816,916 |
|
| Gearing range (as a % of
net assets): |
0-20% |
|
| Ongoing charges**: |
1.4% |
|
|
|
|
* Includes
net revenue of 0.41p.
^ Includes current year revenue.
** Calculated as a percentage of average net assets and using
expenses, excluding any interest costs and excluding taxation for
the year ended 30 November 2017. |
|
|
|
|
| Sector
Analysis |
% Total
Assets |
|
Country
Analysis |
%
Total
Assets |
|
|
|
|
|
| Diversified Mining |
29.7 |
|
Global |
63.6 |
| Integrated Oil |
27.5 |
|
Canada |
14.3 |
| Exploration &
Production |
15.6 |
|
USA |
11.0 |
| Gold |
9.2 |
|
Australia |
4.1 |
| Copper |
8.2 |
|
Latin America |
3.5 |
| Industrial Minerals |
3.8 |
|
Africa |
3.4 |
|
Diamonds |
2.1 |
|
Europe |
1.1 |
| Silver |
1.6 |
|
Net current
liabilities |
(1.0) |
| Steel |
1.3 |
|
|
----- |
| Distribution |
1.1 |
|
|
100.0 |
| Oil Services |
0.9 |
|
|
===== |
| Net current
liabilities |
(1.0) |
|
|
|
|
----- |
|
|
|
|
100.0 |
|
|
|
|
===== |
|
|
|
|
|
|
|
|
| Ten Largest
Investments |
|
|
|
|
|
|
|
|
|
| Company |
|
|
|
|
|
Region
of Risk |
% Total
Assets |
|
|
|
|
|
| Rio Tinto |
Global |
8.7 |
|
| BHP |
Global |
8.3 |
|
| Royal Dutch Shell
‘B’ |
Global |
6.8 |
|
| First Quantum
Minerals* |
Global |
6.2 |
|
| Glencore |
Global |
5.7 |
|
| Chevron |
Global |
5.0 |
|
| BP |
Global |
4.4 |
|
| Exxon Mobil |
Global |
3.7 |
|
| Marathon Oil |
Global |
3.2 |
|
| ConocoPhillips |
USA |
3.1 |
|
|
|
|
|
|
| * The holding in First
Quantum Minerals includes both an equity holding and a holding in
several bonds. |
|
|
|
|
|
|
|
|
|
|
|
|
|
|
|
|
|
| Commenting on the
markets, Olivia Markham and Tom Holl, representing the Investment
Manager noted: |
|
|
|
The
Company’s NAV increased by 0.3% during the month of June (in GBP
terms with dividend reinvested).
Markets experienced significant volatility during the month as the
increasing possibility of a trade war between the US and China put
pressure on cyclically sensitive areas of the market. Ongoing
rhetoric from both the Trump and China administrations on the topic
of tariffs has heightened concerns of slower than anticipated
global growth, and led to a risk-off market environment.
June was a difficult month for the mining sector, which moved into
negative territory overall for 2018. The month saw more noise
around potential trade wars as President Donald Trump approved
tariffs worth $50 billion on China, leading Beijing to counter with
$50 billion of tariffs of its own. Concerns heightened around the
potential for this to derail the global economic growth story and
mined commodities suffered as a result. However, whilst the market
focused on the risks surrounding rising protectionism, global
economic data remained healthy, with global manufacturing PMI
increasing to 53.0. The US dollar strengthened over the
month, providing another headwind for commodity prices and precious
metals in particular. Gold, silver and platinum prices were down by
4.1%, 2.2% and 6.2% respectively. The base metals were also weak,
with zinc, copper and nickel down by 6.2%, 3.2% and 2.2%
respectively. The bulk commodities were relatively stable, however,
with the iron ore (62% fe) price up by 2.3% over the month to
$67/tonne.
In the energy sector, the primary news during the month was the
meeting of “OPEC Plus”; where the group announced plans to
re-target 100% compliance with the 1.8 million barrels per day
(b/d) cuts agreed in late 2016. Due to unintended production
declines in Venezuela, Angola and Mexico, the group’s compliance
was 147% in May 2018 and, as a result, we could see up to 1.0
million b/d of supply added back to the market during the second
half of 2018. On the basis that global demand remains robust, this
additional supply looks to be required to balance the market and
our base case is for oil prices to stay around current levels for
the remainder of 2018. With this in mind, we see potential upside
risk as supply outages are likely to increase; US sanctions on Iran
will come into force in November, whilst Venezuela production is
expected to continue falling, and finally, the risk of disruptions
in Libya has increased with growing political tensions.
All data points in US dollar terms unless otherwise specified.
Commodity price moves sourced from Thomson Reuters Datastream. |
|
|
|
| 20 July 2018 |
|
|
|
| ENDS |
|
|
|
| Latest information is
available by typing www.blackrock.co.uk/brci on the internet,
"BLRKINDEX" on Reuters, "BLRK" on Bloomberg or "8800" on Topic 3
(ICV terminal). Neither the contents of the Manager’s website
nor the contents of any website accessible from hyperlinks on the
Manager’s website (or any other website) is incorporated into, or
forms part of, this announcement. |
|
|
|
|
|
|
|
|
|
|
|
|
|
|
|
|
|
|
|
|
|
|
|

Copyright y 20 PR Newswire
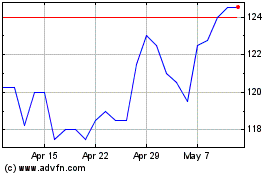
Blackrock Energy And Res... (LSE:BERI)
Historical Stock Chart
From Apr 2024 to May 2024

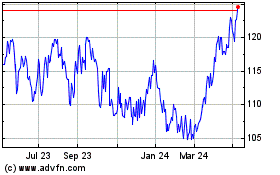
Blackrock Energy And Res... (LSE:BERI)
Historical Stock Chart
From May 2023 to May 2024
