India Capital Growth Fund Limited Net Asset Value(s) (8415Y)
December 08 2017 - 6:55AM
UK Regulatory
TIDMIGC
RNS Number : 8415Y
India Capital Growth Fund Limited
08 December 2017
8 December 2017
India Capital Growth Fund Limited (the "Company" or "ICGF")
Net Asset Value statement at 30 November 2017
Net Asset Value
The Company announces its Net Asset Value per share as at 30
November 2017 was 123.09 pence.
In November the Net Asset Value (NAV) was up 1.3% in Sterling
terms, whilst the BSE Mid Cap TR Index was up 0.6%, delivering an
out performance against the notional benchmark of 0.7%. In local
currency terms, the NAV was up 2.8% for the month.
Portfolio update
Positive attribution to the portfolio's performance came from
Sobha (up 22.8%), Balkrishna Industries (up 25.9%), Indian Bank (up
24.7%) and Radico Khaitan (up 30.2%). Negative attribution came
from Federal Bank (down 9.1%), Dewan Housing (down 4.1%) and
Manpasand Beverages (down 10.3%).
Market and economic update
India's equity market performance was mixed this month with the
BSE Sensex down 0.2%, whilst the BSE Mid Cap Index was up 2.0%.
This was on the back of the reduction of GST rates from 28% to 18%
on a large number of items, providing greater benefits to the SME
sector and reducing the inflationary impact on consumers. Only 50
items, mostly "demerit" goods & services and luxuries will
continue to be taxed at 28%.
In November, Foreign and Domestic Institutions were both net
buyers at US$3.0bn and US$1.4bn respectively, whilst INR
appreciated 0.4% against USD but fell 1.4% against GBP.
India's third quarter GDP accelerated to 6.3% from 5.7% in the
second quarter due to stronger growth in mining and manufacturing
as companies built inventories and restored supply chains,
following the disruption caused by the introduction of GST. On the
expenditure side both private and government consumption
expenditure growth fell (owing to the high base effect), whilst
gross fixed capital formation growth recovered, supported by
ongoing government spending on roads and railways.
Consumer Price Inflation accelerated in October to 3.6% from
3.3% in September, led mainly by rising food prices. Wholesale
Price Inflation also increased to 3.6% from 2.6% on the back of
rising crude oil prices. Any further increase could put pressure on
India's macro economy, which in turn would pressurise the
currency.
Moody upgraded India's government bond rating from positive
(Baa3) to stable (Baa2), reaffirming the long-term benefit of
recent reforms, whilst India shot up 30 places into the top 100 in
the World Bank's "ease of doing business".
 Portfolio analysis by sector as at 30 November
  2017

 Sector                        No. of Companies         % of Portfolio
 Financials                    8                                 25.5%
 Materials                     9                                 21.2%
 Consumer Discretionary        8                                 17.5%
 Industrials                   4                                 10.0%
 Consumer Staples              4                                  9.2%
 IT                            2                                  5.9%
 Real Estate                   2                                  3.6%
 Healthcare                    2                                  3.3%
 Total Equity Investment       39                                96.2%
 Net Cash                                                         3.8%
 Total Portfolio               39                               100.0%

 Top 20 holdings as at 30 November 2017

 Holding                       Sector                   % of Portfolio
 Dewan Housing Finance         Financials                         6.4%
 Federal Bank                  Financials                         4.6%
 Motherson Sumi Systems        Consumer Discretionary             4.5%
 Ramkrishna Forgings           Materials                          4.4%
 Sobha Developers              Real Estate                        3.4%
 Kajaria Ceramics              Industrials                        3.3%
 Jyothy Laboratories           Consumer Staples                   3.3%
 NIIT Technologies             IT                                 3.3%
 Finolex Cables                Industrials                        3.1%
 Skipper                       Materials                          3.0%
 City Union Bank               Financials                         2.9%
 Balkrishna Industries         Consumer Discretionary             2.7%
 PI Industries                 Materials                          2.7%
 Tech Mahindra                 IT                                 2.7%
 Indusind Bank                 Financials                         2.6%
 Yes Bank                      Financials                         2.6%
 Indian Bank                   Financials                         2.5%
 Sagar Cements                 Materials                          2.4%
 The Ramco Cements             Materials                          2.4%
 Capital First                 Financials                         2.3%

 Portfolio analysis by market capitalisation
  size as 30 November 2017

 Market capitalisation         No. of Companies         % of Portfolio
  size
 Small Cap (M/Cap < US$2bn)    25                                54.2%
 Mid Cap (US$2bn < M/Cap
  < US$7bn)                    10                                29.7%
 Large Cap (M/Cap > US$7bn)    4                                 12.3%
 Total Equity Investment       39                                96.2%
 Net Cash                                                         3.8%
 Total Portfolio               39                               100.0%
This information is provided by RNS
The company news service from the London Stock Exchange
END
NAVUGGPAPUPMGPR
(END) Dow Jones Newswires
December 08, 2017 07:55 ET (12:55 GMT)
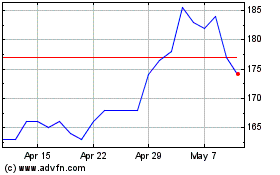
India Capital Growth (LSE:IGC)
Historical Stock Chart
From Apr 2024 to May 2024

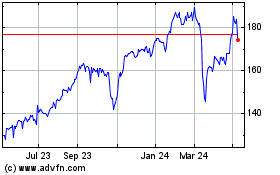
India Capital Growth (LSE:IGC)
Historical Stock Chart
From May 2023 to May 2024
