Investors Title Company today announced its results for the
quarter ended March 31, 2016. The Company reported net income
attributable to the Company of $1,814,040, or $0.93 per diluted
share, compared with $1,726,124, or $0.86 per diluted share, for
the prior year period.
Revenues for the quarter totaled $24.9 million, a decrease of
12.2% versus the prior year period, reflecting lower levels of
premiums written. Although revenues for most issuing offices
increased from last year, they were offset by reductions in a few
larger agencies, resulting in an unfavorable total revenue
comparison. Transaction volume was down slightly from the prior
year period, but with a mix more heavily weighted toward
higher-margin purchase business.
Operating expenses decreased 14.1% versus the prior year period,
mainly due to decreases in commissions and the provision for
claims. Lower agent premiums resulted in a 21.0% decrease in
commissions. The provision for claims was $15,959, down
substantially for the quarter as a result of continued favorable
claims experience in recent policy years. All other expenses
increased 1.7%, mainly due to normal inflationary increases in
payroll and other overhead expenses, partially offset by a
reduction in premium taxes due to lower volumes and lower effective
premium tax rates.
Chairman J. Allen Fine commented, “We were pleased to see
continuation of an active real estate market and increasing real
estate values during the quarter. While volume reductions from a
handful of agencies resulted in an unfavorable comparison to the
prior year, revenues for most of our issuing offices increased. A
higher mix of direct business, favorable loss development, and
stable overhead expenses resulted in positive net income growth
versus the prior year.”
“With interest rates remaining low, and an improving economy in
our core markets, we remain optimistic that the strong housing
market will drive higher transaction volumes throughout the year.
Higher volumes, coupled with continued increases in real estate
values and a purchase-weighted market, should result in another
year of solid performance for Investors Title.”
Investors Title Company’s subsidiaries issue and underwrite
title insurance policies. The Company also provides investment
management services and services in connection with tax-deferred
exchanges of like-kind property.
Certain statements contained herein may constitute
forward-looking statements within the meaning of the Private
Securities Litigation Reform Act of 1995. Such statements include,
among others, any statements regarding the Company’s expected
performance for the year, future home price increases, changes in
home purchase or refinance activity and the mix thereof, interest
rate changes, expansion of the Company’s market presence, enhancing
competitive strengths, positive development in housing
affordability, unemployment or overall economic conditions or
statements regarding our actuarial assumptions and the application
of recent historical claims experience to future periods. These
statements involve a number of risks and uncertainties that could
cause actual results to differ materially from anticipated and
historical results. Such risks and uncertainties include, without
limitation: the cyclical demand for title insurance due to changes
in the residential and commercial real estate markets; the
occurrence of fraud, defalcation or misconduct; variances between
actual claims experience and underwriting and reserving
assumptions, including the limited predictive power of historical
claims experience; declines in the performance of the Company’s
investments; government regulation; changes in the economy; loss of
agency relationships, or significant reductions in agent-originated
business and other considerations set forth under the caption “Risk
Factors” in the Company’s Annual Report on Form 10-K for the year
ended December 31, 2015, as filed with the Securities and Exchange
Commission, and in subsequent filings.
Investors Title Company and
Subsidiaries
Consolidated Statements of
Income
For the Three Months Ended March 31,
2016 and 2015
(Unaudited)
Three Months Ended March 31, 2016 2015
Revenues: Net premiums written
$
21,508,997 $ 24,962,041 Investment income
– interest
and dividends
1,151,011 1,178,039 Net realized gain on
investments
149,830 14,803 Other
2,052,184
2,146,926 Total Revenues
24,862,022
28,301,809
Operating Expenses: Commissions to agents
11,532,882 14,596,539 Provision for claims
15,959
786,612 Salaries, employee benefits and payroll taxes
7,471,951 7,277,449 Office occupancy and operations
1,493,860 1,304,221 Business development
480,390
486,975 Filing fees, franchise and local taxes
230,054
216,643 Premium and retaliatory taxes
311,831 476,591
Professional and contract labor fees
538,653 584,107 Other
202,981 203,548 Total Operating Expenses
22,278,561 25,932,685
Income before
Income Taxes 2,583,461 2,369,124
Provision for
Income Taxes 779,000 643,000
Net
Income 1,804,461 1,726,124
Net Loss
Attributable to Noncontrolling Interests 9,579
—
Net Income Attributable to the Company
$ 1,814,040 $ 1,726,124
Basic
Earnings per Common Share $ 0.94 $
0.86
Weighted Average Shares Outstanding – Basic
1,934,318 2,012,738
Diluted Earnings
per Common Share $ 0.93 $ 0.86
Weighted Average Shares Outstanding – Diluted
1,940,963 2,018,504
Investors Title Company and
Subsidiaries
Consolidated Balance Sheets
As of March 31, 2016 and December
31, 2015
(Unaudited)
March 31, 2016 December 31,2015
Assets: Investments in securities: Fixed maturities,
available-for-sale, at fair value
$ 106,383,823 $
106,066,384 Equity securities, available-for-sale, at fair value
37,681,569 37,513,464 Short-term investments
7,520,069 6,865,406 Other investments
8,814,605
10,106,828 Total investments
160,400,066
160,552,082 Cash and cash equivalents
21,873,731 21,790,068 Premium and fees receivable
6,940,127 8,392,697 Accrued interest and dividends
1,320,942 1,004,126 Prepaid expenses and other assets
8,267,670 12,634,105 Property, net
7,502,745
7,148,951 Current income taxes recoverable
1,036,309
—
Total Assets $ 207,341,590
$ 211,522,029
Liabilities and Stockholders’
Equity
Liabilities:
Reserves for claims
$ 37,397,000 $ 37,788,000
Accounts payable and accrued liabilities
18,768,195
25,043,588 Current income taxes payable
— 210,355 Deferred
income taxes, net
7,762,160 5,703,006 Total
liabilities
63,927,355 68,744,949
Stockholders’ Equity:
Common stock – no par value
(10,000,000 authorized shares; 1,932,291 and 1,949,797
shares issued and outstanding 2016
and 2015, respectively, excluding 291,676 shares
for 2016 and 2015 of common stock
held by the Company's subsidiary)
1 1 Retained earnings
131,132,279 131,186,866
Accumulated other comprehensive income
12,184,336
11,483,015 Total stockholders’ equity attributable to the
Company
143,316,616 142,669,882 Noncontrolling interests
97,619 107,198 Total stockholders’ equity
143,414,235 142,777,080
Total Liabilities
and Stockholders’ Equity $ 207,341,590
$ 211,522,029
Investors Title Company and
Subsidiaries
Net Premiums Written By Branch and
Agency
For the Three Months Ended March 31,
2016 and 2015
(Unaudited)
Three Months Ended
March 31, 2016 % 2015 %
Branch
$ 5,477,657 25.5 $ 5,605,764 22.5
Agency 16,031,340 74.5
19,356,277 77.5
Total $
21,508,997 100.0 $ 24,962,041
100.0
View source
version on businesswire.com: http://www.businesswire.com/news/home/20160504006032/en/
Investors Title CompanyElizabeth B. Lewter, 919-968-2200
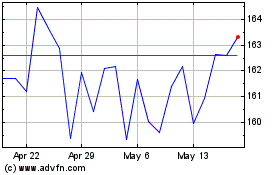
Investors Title (NASDAQ:ITIC)
Historical Stock Chart
From Jun 2024 to Jul 2024

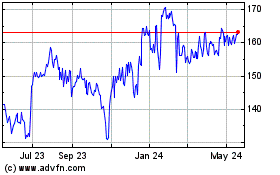
Investors Title (NASDAQ:ITIC)
Historical Stock Chart
From Jul 2023 to Jul 2024
