false
0000906465
0000906465
2023-11-02
2023-11-02
iso4217:USD
xbrli:shares
iso4217:USD
xbrli:shares
UNITED STATES
SECURITIES AND EXCHANGE COMMISSION
Washington, D.C. 20549
FORM 8-K
Current Report
Pursuant to Section 13 or 15(d) of the Securities Exchange Act of 1934
Date of report (Date of earliest event reported)
November 2, 2023
QCR HOLDINGS, INC.
(Exact name of registrant as specified in charter)
Commission File Number: 0-22208
| Delaware |
|
42-1397595 |
| (State or other jurisdiction of incorporation) |
|
(I.R.S. Employer Identification Number) |
3551 Seventh Street
Moline, Illinois 61265
(Address of principal executive offices, including zip code)
(309) 736-3584
(Registrant's telephone number, including area code)
N/A
(Former name or former address, if changed since last report)
Check the appropriate box below if the Form 8-K filing is intended to simultaneously satisfy
the filing obligation of the registrant under any of the following provisions (see General Instruction A.2. below):
☐ Written communications
pursuant to Rule 425 under the Securities Act (17 CFR 230.425)
☐ Soliciting material
pursuant to Rule 14a-12 under the Exchange Act (17 CFR 240.14a-12)
☐ Pre-commencement
communications pursuant to Rule 14d-2(b) under the Exchange Act (17 CFR 240.14d-2(b))
☐ Pre-commencement
communications pursuant to Rule 13e-4(c) under the Exchange Act (17 CFR 240.13e-4(c))
Securities registered pursuant to Section 12(b) of the Act.
| Title of each class |
|
Trading Symbol(s) |
|
Name of each exchange on which registered |
| Common Stock, $1.000 Par Value |
|
QCRH |
|
The Nasdaq Global Market |
Indicate by check mark whether the registrant
is an emerging growth company as defined in Rule 405 of the Securities Act of 1933 (§ 230.405 of this chapter) or Rule 12b–2
of the Securities Exchange Act of 1934 (§ 240.12b–2 of this chapter). Emerging growth
company ☐
If an emerging growth company, indicate by
check mark if the registrant has elected not to use the extended transition period for complying with any new or revised financial accounting
standards provided pursuant to Section 13(a) of the Exchange Act. ☐
Item 7.01. Regulation FD Disclosure.
On November 2, 2023, QCR Holdings, Inc. (the “Company”) posted
a presentation to the Company’s website. The presentation is available to view at www.qcrh.com, and is also attached hereto as Exhibit
99.1 and incorporated by reference herein.
The information in Item 7.01 of this Current Report on Form 8-K and the
related exhibit attached hereto is being “furnished” and will not, except to the extent required by applicable law or regulation,
be deemed “filed” by the Company for purposes of Section 18 of the Securities Exchange Act of 1934, as amended (the “Exchange
Act”), or otherwise subject to the liabilities of that section, nor will any of such information or exhibits be deemed incorporated
by reference into any filing under the Securities Act of 1933, as amended, or the Exchange Act.
Item 9.01. Financial Statements and Exhibits.
(d) Exhibits.
99.1 Investor Presentation dated November 2, 2023
104 Cover Page Interactive Data File (embedded within the
Inline XBRL document)
SignatureS
Pursuant to the requirements of the Securities Exchange
Act of 1934, the registrant has duly caused this report to be signed on its behalf by the undersigned hereunto duly authorized.
| Date: November 2, 2023 |
QCR HOLDINGS, Inc. |
| |
|
|
|
By: |
/s/ Todd A. Gipple |
|
|
Name: |
Todd A. Gipple |
|
Title: |
President and Chief Financial Officer |
Exhibit 99.1


2

3 FORWARD - LOOKING STATEMENTS Special Note Concerning Forward - Looking Statements . This document contains, and future oral and written statements of the Company and its management may contain, forward - looking statements within the meaning of the Private Securities Litigation Reform Act of 1995 with respect to the financial condition, results of operations, plans, objectives, future performance and business of the Company . Forward - looking statements, which may be based upon beliefs, expectations and assumptions of the Company's management and on information currently available to management, are generally identifiable by the use of words such as “believe,” “expect,” “anticipate,” “bode”, “predict,” “suggest,” “project”, “appear,” “plan,” “intend,” “estimate,” ”annualize,” “may,” “will,” “would,” “could,” “should,” “likely,” “might,” “potential,” “continue,” “annualized,” “target,” “outlook,” as well as the negative forms of those words, or other similar expressions . Additionally, all statements in this document, including forward - looking statements, speak only as of the date they are made, and the Company undertakes no obligation to update any statement in light of new information or future events . A number of factors, many of which are beyond the ability of the Company to control or predict, could cause actual results to differ materially from those in its forward - looking statements . These factors include, among others, the following : (i) the strength of the local, state, national and international economies(including effects of inflationary pressures and supply chain constraints) ; (ii) the economic impact of any future terrorist threats and attacks, widespread disease or pandemics (including the COVID - 19 pandemic in the United States), acts of war or other threats thereof (including the Israeli - Palestinian conflict and the Russian invasion of Ukraine), or other adverse external events that could cause economic deterioration or instability in credit markets, and the response of the local, state and national governments to any such adverse external events ; (iii) changes in accounting policies and practices, as may be adopted by state and federal regulatory agencies, the FASB or the PCAOB ; (iv) changes in local, state and federal laws, regulations and governmental policies concerning the Company's general business and any changes in response to the recent failures of other banks ; (v) changes in interest rates and prepayment rates of the Company's assets (including the impact of LIBOR phase - out and the recent potential additional rate increases by the Federal Reserve) ; (vi) increased competition in the financial services sector, including from non - bank competitors such as credit unions and “fintech” companies, and the inability to attract new customers ; (vii) changes in technology and the ability to develop and maintain secure and reliable electronic systems ; (viii) unexpected results of acquisitions, which may include failure to realize the anticipated benefits of acquisitions and the possibility that transaction costs may be greater than anticipated ; (ix) the loss of key executives or employees ; (x) changes in consumer spending ; (xi) unexpected outcomes of existing or new litigation involving the Company ; (xii) the economic impact of exceptional weather occurrences such as tornadoes, floods and blizzards ; (xiii) fluctuations in the value of securities held in our securities portfolio ; (xiv) concentrations within our loan portfolio, large loans to certain borrowers, and large deposits from certain clients ; (xv) the concentration of large deposits from certain clients who have balances above current FDIC insurance limits and may withdraw deposits to diversity their exposure ; (xvi) the level of non - performing assets on our balance sheets ; (xvii) interruptions involving our information technology and communications systems or third - party servicers ; (xviii) breaches or failures of our information security controls or cybersecurity - related incidents, and (xixi) the ability of the Company to manage the risks associated with the foregoing as well as anticipated . These risks and uncertainties should be considered in evaluating forward - looking statements and undue reliance should not be placed on such statements . Additional information concerning the Company and its business, including additional factors that could materially affect the Company's financial results, is included in the Company's filings with the Securities and Exchange Commission . NON - GAAP FINANCIAL MEASURES These slides contain non - GAAP financial measures . For purposes of Regulation G, a non - GAAP financial measure is a numerical measure of the registrant ’ s historical or future financial performance, financial position or cash flows that excludes amounts, or is subject to adjustments that have the effect of excluding amounts, that are included in the most directly comparable measure calculated and presented in accordance with GAAP in the statement of income, balance sheet or statement of cash flows (or equivalent statements) of the issuer ; or includes amounts, or is subject to adjustments that have the effect of including amounts, that are excluded from the most directly comparable measure so calculated and presented . In this regard, GAAP refers to generally accepted accounting principles in the United States . Pursuant to the requirement of Regulation G, the Company has provided reconciliations within the slides, as necessary, of the non - GAAP financial measure to the most directly comparable GAAP financial measure . For more details on the Company’s non - GAAP measures, refer to the Company’s Annual Report on Form 10 - K for the year ended December 31 , 2022 .

Consistent Top Tier Financial Performance • Upper quartile returns compared to proxy peers • EPS CAGR of 18.8% in last five years and positioned for sustained growth • High profitability and low dividend payout ratio quickly builds core equity capital Diversified Sources of Revenue • Diverse and growing fee revenue streams with Wealth Management, Correspondent Banking, and Capital Markets business lines Track Record of Successfully Integrating Acquisitions • Capacity for future M&A and considered acquirer of choice Prudent Risk Management • Strong and proven credit culture • Right people, infrastructure and balance sheet to sustain performance 4 QCR Holdings, Inc. (NASDAQ: QCRH)

5 Exceptional Growth in Key Financial Metrics Since the end of 2018, our company has grown total consolidated assets at a 14.8%** compounded annual growth rate and delivered consistent, steady growth - outperforming many of our peers. CAGR = Compound Annualized Growth Rate. *Annualized ** Data excluding Rockford Bank & Trust CAGR 9/30/2023 12/31/2018 Financial Metric 16.9% $6.46* $3.08 Adjusted Earnings Per Share 11.5% $40.33 $24.04 Tangible Book Value Per Share 15.5% $6.6B $3.3B Loans ** 14.5% $6.2B $3.3B Core Deposits ** 8.0% $4.9B $3.4B Assets Under Management **

6 How is QCRH Unique? Diversified Business Lines Drive Outstanding Results Traditional Banking Our Complementary High - Performing Business Lines Correspondent Banking Wealth Management Specialty Finance Group • Consumer & retail banking • Complex commercial lending • Sophisticated treasury management solutions • Customized private banking services • Small ticket lease financing (m2 Equipment Finance) • Competitive deposit products with approximately $858MM in total liquidity • Safekeeping and cash management services • 181 correspondent banking relationships • Bank stock loans • Fiduciary services • Investment management services • Financial planning • Brokerage services • 9/30/23 AUM: $4.9B • Municipal and tax credit lending • Significant floating to fixed rate swap revenue in tax credit lending • Capital markets revenue averaging $14MM per quarter for last two years Built on top of our traditional banking business, we have three complementary business lines that diversify our earnings power with exceptional results.

7 $10.8 $28.3 $74.8 $61.0 $41.3 $0 $20 $40 $60 $80 2018 2019 2020 2021 2022 9/ 30/23 Fee Income Growth ($MM) Our SFG business is unique and offers: • Strong pipelines built on relationships • Complexity which creates significant barriers to entry by competitors • Consistent source of revenue in all economic cycles • Planned strategic use of securitization for long - term sustainability and growth $0 $2,000 $3,000 $4,000 2018 2019 2020 Low Income Housing Tax Credit Loans Municipal Bonds and Loans 2021 2022 Historic Tax Credit Loans Other 9/ 30/23 $1.2 $1,000 $0.9 $1.6 $2.2 $3.1 Loan and Bond Growth Breakdown ($B) $2.6 Specialty Finance Group (SFG) Providing Municipal and Tax Credit Financing Solutions $55.1

QCRH (LENDER) BORROWER / LOW INCOME HOUSING PROJECT TAX CREDIT EQUITY INVESTORS Loan Payments Tax Credits Equity Investment Loa n Rent STRONG BORROWERS • Experienced low - income housing developers • Tax credit investors are primarily other banks and corporate investors HIGH - QUALITY LOANS • Very strong Loan - To - Values • Very low historical industrywide defaults • 15 - year loans, utilizing back - to - back interest rate swaps OVERALL POSITIVE IMPACT • Helps QCRH manage interest rate risk • QCRH recognizes capital markets revenue • Increases the availability of much needed affordable housing • Significant contributor to CRA efforts Low Income Housing Tax Credit Loans 8

9 A Broad Scope of Wealth Management Services $11.4 $12.0 $12.6 $15.3 $14.5 $15.2 $0 $6 $12 $18 2018 2019 2020 2021 2022 9/ 30/23 (1) All data excludes Bates and RB&T. (2) Annualized Revenue ($M) (1)(2) $2.5 $3.1 $3.4 $4.2 $3.6 $3.8 $0.9 $1.0 $1.0 $1.2 $1.0 $1.1 $0 $2 $4 $6 2018 9/ 30/23 $4.1 $5.4 $4.6 Assets Under Management ($B) (1) Our wealth management structure and extensive scope of services cater to our client needs. • Diverse wealth management solutions serving a wide range of clients • Over 1,800 new relationships added over the last five years $3.4 $4.4 $4.9 502 273 206 321 340 Tr ust/Inv Mgmt Brokerage/RIA 220 2019 2020 2021 2022 Number of New Client Relationships Added

10 We Do Business in Vibrant Markets • Relationships matter and differentiate us from big banks • Robust commercial, industrial, and technology activity • Ability to gain prominent market share • Mid - sized metros 200K - 500K population MSAs • Strong demographics & highly educated workforce drive steady growth Market Share Deposits # Locations States/Region Entity #1 $2.0B 5 Iowa/Illinois - Quad Cities Quad City Bank & Trust #1 $1.7B 8 Iowa - Cedar Rapids/Cedar Valley Cedar Rapids Bank & Trust * #3 $1.7B 14 Missouri - Southwest Region Guaranty Bank #7 $1.1B 9 Iowa - Des Moines/ Ankeny Community State Bank Location and deposit data as of 9/30/23. Market share as of 6/30/23 * Cedar Rapids Bank & Trust includes Community Bank & Trust in the Cedar Valley.

11 $2.9 $3.5 $4.4 $4.9 $5.7 $6.1 $0.6 $0.3 $0.6 2016 2017 2018 2019 2020 2021 2022 9/30/23 TOTAL ASSETS ACQUIRED ASSETS $8.5 $7.9 $1.2 (1) Rockford Bank & Trust assets were removed from this data. (2) Includes $336.2 million of the assets of m2 Equipment Finance, as this entity is wholly - owned by and consolidated with Quad City Bank and Trust. $2.4 29% $2.4 29% $1.4 16% $2.2 26% Asset Distribution by Charter as of 9/30/23 ($B) Total Consolidated Assets ($B) (1) A Consistent Track Record of Asset Growth Asset growth has been driven by a combination of organic growth and strategic acquisitions. (2)

12 $1.3 $1.5 $1.7 $1.6 $1.7 $1.8 $1.6 $1.8 $2.1 $2.6 $3.7 $4.1 $0.1 $0.2 $0.1 $0.2 $0.1 $0.2 $0.1 $0.3 $0.1 $0.5 $0.1 $0.5 $0.1 $0.1 $0.1 $3.3 $4.3 $3.7 $4.7 $0.1 $6.1 $0.1 $6.6 $0.1 2018 2019 2020 2021 2022 9/30/23 Comme rcial & Industrial Comme rcial RE Dire ct Fin. Leases Residential RE Consumer & Other Loan Growth Driven by Commercial Lending Commercial Loans* Represent 91% of the Loan Portfolio ($B) as of 9/30/23 * Includes Commercial & Industrial, Commercial RE and Direct Financing Lease. Loan composition excludes deferred loan/lease origination costs, net of fees. Rockford Bank & Trust is excluded from this data. Totals may not add up due to rounding.

13 Our High - Performing CRE Portfolio CRE - Office 3% CRE - Non - office 24% Multi - Family 4% Construction & Land Dev 7% LIHTC 13% LIHTC - Construction 14% TOTAL CRE PORTFOLIO: $4.3 Billion • CRE IS 65% of total loans • CRE - Office represents only 3% of Total Loans • 14 loans > $3 million (total of $65 million) • Primarily smaller facilities (three stories or less) and located within the QCRH footprint • 99% of all CRE - Office is performing (1% or $318k NPA's) CRE - Office Key Takeaways:

14 Deposit Growth Driven by Core Deposits Core Deposits* Represent 96% of Total Deposits ($B) as of 9/30/23 * Core deposits are defined as total deposits less brokered deposits. Rockford Bank & Trust deposits excluded from this data. 34% 31% 25% 20% 21% 16% 48% 52% 60% 57% 65% 68% 15% 15% 13% 16% 12% 12% 3% 4% $3.5 $4.6 $4.9 $6.0 2% $6.5 $3.9 2% 2018 2019 2020 2021 2022 9/30/23 NONINTEREST - BEARING DEPOSITS INTEREST - BEARING DEPOSITS TIME DEPOSITS BROKERED DEPOSITS

15 Diversified and Granular Deposit Base Average Account Balance: $18,000 Portfolio Percentage: 29% Average Account Balance: $124,000 Portfolio Percentage: 62% Average Account Balance: $1,100,000 Portfolio Percentage: 9% As of 9/30/23. *Insured deposits represent FDIC insured, State insured, collateralized, or insured through the ICS/CDARS program deposits. CONSUMER DEPOSITS $1.9 Billion COMMERCIAL DEPOSITS $4.0 Billion CORRESPONDENT DEPOSITS $0.6 Billion Uninsured 15% Insured 85% Uninsured 19% Insured 81% Uninsured 44% Insured 56% QCRH TOTAL DEPOSITS: $6.5 Billion 80% of Total Deposits are Insured*

$0.1 $1.3 $0.2 $0.7 $0.1 $0.5 $1.4 Total Liquidity Sources (Ex. AFS and HTM Bonds) Total Uninsured Deposits * 16 Robust and Diverse Liquidity $3.0B $1.3B Dollars In billions. As of 9/30/23. *Uninsured deposits exclude deposits that are FDIC insured, State insured, collateralized, or insured through the ICS/CDARS program. Brokered Availability Based on Company Policy Fed Fund Lines Availability QCRH Line of Credit Availability Federal Reserve Availability Excess Cash FHLB Availability $1.1B Immediate Availability • Including unpledged AFS and HTM Bonds of approximately $868MM, our Total Liquidity is strong at nearly 46% of our Total Assets • Total available liquidity sources more than cover uninsured and uncollateralized deposits* • Active participant in ICS/CDARS deposit program for many years Key Takeaways:

17 Our Strong Capital Position QCRH is well - positioned for long - term success: • Successful subordinated debt raises in 2019, 2020 and 2022 bolstered total risk - based capital • Lowest dividend payout ratio in peer group retains capital for strong organic and M&A growth • Acquisition of Guaranty Bank in 2022 initially impacted capital ratios 7.78% 9.25% 9.08% 9.87% 7.93% 8.05% 10.69% 13.33% 14.95% 14.77% 14.28% 14.40% 4.00% 6.00% 8.00% 10.00% 12.00% 14.00% 16.00% 2018 2019 2020 2021 2022 * 9/30/23 ** TCE Ratio TRBC Ratio * Capital ratios impacted in Q2 of 2022 due to Guaranty Bank acquisition ** TRBC ratio at 9/30/23 is estimated. Adjusting our TCE ratio for net unrealized losses after tax on our HTM bond portfolio would equal 7.20%. Adjusting our TRBC ratio for AOCI and net unrealized losses after tax on our HTM bond portfolio would equal 12.47%. Tangible Common Equity & TRBC Ratios

18 Top Tier TBVPS Growth * TBVPS of $40.68 and $45.19 for 2022 and 9/30/23 excludes the impact of AOCI. ** KRX calculated as the median of the current 50 KRX constituents excluding PACW as of June 30, 2023. QCRH TBVPS ($) TBVPS (%) $14.70 $15.92 $17.08 $14.29 $17.50 $22.70 $20.11 $18.81 $24.04 $38.02 $36.82 $32.16 $28.15 $40.33 $45.19 $40.68 $0 $25 $50 KRX** 4.1% 11.5% 5 - year 4.6% 11.2% 10 - year 4.4% 7.3% 20 - year

19 NPAs / Assets Focused on maintaining excellent asset quality and resolving problem assets, resulting in: • Better than peer historical loss rates • Conservative reserve for credit losses • Strategy to aggressively manage problem credits • Average NPAs of 0.90% over the past 20 years 0.81% 0.56% 0.27% 0.25% 0.11% 0.05% 0.41% 0.00% 0.30% 0.60% 0.90% 2017 2018 2019 2020 2021 2022 9/30/23 1.98% 1.68% 1.43% 1.39% 1.46% 1.43% 1.24% 2020 2021 2022 9/30/23 QCRH Proxy Peers ACL – Loans HFI/Total Loans (%) Strong Credit Culture Supported by High Levels of Reserves

20 Consistent Improvement in Shareholder Returns $46 $59 $63 $100 $115 $109 $3.08 $3.66 $3.96 $6.27 $6.80 $6.46 2018 2019 2020 2021 2022 9/30/23* Adjusted Net Income Adjusted EPS Note: All data excludes Rockford Bank & Trust and 2019 excludes $12.3 million gain on sale from the RB&T transaction. * Annualized • Top quartile ROAA and ROAE performance • Adjusted ROAA grew from 1.06% in 2018 to 1.36% YTD Q3 2023 • Adjusted ROAE grew from 11.43% in 2018 to 13.35% YTD Q3 2023 • Efficiency ratio improved from 64.77% in 2018 to 59.78% YTD Q3 2023 Adjusted Net Income/Earnings Per Share
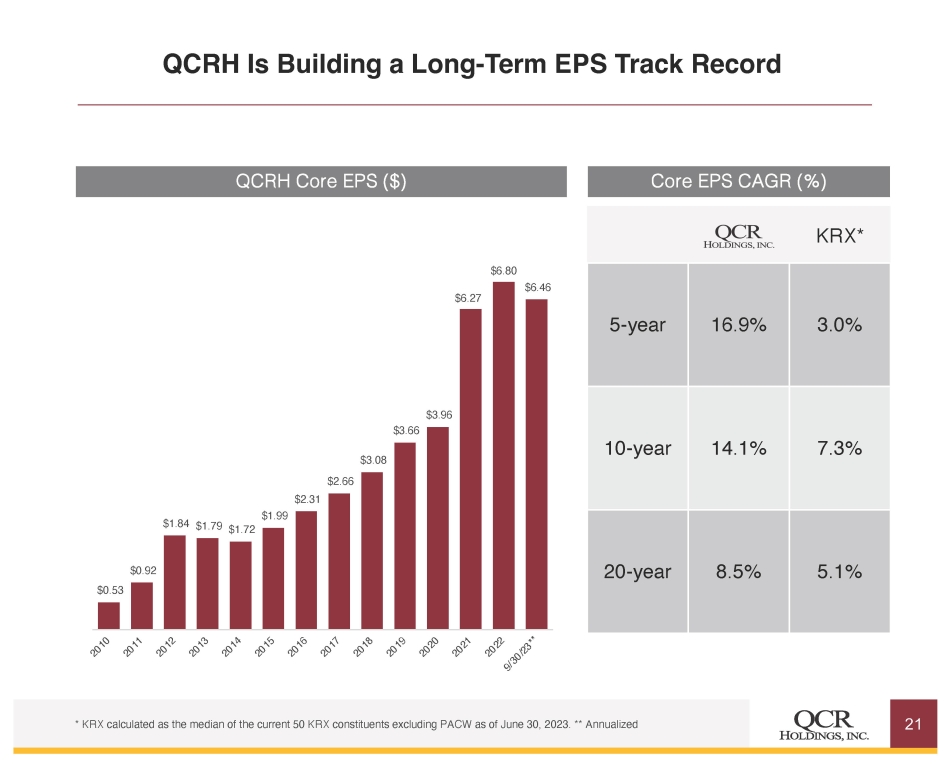
21 QCRH Is Building a Long - Term EPS Track Record QCRH Core EPS ($) Core EPS CAGR (%) KRX* 3.0% 16.9% 5 - year 7.3% 14.1% 10 - year 5.1% 8.5% 20 - year $0.92 $0.53 $1.84 $1.79 $1.72 $1.99 $3.96 $3.66 $3.08 $2.66 $2.31 $6.80 $6.46 $6.27 * KRX calculated as the median of the current 50 KRX constituents excluding PACW as of June 30, 2023. ** Annualized

This page intentionally left blank


3551 7 th Street, Moline IL 61265 © Copyright 2023 QCR Holdings, Inc. All Rights Reserved
v3.23.3
| X |
- DefinitionBoolean flag that is true when the XBRL content amends previously-filed or accepted submission.
| Name: |
dei_AmendmentFlag |
| Namespace Prefix: |
dei_ |
| Data Type: |
xbrli:booleanItemType |
| Balance Type: |
na |
| Period Type: |
duration |
|
| X |
- DefinitionFor the EDGAR submission types of Form 8-K: the date of the report, the date of the earliest event reported; for the EDGAR submission types of Form N-1A: the filing date; for all other submission types: the end of the reporting or transition period. The format of the date is YYYY-MM-DD.
| Name: |
dei_DocumentPeriodEndDate |
| Namespace Prefix: |
dei_ |
| Data Type: |
xbrli:dateItemType |
| Balance Type: |
na |
| Period Type: |
duration |
|
| X |
- DefinitionThe type of document being provided (such as 10-K, 10-Q, 485BPOS, etc). The document type is limited to the same value as the supporting SEC submission type, or the word 'Other'.
| Name: |
dei_DocumentType |
| Namespace Prefix: |
dei_ |
| Data Type: |
dei:submissionTypeItemType |
| Balance Type: |
na |
| Period Type: |
duration |
|
| X |
- DefinitionAddress Line 1 such as Attn, Building Name, Street Name
| Name: |
dei_EntityAddressAddressLine1 |
| Namespace Prefix: |
dei_ |
| Data Type: |
xbrli:normalizedStringItemType |
| Balance Type: |
na |
| Period Type: |
duration |
|
| X |
- Definition
+ References
+ Details
| Name: |
dei_EntityAddressCityOrTown |
| Namespace Prefix: |
dei_ |
| Data Type: |
xbrli:normalizedStringItemType |
| Balance Type: |
na |
| Period Type: |
duration |
|
| X |
- DefinitionCode for the postal or zip code
| Name: |
dei_EntityAddressPostalZipCode |
| Namespace Prefix: |
dei_ |
| Data Type: |
xbrli:normalizedStringItemType |
| Balance Type: |
na |
| Period Type: |
duration |
|
| X |
- DefinitionName of the state or province.
| Name: |
dei_EntityAddressStateOrProvince |
| Namespace Prefix: |
dei_ |
| Data Type: |
dei:stateOrProvinceItemType |
| Balance Type: |
na |
| Period Type: |
duration |
|
| X |
- DefinitionA unique 10-digit SEC-issued value to identify entities that have filed disclosures with the SEC. It is commonly abbreviated as CIK. Reference 1: http://www.xbrl.org/2003/role/presentationRef
-Publisher SEC
-Name Exchange Act
-Number 240
-Section 12
-Subsection b-2
| Name: |
dei_EntityCentralIndexKey |
| Namespace Prefix: |
dei_ |
| Data Type: |
dei:centralIndexKeyItemType |
| Balance Type: |
na |
| Period Type: |
duration |
|
| X |
- DefinitionIndicate if registrant meets the emerging growth company criteria. Reference 1: http://www.xbrl.org/2003/role/presentationRef
-Publisher SEC
-Name Exchange Act
-Number 240
-Section 12
-Subsection b-2
| Name: |
dei_EntityEmergingGrowthCompany |
| Namespace Prefix: |
dei_ |
| Data Type: |
xbrli:booleanItemType |
| Balance Type: |
na |
| Period Type: |
duration |
|
| X |
- DefinitionCommission file number. The field allows up to 17 characters. The prefix may contain 1-3 digits, the sequence number may contain 1-8 digits, the optional suffix may contain 1-4 characters, and the fields are separated with a hyphen.
| Name: |
dei_EntityFileNumber |
| Namespace Prefix: |
dei_ |
| Data Type: |
dei:fileNumberItemType |
| Balance Type: |
na |
| Period Type: |
duration |
|
| X |
- DefinitionTwo-character EDGAR code representing the state or country of incorporation.
| Name: |
dei_EntityIncorporationStateCountryCode |
| Namespace Prefix: |
dei_ |
| Data Type: |
dei:edgarStateCountryItemType |
| Balance Type: |
na |
| Period Type: |
duration |
|
| X |
- DefinitionThe exact name of the entity filing the report as specified in its charter, which is required by forms filed with the SEC. Reference 1: http://www.xbrl.org/2003/role/presentationRef
-Publisher SEC
-Name Exchange Act
-Number 240
-Section 12
-Subsection b-2
| Name: |
dei_EntityRegistrantName |
| Namespace Prefix: |
dei_ |
| Data Type: |
xbrli:normalizedStringItemType |
| Balance Type: |
na |
| Period Type: |
duration |
|
| X |
- DefinitionThe Tax Identification Number (TIN), also known as an Employer Identification Number (EIN), is a unique 9-digit value assigned by the IRS. Reference 1: http://www.xbrl.org/2003/role/presentationRef
-Publisher SEC
-Name Exchange Act
-Number 240
-Section 12
-Subsection b-2
| Name: |
dei_EntityTaxIdentificationNumber |
| Namespace Prefix: |
dei_ |
| Data Type: |
dei:employerIdItemType |
| Balance Type: |
na |
| Period Type: |
duration |
|
| X |
- DefinitionLocal phone number for entity.
| Name: |
dei_LocalPhoneNumber |
| Namespace Prefix: |
dei_ |
| Data Type: |
xbrli:normalizedStringItemType |
| Balance Type: |
na |
| Period Type: |
duration |
|
| X |
- DefinitionBoolean flag that is true when the Form 8-K filing is intended to satisfy the filing obligation of the registrant as pre-commencement communications pursuant to Rule 13e-4(c) under the Exchange Act. Reference 1: http://www.xbrl.org/2003/role/presentationRef
-Publisher SEC
-Name Exchange Act
-Number 240
-Section 13e
-Subsection 4c
| Name: |
dei_PreCommencementIssuerTenderOffer |
| Namespace Prefix: |
dei_ |
| Data Type: |
xbrli:booleanItemType |
| Balance Type: |
na |
| Period Type: |
duration |
|
| X |
- DefinitionBoolean flag that is true when the Form 8-K filing is intended to satisfy the filing obligation of the registrant as pre-commencement communications pursuant to Rule 14d-2(b) under the Exchange Act. Reference 1: http://www.xbrl.org/2003/role/presentationRef
-Publisher SEC
-Name Exchange Act
-Number 240
-Section 14d
-Subsection 2b
| Name: |
dei_PreCommencementTenderOffer |
| Namespace Prefix: |
dei_ |
| Data Type: |
xbrli:booleanItemType |
| Balance Type: |
na |
| Period Type: |
duration |
|
| X |
- DefinitionTitle of a 12(b) registered security. Reference 1: http://www.xbrl.org/2003/role/presentationRef
-Publisher SEC
-Name Exchange Act
-Number 240
-Section 12
-Subsection b
| Name: |
dei_Security12bTitle |
| Namespace Prefix: |
dei_ |
| Data Type: |
dei:securityTitleItemType |
| Balance Type: |
na |
| Period Type: |
duration |
|
| X |
- DefinitionName of the Exchange on which a security is registered. Reference 1: http://www.xbrl.org/2003/role/presentationRef
-Publisher SEC
-Name Exchange Act
-Number 240
-Section 12
-Subsection d1-1
| Name: |
dei_SecurityExchangeName |
| Namespace Prefix: |
dei_ |
| Data Type: |
dei:edgarExchangeCodeItemType |
| Balance Type: |
na |
| Period Type: |
duration |
|
| X |
- DefinitionBoolean flag that is true when the Form 8-K filing is intended to satisfy the filing obligation of the registrant as soliciting material pursuant to Rule 14a-12 under the Exchange Act. Reference 1: http://www.xbrl.org/2003/role/presentationRef
-Publisher SEC
-Name Exchange Act
-Section 14a
-Number 240
-Subsection 12
| Name: |
dei_SolicitingMaterial |
| Namespace Prefix: |
dei_ |
| Data Type: |
xbrli:booleanItemType |
| Balance Type: |
na |
| Period Type: |
duration |
|
| X |
- DefinitionTrading symbol of an instrument as listed on an exchange.
| Name: |
dei_TradingSymbol |
| Namespace Prefix: |
dei_ |
| Data Type: |
dei:tradingSymbolItemType |
| Balance Type: |
na |
| Period Type: |
duration |
|
| X |
- DefinitionBoolean flag that is true when the Form 8-K filing is intended to satisfy the filing obligation of the registrant as written communications pursuant to Rule 425 under the Securities Act. Reference 1: http://www.xbrl.org/2003/role/presentationRef
-Publisher SEC
-Name Securities Act
-Number 230
-Section 425
| Name: |
dei_WrittenCommunications |
| Namespace Prefix: |
dei_ |
| Data Type: |
xbrli:booleanItemType |
| Balance Type: |
na |
| Period Type: |
duration |
|
QCR (NASDAQ:QCRH)
Historical Stock Chart
From Apr 2024 to May 2024

QCR (NASDAQ:QCRH)
Historical Stock Chart
From May 2023 to May 2024
