false
0000795266
DEF 14A
0000795266
2022-12-01
2023-11-30
0000795266
2021-12-01
2022-11-30
0000795266
2020-12-01
2021-11-30
0000795266
ecd:PeoMember
kbh:GrantDateFairValueOfStockAwardsFromSummaryCompensationTableMember
2022-12-01
2023-11-30
0000795266
ecd:NonPeoNeoMember
kbh:GrantDateFairValueOfStockAwardsFromSummaryCompensationTableMember
2022-12-01
2023-11-30
0000795266
ecd:PeoMember
kbh:GrantDateFairValueOfStockAwardsFromSummaryCompensationTableMember
2021-12-01
2022-11-30
0000795266
ecd:NonPeoNeoMember
kbh:GrantDateFairValueOfStockAwardsFromSummaryCompensationTableMember
2021-12-01
2022-11-30
0000795266
ecd:PeoMember
kbh:GrantDateFairValueOfStockAwardsFromSummaryCompensationTableMember
2020-12-01
2021-11-30
0000795266
ecd:NonPeoNeoMember
kbh:GrantDateFairValueOfStockAwardsFromSummaryCompensationTableMember
2020-12-01
2021-11-30
0000795266
ecd:PeoMember
kbh:FairValueOfEquityAwardsGrantedInTheYearAndUnvestedAsOfYearEndMember
2022-12-01
2023-11-30
0000795266
ecd:NonPeoNeoMember
kbh:FairValueOfEquityAwardsGrantedInTheYearAndUnvestedAsOfYearEndMember
2022-12-01
2023-11-30
0000795266
ecd:PeoMember
kbh:FairValueOfEquityAwardsGrantedInTheYearAndUnvestedAsOfYearEndMember
2021-12-01
2022-11-30
0000795266
ecd:NonPeoNeoMember
kbh:FairValueOfEquityAwardsGrantedInTheYearAndUnvestedAsOfYearEndMember
2021-12-01
2022-11-30
0000795266
ecd:PeoMember
kbh:FairValueOfEquityAwardsGrantedInTheYearAndUnvestedAsOfYearEndMember
2020-12-01
2021-11-30
0000795266
ecd:NonPeoNeoMember
kbh:FairValueOfEquityAwardsGrantedInTheYearAndUnvestedAsOfYearEndMember
2020-12-01
2021-11-30
0000795266
ecd:PeoMember
kbh:IncreaseDecreaseInFairValueFromPriorYearEndOfOutstandingAndUnvestedAwardsGrantedInPriorYearsMember
2022-12-01
2023-11-30
0000795266
ecd:NonPeoNeoMember
kbh:IncreaseDecreaseInFairValueFromPriorYearEndOfOutstandingAndUnvestedAwardsGrantedInPriorYearsMember
2022-12-01
2023-11-30
0000795266
ecd:PeoMember
kbh:IncreaseDecreaseInFairValueFromPriorYearEndOfOutstandingAndUnvestedAwardsGrantedInPriorYearsMember
2021-12-01
2022-11-30
0000795266
ecd:NonPeoNeoMember
kbh:IncreaseDecreaseInFairValueFromPriorYearEndOfOutstandingAndUnvestedAwardsGrantedInPriorYearsMember
2021-12-01
2022-11-30
0000795266
ecd:PeoMember
kbh:IncreaseDecreaseInFairValueFromPriorYearEndOfOutstandingAndUnvestedAwardsGrantedInPriorYearsMember
2020-12-01
2021-11-30
0000795266
ecd:NonPeoNeoMember
kbh:IncreaseDecreaseInFairValueFromPriorYearEndOfOutstandingAndUnvestedAwardsGrantedInPriorYearsMember
2020-12-01
2021-11-30
0000795266
ecd:PeoMember
kbh:IncreaseDecreaseInFairValueFromPriorYearEndOfVestedAwardsGrantedInPriorYearsMember
2022-12-01
2023-11-30
0000795266
ecd:NonPeoNeoMember
kbh:IncreaseDecreaseInFairValueFromPriorYearEndOfVestedAwardsGrantedInPriorYearsMember
2022-12-01
2023-11-30
0000795266
ecd:PeoMember
kbh:IncreaseDecreaseInFairValueFromPriorYearEndOfVestedAwardsGrantedInPriorYearsMember
2021-12-01
2022-11-30
0000795266
ecd:NonPeoNeoMember
kbh:IncreaseDecreaseInFairValueFromPriorYearEndOfVestedAwardsGrantedInPriorYearsMember
2021-12-01
2022-11-30
0000795266
ecd:PeoMember
kbh:IncreaseDecreaseInFairValueFromPriorYearEndOfVestedAwardsGrantedInPriorYearsMember
2020-12-01
2021-11-30
0000795266
ecd:NonPeoNeoMember
kbh:IncreaseDecreaseInFairValueFromPriorYearEndOfVestedAwardsGrantedInPriorYearsMember
2020-12-01
2021-11-30
0000795266
ecd:PeoMember
kbh:DividendsPaidOnAwardsDuringTheYearBeforeVestingMember
2022-12-01
2023-11-30
0000795266
ecd:NonPeoNeoMember
kbh:DividendsPaidOnAwardsDuringTheYearBeforeVestingMember
2022-12-01
2023-11-30
0000795266
ecd:PeoMember
kbh:DividendsPaidOnAwardsDuringTheYearBeforeVestingMember
2021-12-01
2022-11-30
0000795266
ecd:NonPeoNeoMember
kbh:DividendsPaidOnAwardsDuringTheYearBeforeVestingMember
2021-12-01
2022-11-30
0000795266
ecd:PeoMember
kbh:DividendsPaidOnAwardsDuringTheYearBeforeVestingMember
2020-12-01
2021-11-30
0000795266
ecd:NonPeoNeoMember
kbh:DividendsPaidOnAwardsDuringTheYearBeforeVestingMember
2020-12-01
2021-11-30
0000795266
ecd:PeoMember
kbh:ChangeInPensionValueAndNonqualifiedDeferredCompensationEarningsFromSummaryCompensationTableMember
2022-12-01
2023-11-30
0000795266
ecd:NonPeoNeoMember
kbh:ChangeInPensionValueAndNonqualifiedDeferredCompensationEarningsFromSummaryCompensationTableMember
2022-12-01
2023-11-30
0000795266
ecd:PeoMember
kbh:ChangeInPensionValueAndNonqualifiedDeferredCompensationEarningsFromSummaryCompensationTableMember
2021-12-01
2022-11-30
0000795266
ecd:NonPeoNeoMember
kbh:ChangeInPensionValueAndNonqualifiedDeferredCompensationEarningsFromSummaryCompensationTableMember
2021-12-01
2022-11-30
0000795266
ecd:PeoMember
kbh:ChangeInPensionValueAndNonqualifiedDeferredCompensationEarningsFromSummaryCompensationTableMember
2020-12-01
2021-11-30
0000795266
ecd:NonPeoNeoMember
kbh:ChangeInPensionValueAndNonqualifiedDeferredCompensationEarningsFromSummaryCompensationTableMember
2020-12-01
2021-11-30
0000795266
ecd:PeoMember
kbh:ServiceCostForPensionPlansMember
2022-12-01
2023-11-30
0000795266
ecd:NonPeoNeoMember
kbh:ServiceCostForPensionPlansMember
2022-12-01
2023-11-30
0000795266
ecd:PeoMember
kbh:ServiceCostForPensionPlansMember
2021-12-01
2022-11-30
0000795266
ecd:NonPeoNeoMember
kbh:ServiceCostForPensionPlansMember
2021-12-01
2022-11-30
0000795266
ecd:PeoMember
kbh:ServiceCostForPensionPlansMember
2020-12-01
2021-11-30
0000795266
ecd:NonPeoNeoMember
kbh:ServiceCostForPensionPlansMember
2020-12-01
2021-11-30
0000795266
ecd:PeoMember
kbh:MrMezgerMember
2022-12-01
2023-11-30
0000795266
ecd:PeoMember
kbh:MrMezgerMember
2021-12-01
2022-11-30
0000795266
ecd:PeoMember
kbh:MrMezgerMember
2020-12-01
2021-11-30
0000795266
ecd:NonPeoNeoMember
kbh:KaminskiMember
2022-12-01
2023-11-30
0000795266
ecd:NonPeoNeoMember
kbh:KaminskiMember
2021-12-01
2022-11-30
0000795266
ecd:NonPeoNeoMember
kbh:McGibneyMember
2021-12-01
2022-11-30
0000795266
ecd:NonPeoNeoMember
kbh:McGibneyMember
2022-12-01
2023-11-30
0000795266
ecd:NonPeoNeoMember
kbh:PrawMember
2022-12-01
2023-11-30
0000795266
ecd:NonPeoNeoMember
kbh:PrawMember
2021-12-01
2022-11-30
0000795266
ecd:NonPeoNeoMember
kbh:WoramMember
2021-12-01
2022-11-30
0000795266
ecd:NonPeoNeoMember
kbh:WoramMember
2022-12-01
2023-11-30
0000795266
ecd:NonPeoNeoMember
kbh:KaminskiMember
2020-12-01
2021-11-30
0000795266
ecd:NonPeoNeoMember
kbh:McGibneyMember
2020-12-01
2021-11-30
0000795266
ecd:NonPeoNeoMember
kbh:PrawMember
2020-12-01
2021-11-30
0000795266
ecd:NonPeoNeoMember
kbh:MatthewWMandinoMember
2020-12-01
2021-11-30
0000795266
1
2022-12-01
2023-11-30
0000795266
2
2022-12-01
2023-11-30
0000795266
3
2022-12-01
2023-11-30
0000795266
4
2022-12-01
2023-11-30
0000795266
5
2022-12-01
2023-11-30
iso4217:USD
xbrli:shares
iso4217:USD
xbrli:shares
xbrli:pure
UNITED STATES
SECURITIES AND EXCHANGE COMMISSION
Washington, DC 20549
SCHEDULE 14A
PROXY STATEMENT PURSUANT TO SECTION 14(a)
OF THE SECURITIES EXCHANGE ACT OF 1934
(Amendment No. )
 |
Filed by the Registrant |
 |
Filed by a Party other than the Registrant |
| Check the appropriate box: |
|
Preliminary Proxy Statement |
|
Confidential, for Use of the Commission Only (as permitted by Rule 14A-6(E)(2)) |
|
Definitive Proxy Statement |
|
Definitive Additional Materials |
|
Soliciting Material under §240.14a-12 |
KB HOME

(Name of Registrant as Specified in Its Charter)
(Name of Person(s) Filing Proxy Statement, if
other than the Registrant)
| Payment of Filing Fee (Check all boxes that apply): |
|
No fee required. |
|
Fee paid previously with preliminary materials. |
|
Fee computed on table in exhibit required by Item 25(b) per Exchange Act Rules 14a-6(i)(1) and 0-11. |

Dear Fellow Stockholder:
Together with the Board of Directors and
the management team of KB Home, I am pleased to invite you to participate in our 2024 Annual Meeting of Stockholders. The meeting
will be conducted through an online webcast at 9:00 a.m. Pacific Time on Thursday, April 18, 2024.
2023 in Review
The KB Home team delivered healthy results
in 2023, as we successfully navigated fluctuating market conditions, maintaining our focus on the long term. We were steadfast
in our commitments to taking care of our customers, protecting and further building our brand, positioning the Company for profitable
growth, and advancing our award-winning sustainability program.
Reflecting on 2023, I am reminded of the
remarkable contrast between how the year began and ended. With the start of the year characterized by a continuing soft demand
environment resulting primarily from higher mortgage interest rates, our initial 2023 guidance projected about $5.5 billion
in housing revenues, equating to roughly 11,400 deliveries. We achieved much stronger results, closing 13,236 homes and generating
revenues of $6.4 billion. Two important areas of focus in 2023 were lowering our costs to build and compressing our build
times——aspects of our business that had been significantly impacted by the supply chain challenges of the prior few
years——and we successfully executed in both areas. In addition, we took steps to work with our buyers on affordability,
as they adjusted to the higher rates. Our results, along with the repurchase of 11% of our shares outstanding since the
start of the year, contributed to diluted earnings per share of $7.03 and 15% growth in our book value per share in 2023 to $50.22.
Together with expanding our scale, returning
capital to stockholders has become one of our key priorities in allocating the substantial cash that our business generates. We
remain focused on striking an appropriate balance in managing these priorities. In 2023, we invested $1.8 billion to acquire and
develop land and returned nearly $470 million in cash to stockholders primarily through share repurchases, as well as our regular
quarterly dividend, which we increased by approximately 33% in July 2023.
Building for the Future
Our vision is to be the most customer-obsessed
homebuilder in the world. We partner with our customers to help them achieve their dreams of homeownership, creating a highly satisfying
experience through a compelling, simple, and personalized homebuying process distinguished by phenomenal customer service. I am
proud that in 2023, we maintained our status as the #1 customer-ranked national homebuilder, based on buyer satisfaction surveys
on TrustBuilder®, a third-party, industry-specific homeowner review site. Rankings are established entirely on direct
responses from homebuyers, reinforcing that our distinct homebuying experience resonates with them. Ensuring we operate our business
in alignment
with our values is one of the most impactful ways we can continue building a bigger and more profitable Company in
the future.
Sustainability is another way in which we
are building for the future, and it is an area in which we have led our industry for 17 years. We endeavor to find ways to offer
energy- and water-efficient features that conserve resources while lowering the total cost of homeownership. We call it “doing
well by doing good”——a philosophy that has resulted in national recognition of our achievements. We successfully
executed on several key initiatives during the last year, and I encourage you to learn more about what we are doing to drive a
more sustainable future by visiting our website. In addition, our 17th Annual Sustainability Report, the longest-running publication
of its kind for a national homebuilder, is slated for publication in April.
Closing Thoughts
We believe the long-term outlook for the
new housing market remains favorable, driven by low existing home inventory levels, solid employment and wage growth. Demographics
have been and, we expect will continue to be, a significant factor, with the largest generational cohorts, millennials and Gen
Z’s, demonstrating a strong desire for homeownership. We have built a solidly profitable business, based upon our highly
personalized, customer-oriented and differentiating Built to Order business model, with a recognized brand that consumers trust.
Our talented and long-tenured management team is ready to lead our Company forward, and we have demonstrated the ability to navigate
varying market conditions with a thoughtful approach focused on the long term. With a solid backlog in place, we believe we are
well positioned to achieve our delivery target for 2024. We anticipate achieving double-digit growth in our ending community count
this year and expect our cash generation, as well as solid liquidity, will enable us to invest in our future growth while continuing
to return capital to stockholders.
I am excited about the Company’s future,
as the KB Home team remains committed to managing our business to drive long-term stockholder value. Together with our Board of
Directors, we sincerely thank you for your investment and continued support.
Sincerely,

JEFFREY T. MEZGER
Chairman and Chief Executive Officer
March 8, 2024
| KB Home ■ 2024 Proxy Statement |
1 |
Notice
of 2024 Annual Meeting
of Stockholders
Thursday, April 18, 2024
9:00 a.m., Pacific Time
Webcast Meeting Location:
meetnow.global/M9X547D
| Items
of Business |
| 1. |
Elect
nine directors for a one-year term. |
| 2. |
Advisory vote to approve
named executive officer compensation. |
| 3. |
Ratify Ernst & Young LLP’s appointment as KB Home’s
independent registered public accounting firm for the fiscal year ending November 30, 2024. |
The accompanying Proxy Statement describes
these items in more detail. We have not received notice of any other matters that may be properly presented at the meeting.
Record Date
You are entitled to vote at the meeting
and any adjournment or postponement of the meeting if you were a stockholder as of the close of business on February 26, 2024.
By order of the Board of Directors,

WILLIAM A. (TONY) RICHELIEU
Vice President, Corporate Secretary and
Associate General Counsel
Los Angeles, California
March 8, 2024
Voting
Please vote as soon as possible to ensure
your shares will be represented. Holders of record may vote via the Internet, telephone or mail. Stockholders whose shares are
held by an intermediate broker or financial institution, also called beneficial holders, must vote in the way their intermediary
provides. Holders with a control number from our transfer agent can vote at the meeting.
Virtual Meeting Format
The meeting will be conducted online through
an audio-only webcast. The accompanying Proxy Statement contains information about participating in the meeting. The meeting will
have no physical location.
Annual Report
Our Annual Report on Form 10-K for the
fiscal year ended November 30, 2023 (“Annual Report”), including audited financial statements, is being made available
to stockholders concurrently with the accompanying Proxy Statement on or about March 8, 2024.
| Important Notice Regarding the Availability of Proxy Materials for the Stockholder Meeting to be Held on April 18, 2024: Our Proxy Statement and Annual Report are available at www.kbhome.com/investor/proxy. |
| KB Home ■ 2024 Proxy Statement |
3 |
2024 Annual Meeting Summary
Your Board is furnishing this Proxy Statement
and a proxy/voting instruction form or Notice of Internet Availability to solicit your proxy for KB Home’s 2024 Annual
Meeting of Stockholders (“Annual Meeting”). We anticipate these proxy materials will be made available to stockholders
on or about March 8, 2024 and filed with the Securities and Exchange Commission (“SEC”) on the same date. Below is
summary information about the Annual Meeting. Please review all the information in this Proxy Statement before voting.
Annual Meeting Information
 |
 |
| Date & Time |
Location: |
| |
|
Thursday, April 18, 2024
9:00 a.m., Pacific Time |
Audio-only Webcast Meeting at
meetnow.global/M9X547D |
Meeting Agenda
| Items
of Business |
|
Board
Recommendation |
|
Voting
Standard |
| Election of Directors |
|
 |
FOR
each of the nine nominees |
|
Majority of Votes Cast |
| Advisory vote to approve named executive officer (“NEO”) compensation, also known as “Say-on-Pay” |
|
 |
FOR |
|
Majority of Shares Present and Entitled to Vote |
| Ratify Ernst & Young LLP’s appointment as KB Home’s independent registered public accounting firm (“Independent Auditor”) for the fiscal year ending November 30, 2024 |
|
|
FOR |
|
Majority of Shares Present and Entitled to Vote |
Participating in the Annual Meeting Webcast
The Annual Meeting webcast at meetnow.global/M9X547D
will open at approximately 8:45 a.m., Pacific Time, on April 18, 2024. To access the audio-only meeting, vote and ask questions,
you will need a valid control number from our transfer agent, Computershare. Holders of record will receive their control number
on the notice or proxy card Computershare distributes to them.
Questions may be submitted before or during
the Annual Meeting. To submit a question in advance, visit meetnow.global/M9X547D before 8:59 p.m., Pacific Time, on April 17,
2024, and enter a valid control number. We will endeavor to answer as many stockholder questions as time permits. However, we may
not respond to questions that are not pertinent to Annual Meeting matters or our business. Single responses to a group of
substantially similar questions may be provided to avoid repetition. We ask attendees to help us keep the proceedings orderly by
following the meeting rules of conduct.
If you are a beneficial holder, meaning
an intermediate broker or financial institution holds your shares, you must register with Computershare no later than 5:00 p.m.,
Eastern Time, on April 15, 2024, to be able to vote and ask questions at the Annual Meeting. To register, please
provide Computershare with proof of your KB Home stockholdings, known as a legal proxy, obtained from your broker or financial
institution, along with your name and email address. Send the items by email to legalproxy@computershare.com (use KB Home Legal
Proxy in the subject line); or by mail to: Computershare, KB Home Legal Proxy, P.O. Box 43001; Providence, RI 02940-3001.
Computershare will email you confirmation of your registration.
Beneficial holders who cannot obtain a
legal proxy can attend the Annual Meeting as a guest at the above-noted Internet address, but they will not be able to vote or
ask questions.
| KB
Home ■ 2024 Proxy Statement |
4 |

| Our Values |
| |
 |
We make relationships the foundation for all we do.
It takes strong relationships to build a
home. To build a strong relationship it takes respect, integrity, and open and honest communication. Our employees are the heart
and soul of KB, and that belief in relationships defines how we behave toward each other, how we treat our customers through every
step of the process, and, how we work with our suppliers, trade, and municipality partners.
|
 |
We build homes that make lives better.
Innovative design and quality construction
standards are the cornerstones of our brand. Behind our continuous drive to build exceptional homes is a passion for the wellbeing
of those who live in them. From architecture to construction to customer service, we care about making our buyers’ lives
more comfortable, convenient, and healthy. That’s how we lead the industry in customer satisfaction, and strive to keep it
that way.
|
 |
We believe that everyone deserves a home
that’s as unique as they are.
Our business model is built on a simple,
yet radical idea: a house becomes your home when it’s an expression of who you are. That’s why we give our customers
the ability to choose — from homesite to elevation, from floor plan to design options — and a buying experience that’s
personalized from end-to-end.
|
 |
We deliver more for less.
We believe that every customer deserves a
home that lives up to their dreams. That’s why it’s our shared responsibility to ensure that what we build delivers
great value, so that every customer gets a home — and a homebuying experience — that can exceed their expectations
without exceeding their budget. It’s a disciplined and responsible approach to homebuilding that’s good for our homebuyers
and our business.
|
 |
We strive for a better shared future.
From individuals, to families, to whole communities,
our collective actions can have a beneficial impact on the world. We believe that every decision we make, from how we manage our
workplace, to how we run our operations, has the potential to advance environmental, social, and economic sustainability.
|
| KB Home ■ 2024 Proxy Statement |
5 |
Corporate Governance and Board Matters
The Board has
established an appropriate governance framework to oversee the management of our business, as summarized below.(1)

Independence |
■
All
directors, except for
our Chief Executive Officer
(“CEO”),
are independent.
■
The
Lead Independent Director position has significant responsibilities and authority, as described below.
■
Only
independent directors serve on Board committees.
■
During
2023, there were no Related Party Transactions (as described in Annex 1).
|

Accountability |
■
All
directors are elected on an annual basis under a majority voting standard.
■
We
have one class of voting securities allowing each holder one vote for each share held, and no supermajority voting requirements
(except per Delaware law, our state of incorporation).
■
We
proactively engage with our stockholders year-round on our business strategy, performance and outlook.
■
Directors
and senior executives are subject to significant stock ownership requirements, and they and all employees may not pledge
or hedge holdings of our securities.
■
Executive
officers are subject to an incentive-based compensation recovery policy, and all unvested employee equity awards require
double-trigger vesting in a change in control.
|

2023
Meetings
and Attendance |
■
The
Board held five meetings and also acted by unanimous written consent.
■
The
Audit and Compliance Committee held six meetings.
■
The
Management Development and Compensation Committee held six meetings.
■
The
Nominating and Corporate Governance Committee held five meetings.
■
Each
incumbent director standing for election attended at least 75% of his or her total Board and committee meetings.
■
We
expect directors to attend our annual stockholder meetings. All directors attended our 2023 annual meeting.
|

Effectiveness
Standards |
■
No
more than one director may be an employee.
■
Non-employee
directors hold an executive session without management at each regularly scheduled Board meeting.
■
Directors
must retire as of the first Annual Meeting following their 75th birthday. Our directors’ average age is 61.
■
Directors
may not serve on more than five other public company boards or, if they are a public company chief executive officer,
on more than two other public company boards. No directors are over-boarded.
■
The
Board and each of its standing committees conduct an annual self-evaluation of its performance.
|
Board and Committee Governance Structure
Board Leadership
Jeffrey T. Mezger, our CEO, has served as
Chairman of the Board since 2016. The non-employee directors have elected Mr. Mezger as Chairman based on their belief that with
his fundamental understanding of our business model and effective operational leadership, combining the Chairman and CEO roles
enhances our ability to achieve our long-term strategic and operational objectives more so than separating the roles. Board governance
is balanced with a strong Lead Independent Director position, which is designed to maintain the Board’s independent oversight.
Melissa Lora has served as Lead Independent Director since 2016 and will continue to do so through her current term.
Lead Independent Director Key Duties
| ■ | Presides at all Board meetings where the
Chairman is not present and at all executive sessions and meetings of the non-employee directors, which may be called at any time
and for any purpose. |
| ■ | Consults with the Chairman and the non-employee
directors regarding meeting agendas and schedules, as well as the content and flow of information to the Board. |
| ■ | Provides Board leadership if there is (or
there is perceived to be) a conflict of interest with respect to the role of the Chairman who is also the CEO. |
| ■ | If requested by major stockholders, being
available to them for consultation and communication as appropriate. |
| ■ | Any additional duties set forth in our
Corporate Governance Principles or By-Laws, or as the Board may determine from time to time. |
| (1) | Additional information about our corporate
governance policies, processes and procedures is provided in Annex 1 |
| KB Home ■ 2024 Proxy Statement |
6 |
Our Board’s Risk Oversight Role
Our Board is elected by our stockholders
to oversee the management of our business and affairs and assure stockholders’ long-term interests are being served. Among
other specified activities, the Board as a whole, or through its standing committees, reviews assessments of and senior management’s
plans with respect to significant risks we face. As described under “Commitment to Sustainability,” the Board
oversees our sustainability program as part of our overall business strategy.
Risk Management Structure and Processes.
The Board has delegated oversight of certain risks to its standing committees, as described below. The committee chairs report
to the Board about such delegated risks and other matters at each Board meeting. The Board itself monitors significant enterprise-wide
operational and financial risks to our business, and management’s strategies to address or mitigate them, through briefings
our CEO, Chief Financial Officer (“CFO”) and President and Chief Operating Officer (“COO”) provide at each
Board meeting and between meetings, as appropriate. The Board also receives regulatory and legal briefings from our general counsel.
Financial and Operational Risk Areas.
The Board reviews and approves our shelf registration statements and debt and equity offerings thereunder, in some cases delegating
the pricing of such transactions to a standing or ad hoc committee of independent directors, as well as our unsecured revolving
credit facility and term loan agreements, and our share repurchase programs. The Board also approves land acquisitions if the purchase
price or the purchase price plus expected land development exceed certain thresholds. Though no such land acquisition reviews occurred
in 2023, in such cases, the proposed project, as with all our communities, will have previously been assessed through our standard
local, regional and corporate review processes.
Cybersecurity Risk Review. The
Board through its Audit and Compliance Committee monitors cybersecurity risks and our evolving physical, electronic and other protection
strategies and initiatives. This includes engaging in periodic reviews with management covering our cybersecurity tools and resources,
threat environment, incident reporting procedures and future plans. Our chief information officer conducts this review with the
committee, most recently in January 2024. Our chief information officer is supported by a chief information security officer and
other employees and dedicated contract personnel experienced with information technology and cybersecurity matters who are responsible
for evaluating and deploying the cybersecurity measures we employ, as described in the Annual Report.
Standing Board Committee Profiles
Audit
and Compliance Committee
(“Audit Committee”) |
|
Members:
■ Dr.
Thomas W. Gilligan (Chair)
■ Jose
M. Barra
■ Dorene
C. Dominguez
|
■ Kevin
P. Eltife
■ Dr.
Stuart A. Gabriel
|
Principal Responsibilities:
Oversees our corporate accounting and reporting
practices and audit process, including our Independent Auditor’s qualifications, independence, retention, compensation and
performance, and our compliance with legal and regulatory requirements; and may approve our incurring, guaranteeing or redeeming
debt. Four Audit Committee members, including the chair, are “audit committee financial experts” under SEC rules.
Delegated Risk Oversight:
| ■ |
Oversees management’s performance of an annual enterprise risk management assessment, which our internal audit department organizes and coordinates. This assessment identifies significant short-term (such as orders and cancellation rates, and state and municipal construction permitting, inspections and utility processes), and long-term (such as land asset and community count growth and management, and land development activities) risks based on probability, impact and mitigating factors, which the Audit Committee reports on to the Board. |
| |
■ |
The assessment follows the COSO Enterprise Risk Management Integrated Framework and is a component of how our executive team sets business strategies and objectives and manages operations, including our sustainability initiatives. |
| |
■ |
This assessment’s outcome drives our internal audit department’s activities for the subsequent 12 months, which are based on a committee-approved annual audit plan. The internal audit department’s performance against the approved audit plan, along with the department’s audit findings, are reported and discussed at the committee’s quarterly meetings and on request. |
| ■ |
Evaluates our management of matters in which we have or may have material liability exposure. |
| ■ |
Per its Charter, discusses with management our policies and processes with respect to risk assessment and risk management, and the steps management has taken to monitor, identify and address significant financial risk exposures. |
| ■ |
Receives and discusses reports from our senior finance, accounting, legal and compliance, and internal audit personnel at each regular meeting on risks within their respective area of responsibility. It also conducts separate executive sessions at those meetings with each of those individuals and with our Independent Auditor to discuss such risks. |
| KB Home ■ 2024 Proxy Statement |
7 |
Management Development
and Compensation Committee
(“Compensation Committee”) |
|
Members:
■ Melissa
Lora (Chair)
■ Arthur
R. Collins
■ Jodeen
A. Kozlak
|
■ Brian
R. Niccol
■ James
C. Weaver
|
Principal Responsibilities:
Evaluates and recommends our CEO’s
compensation; determines compensation for the CEO’s direct reports; evaluates and recommends non-employee director compensation;
and oversees our policies and programs relating to significant human resource matters, including leadership development and continuity,
non-discrimination and equal employment opportunity policies, and initiatives designed to foster the diversity and inclusion of
talents, backgrounds and perspectives within, and to support the health and safety of, our workforce. Frederic W. Cook &
Co., Inc. (“FWC”) assists the committee with executive and non-employee director compensation as its outside compensation
consultant.
Delegated Risk Oversight:
| ■ |
Oversees
an annual employee compensation risk assessment FWC performs together with our management that largely focuses on potential
policy and program design and implementation risks. |
| ■ |
Annually
reviews our compliance with our equity-based award grant policy, and our human capital development and management succession
planning (both short- and long-term) for all levels of our organization, which, among other things, assesses executive bench
readiness and diversity within our workforce. |
| ■ |
Reviews
and, as appropriate, approves the compensation arrangements our senior human resources personnel develop. |
| ■ |
Based
on this oversight approach, including the results of our most recent annual employee compensation risk assessment, we do not
believe that risks arising from our present employee compensation policies and programs, including those applicable to senior
executives, are reasonably likely to have a material adverse effect on us. |
Nominating
and Corporate Governance Committee
(“Nominating Committee”) |
|
Members:
■ James
C. Weaver (Chair)
■ Arthur
R. Collins
■ Dorene
C. Dominguez
|
■ Kevin
P. Eltife
■ Dr.
Thomas W. Gilligan
|
Principal Responsibilities:
Oversees our corporate governance policies
and practices; and as further discussed in Annex 1, reviews “related party transactions;” identifies, evaluates and
recommends qualified director candidates to the Board; and administers the annual Board evaluation process.
Delegated Risk Oversight:
| ■ |
Oversees corporate governance-related risks, including assessing potential related party transactions, and evaluating the mix of director skills and experience with that of potential director candidates and the Board’s needs. |
| ■ |
Reviews proposed updates to our core governance-related policies and documents based on input from management and recommends changes to the Board. |
| ■ |
Monitors on an annual basis our political contributions and participation in industry trade associations. |
Board Committee Membership
Changes
Board Committee memberships changed on April
20, 2023, as follows:
| ■ |
Timothy W. Finchem, who
served on the Compensation Committee and Nominating Committee, retired from the Board. |
| ■ |
Mr. Barra joined the Audit
Committee upon his election to the Board. |
| ■ |
Mr. Collins rotated off the Audit Committee
and joined the Nominating Committee. |
There were no other changes to the Board
Committees’ composition in 2023.
| KB Home ■ 2024 Proxy Statement |
8 |
Board Experience and Skills
We have a balanced and diverse Board whose
members bring key skills and expertise, including those summarized below, for overseeing management’s execution of our strategic
and operational objectives. Our directors are also financially literate and highly engaged, with strong leadership backgrounds,
and academic, professional and personal experiences, which make them well-qualified to serve. The data below reflect the directors
serving as of the date of this Proxy Statement.
| |
 |
|

Corporate Governance: Experience with public or large private company governance. |
| |
 |
|
Enterprise Leadership: Experience as a chief executive or top manager for a commercial or academic organization, including responsibility for implementing business plans and managing results. |
| |
 |
|

Environmental: Experience or expertise with managing or advising on operational environmental matters, or possesses a relevant academic/research background. |
| |
 |
|

Finance/Investing: Professional or academic expertise or experience in preparing, auditing or evaluating financial statements, or in managing commercial investments. |
| |
 |
|

Government: Experience serving as a public official or in another public position, or working with or advising on regulatory, legislative or policy matters. |
| |
 |
|

Homebuilding: Experience or expertise in residential land development or home construction activities. |
| |
 |
|

Human Capital Management: Experience in talent management, professional development and/or succession planning. |
| |
 |
|

Real Estate: Professional experience in acquiring, managing or selling real estate assets. |
| |
 |
|

Retailing: Experience operating or managing retail businesses or operations similar to our design studios. |
| |
 |
|

Strategic Risk Management: Experience identifying, assessing and managing critical risks to enterprise wide or business unit strategic plans and achieving strategic objectives. |
| |
 |
|

Technological Innovation: Experience with or management of technology applications, advanced
products or organizations that develop them. One director has cybersecurity management experience. |
Director Tenure*
Average 7.8 years
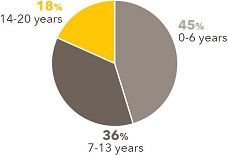
*percentages may not total 100% due to rounding
Director Ages*
Average Age 61
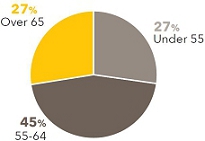
*percentages may not total 100% due to rounding
Director Demographics
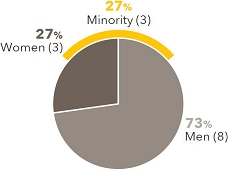
| Board Diversity Considerations |
| The Board considers diversity for directors and director candidates as
encompassing race, ethnicity, national origin, gender, geographic residency, educational and professional history, community
or public service, expertise or knowledge base and/or other tangible and intangible aspects of an individual. Beyond their
diverse perspectives, skills and demographic characteristics, 45% of our directors are women or ethnic minorities. Our Board
members are situated in regional locations generally in proportion to our business. |
| KB Home ■ 2024 Proxy Statement |
9 |
Director Compensation
The Compensation Committee periodically evaluates,
with FWC’s assistance, and makes recommendations to the Board regarding compensation and benefits for non-employee directors,
with attention to maintaining competitive positioning relative to peer public homebuilders and similarly situated companies. Non-employee
director compensation was last adjusted in July 2019. Directors, other than Mr. Mezger, who is not paid for his Board service,
are compensated as described below. We also pay directors’ travel-related expenses for Board meetings and Board activities.
Our director compensation program is shown in the table below. Directors elected to the Board other than at an annual meeting receive
prorated compensation.
Non-Employee Director Compensation
| Board Retainer: |
$100,000 |
| Equity Grant (grant date fair value): |
$162,500 |
| Lead Independent Director Retainer: |
$40,000 |
| Committee Chair Retainers: |
$27,500 (Audit Committee)
$21,000 (Compensation Committee)
$20,000 (Nominating Committee) |
| Committee Member Retainers: |
$12,500 (Audit Committee)
$10,000 (Compensation Committee)
$10,000 (Nominating Committee) |
| Meeting Fees: |
$1,500 (per applicable meeting, as described below) |
Retainers
Each director may elect to receive retainers
in equal quarterly cash installments, in unrestricted shares of our common stock or in deferred common stock awards (“stock
units”). Equity-based grants are made as described below.
Equity Grants
Except as noted below, each director may
elect to receive their equity grant in common stock or stock units. Grants are made on election to the Board, with the rounded
number of shares/units based on our common stock’s grant date closing price. Directors receive a share of our common stock
for each stock unit they hold on the earlier of a change in control or leaving the Board. Directors receive cash dividends on their
common stock holdings and cash dividend equivalent payments on their stock units. Stock units have no voting rights. If a director
has not satisfied their stock ownership requirement (see under “Stock Ownership Requirements”), they can receive only
stock units for their equity grant and must hold all shares of common stock until they satisfy the requirement or leave the Board.
Meeting Fees
Directors receive fees for each non-regularly
scheduled Board or committee meeting they attend if they have also attended all the same body’s prior meetings during the
applicable Director Year, which is the period between our annual meetings.
Indemnification Agreements
We have agreements with our directors, which
were updated in January 2024, that provide them with indemnification and advancement of expenses to supplement what our Certificate
of Incorporation and insurance policies provide, subject to certain limitations.
Directors’ Legacy Program
From 1995 to 2007, we maintained a Directors’
Legacy Program. Ms. Lora is the only current director who is a participant. Under the program, after a participant’s death,
we will make a donation on their behalf of up to $1.0 million directly to up to five participant-designated qualifying charitable
institutions or organizations in 10 equal annual installments. Program participants are fully vested in their donation amount;
however, neither they nor their families receive any proceeds, compensation or tax savings associated with the program. We maintain
life insurance policies to help fund program donations. In 2023, no premium payments were required to be made on policies associated
with current directors. The total amount payable under the program at November 30, 2023 was $13.9 million.
| KB Home ■ 2024 Proxy Statement |
10 |
Director Compensation During Fiscal Year 2023
| Name | |
Fees Earned or
Paid in Cash
($)(a) | | |
Stock
Awards
($)(b) | | |
All
Other
Compensation
($)(c) | | |
Total
($) | |
| Mr.
Barra | |
$ | 112,500 | | |
$ | 162,500 | | |
$ | — | | |
$ | 275,000 | |
| Mr.
Collins | |
| 120,000 | | |
| 162,500 | | |
| 1,500 | | |
| 284,000 | |
| Ms.
Dominguez | |
| 100,000 | | |
| 185,000 | | |
| — | | |
| 285,000 | |
| Mr.
Eltife | |
| 122,500 | | |
| 162,500 | | |
| — | | |
| 285,000 | |
| Dr.
Gabriel | |
| 112,500 | | |
| 162,500 | | |
| — | | |
| 275,000 | |
| Dr.
Gilligan | |
| 137,500 | | |
| 162,500 | | |
| — | | |
| 300,000 | |
| Ms.
Kozlak | |
| 100,000 | | |
| 172,500 | | |
| 1,500 | | |
| 274,000 | |
| Ms.
Lora | |
| 140,000 | | |
| 183,500 | | |
| 1,500 | | |
| 325,000 | |
| Mr.
Niccol | |
| — | | |
| 272,500 | | |
| 1,500 | | |
| 274,000 | |
| Mr.
Weaver | |
| 30,000 | | |
| 262,500 | | |
| — | | |
| 292,500 | |
| (a) |
Fees Earned or Paid in Cash. These amounts generally represent cash retainers
paid to directors per their individual elections. The amount for Ms. Lora includes her Lead Independent Director retainer. |
| |
|
| (b) |
Stock Awards. These amounts represent the aggregate grant date fair value of the shares
of our common stock or stock units granted to our directors in 2023 based on their individual elections with regard to their
retainers and type of equity grant (i.e., shares or stock units). The grant date fair value of each such
award is equal to the closing price of our common stock on the date of grant. All grants were made on April 20, 2023. The
table below shows the respective grants to our directors in 2023. |
| Name |
|
2023 Common Stock Grants
(#) |
|
2023 Stock Unit Grants
(#) |
| Mr. Barra |
|
3,914 |
|
— |
| Mr. Collins |
|
3,914 |
|
— |
| Ms. Dominguez |
|
4,456 |
|
— |
| Mr. Eltife |
|
3,914 |
|
— |
| Dr. Gabriel |
|
3,914 |
|
— |
| Dr. Gilligan |
|
3,914 |
|
— |
| Ms. Kozlak |
|
— |
|
4,154 |
| Ms. Lora |
|
4,419 |
|
— |
| Mr. Niccol |
|
— |
|
6,563 |
| Mr. Weaver |
|
— |
|
6,323 |
The aggregate number of outstanding equity awards held by our
non-employee directors at the end of our 2023 fiscal year are shown under “Ownership of KB Home Securities,” exclusive
of 2,043 shares of our common stock Ms. Lora holds in a family trust.
| (c) |
All Other Compensation. These amounts are additional meeting fees
paid in 2023 for a Compensation Committee meeting during the 2022-2023 Director Year. |
| KB Home ■ 2024 Proxy Statement |
11 |
Election of Directors
The Board will present as nominees at the
Annual Meeting, and recommends our stockholders elect to the Board, each of the individuals named below for a one-year term ending
at the election of directors at our 2025 annual meeting. Each nominee is standing for re-election and has consented to being nominated
and agreed to serve as a director if elected. After 20 years of service, Ms. Lora has decided not to stand for election at
the Annual Meeting and will step down from the Board when her term ends as of the election of directors at the Annual Meeting.
Mr. Niccol, who joined the Board in 2021, has also decided not to stand for election at the Annual Meeting and will step down from
the Board when his term ends as of the election of directors at the Annual Meeting.
Should any of the nominees become unable
to serve as a director prior to the Annual Meeting, the named proxies, unless otherwise directed, may vote for the election of
another person as the Board may recommend. If the Board’s nominees below are elected at the Annual Meeting, the Board will
have nine directors.
Voting Standard
To be elected, each nominee must receive
a majority of votes cast in favor (i.e., the votes cast for a nominee’s election must exceed the votes cast against
their election).

FOR
|
Board recommendation: FOR approval of each director nominee
|
Majority Voting Standard
Our Corporate Governance Principles provide
that a director nominee who fails to win election to the Board in an uncontested election is expected to tender his or her resignation
from the Board (or to have previously submitted a conditional tender). An “uncontested election” is one in which there
is no director nominee that has been nominated by a stockholder in accordance with our By-Laws. This election is an uncontested
election. If an incumbent director fails to receive the required vote for election in an uncontested election, the Nominating Committee
will act promptly to determine whether to accept the director’s resignation and will submit its recommendation for the Board’s
consideration. The Board expects the director whose resignation is under consideration to abstain from participating in any decision
on that resignation. The Nominating Committee and the Board may consider any relevant factors in deciding whether to accept a director’s
resignation.
| KB Home ■ 2024 Proxy Statement |
12 |

Age: 54
Director Service Since:
2023
Senior Vice President,
Merchandising Décor,
The Home Depot, Inc.
|
|
Jose M. Barra |
Jose M. Barra is Senior Vice President, Merchandising Décor at The
Home Depot, Inc., the world’s largest home improvement retailer. Mr. Barra has served in this role since 2018, responsible
for the strategic direction and financial performance of Home Depot’s flooring, paint, kitchen, bath, appliances, lighting,
and window coverings. Mr. Barra joined The Home Depot in 2017 and previously served as Senior Vice President of Merchandising Services,
where he led a team of more than 26,000 associates and was responsible for the company’s in-store environment, field merchandising
and merchandising execution team efforts.
Before joining Home Depot, Mr. Barra served as an Executive Vice President
of Optum Inc., a diversified health and well-being company and subsidiary of UnitedHealth Group Incorporated, a managed healthcare
and insurance company. Prior to that, he served as Executive Vice President of merchandising, essentials and hardlines at Target
Corporation, one of the largest retailers in the U.S., where he was responsible for the strategic direction and financial performance
of 10 divisions that generated more than 60% of total company revenues. Earlier in his career, Mr. Barra also held positions with
McKinsey & Company and served as managing director of the real estate and new business development arm of the largest retail
conglomerate in Ecuador. In addition to his proven leadership skills, Mr. Barra is a highly respected retail executive who brings
significant experience, expertise and insight into home design, the customer experience and consumer trends, and a presence in the
Southeast United States, a significant region for KB Home.
Current Public Company Directorships:
n KB Home
Other Professional Experience:
n Board Member, The Home Depot Foundation (2022 – Present)
n Senior Vice President, Merchandising Services, The Home
Depot, Inc. (2017 – 2018)
n Executive Vice President and Chief Executive Officer Consumer
Solutions Group, Optum, UnitedHealth Group Incorporated (2016 – 2017; Executive Vice President, 2015 – 2016)
n Executive Vice President, Merchandising, Target Corporation
(2014 – 2015)
|

Age: 63
Director Service Since:
2020
Founder and Chairman, theGROUP
|
|
Arthur
R. Collins |
Arthur
R. Collins is the founder and Managing Partner of theGROUP, a strategy, policy and communications
firm. Prior to founding theGROUP in 2011, Mr. Collins was Chairman and CEO of Public
Private Partnership, Inc., which he established in 1989. Mr. Collins has deep experience
advising corporate, governmental, nonprofit and political organizations across a broad
range of matters, including national security, energy, healthcare, agriculture, information
technology, transportation, manufacturing and financial services. He also has a substantial
presence in Washington, D.C. and the Southeast United States, where we have significant
business operations.
Public Company Directorships:
n KB
Home
n Aflac
Incorporated
n RLJ
Lodging Trust
Other Professional Experience:
n Member,
Ford’s Theatre Board of Trustees (2022 – Present)
n Chairman,
Morehouse School of Medicine Board of Trustees (2008 – Present)
n Vice
Chair, Brookings Institution Board of Trustees (2014 – 2023)
n Member,
Meridian International Center Board of Trustees (2011 – 2017)
n Chairman,
Florida A&M University Board of Trustees (2001 – 2003)
|
| |
|
|
| KB Home ■ 2024 Proxy Statement |
13 |

Age: 61
Director Service Since:
2017
Chairwoman and Chief
Executive Officer, Vanir
Group of Companies, Inc.
|
|
Dorene
C. Dominguez |
Dorene C. Dominguez has
served since 2004 as Chairwoman and Chief Executive Officer of the Vanir Group of Companies, Inc. and its subsidiaries Vanir Construction
Management, Inc. and Vanir Development Company, Inc., which provide a wide range of program, project and construction management
services for clients in the healthcare, education, justice, water/wastewater, public buildings, transportation and energy markets
throughout the United States. Ms. Dominguez also serves as Chair of The Dominguez Dream, a nonprofit organization that provides academic
enrichment programs in math, science, language arts and engineering to elementary schools in underserved communities. Ms. Dominguez
has extensive experience in executive management, finance, and civic engagement, as well as significant expertise in project and
asset management and real estate development. She also has a substantial presence and is well-regarded in California, an important
market for us.
Public Company Directorships:
n KB
Home
n Douglas
Emmett, Inc.
n CIT
Group (2017 – 2022)
Other Professional Experience:
n Advisory
Board Member, Aspen Institute Latinos and Society (AILAS) Program (2020 – Present)
n Board
of Trustees Member, University of Notre Dame (2018 – Present)
n Board
Member, Pride Industries, nonprofit employer of individuals with disabilities (2009 – 2023)
n Board
Member, CIT Bank, N.A. (2017 – 2022)
n Member,
The Coca-Cola Company Hispanic Advisory Council (2016 – 2022)
|

Age: 64
Director Service Since:
2020
Founder and Owner,
Eltife Properties, Ltd.
|
|
Kevin
P. Eltife |
| |
Kevin P. Eltife has been
the founder and owner of Eltife Properties, Ltd., a commercial real estate investment firm, since 1996. He also has served since
2018 as the Chairman of The University of Texas System Board of Regents, following his initial appointment to that board in 2017.
Previously, Mr. Eltife served as a Texas State Senator and as the Mayor of Tyler, Texas. Mr. Eltife has significant expertise
in overseeing sophisticated real estate development projects, a strong background in executive leadership and governance, and considerable
policymaking and civic engagement experience. In addition, he is highly regarded in Texas, which is a key market for us.
Public Company Directorships:
n KB
Home
Other Professional Experience:
n Chairman,
The University of Texas System Board of Regents (2018 – Present; Member 2017 – Present)
n Director,
Citizens 1st Bank (2002 – Present)
n Texas
State Senator (2004-2016; President pro tempore, 2015 – 2016)
n Mayor,
Tyler, Texas (1996 – 2002)
|
| |
|
| KB Home ■ 2024 Proxy Statement |
14 |

Age: 70
Director Service Since:
2016
Director, Richard S.
Ziman Center for Real
Estate at UCLA
Distinguished Professor
of Finance and Arden
Realty Chair, UCLA
Anderson School of
Management |
|
Dr.
Stuart A. Gabriel |
Dr. Gabriel has been since
2007 the Director of the Richard S. Ziman Center for Real Estate at UCLA, and is Distinguished Professor of Finance and Arden Realty
Chair at the UCLA Anderson School of Management. With Dr. Gabriel’s significant professional experience in and distinguished
study of macroeconomics and real estate, mortgage and finance markets, he has considerable knowledge and insight with respect to
the economic, regulatory and financial drivers that affect housing and homebuilding at local, regional and national levels. In addition,
with more than two decades of service in leadership roles at two of the most preeminent academic institutions in the country —
UCLA and USC — he has substantial management and administrative expertise and is highly respected for his perspective on housing
and land use matters in California, an important market for us, and nationally.
Public Company Directorships:
n KB
Home
n KBS
Real Estate Investment Trust III, Inc.
n KBS
Real Estate Investment Trust II, Inc. (2007 – 2023)
n KBS
Real Estate Investment Trust, Inc. (2005 – 2018)
Other Professional Experience:
n Director
and Lusk Chair, USC Lusk Center for Real Estate (1997 – 2007)
n Associate
Professor/Professor, Finance and Business Economics, USC Marshall School of Business (1990 – 1997)
n Economics
Staff Member, Federal Reserve Board (1986 – 1990)
|

Age: 69
Director Service Since:
2012
Emeritus Director and Senior Fellow at the Hoover
Institution on
War, Revolution, and Peace
|
|
Dr.
Thomas W. Gilligan |
Dr. Gilligan is an Emeritus
Director and Senior Fellow at the Hoover Institution on War, Revolution, and Peace at Stanford University. From September 2015 until
September 2020, Dr. Gilligan served as the Tad and Dianne Taube Director of the Hoover Institution, which is a public policy
research center devoted to the advanced study of economics, politics, history, political economy, and international affairs. Dr.
Gilligan has broad knowledge of and significant academic credentials in the fields of finance, economics, and business administration.
He also brings extensive leadership skills and experience from his many years of service as a dean at two of the premier post-graduate
business schools in the country and his immediate past position as the head of a prominent public policy institution. In addition,
he is well-known and highly regarded, professionally and personally, in both Texas and California, which are key markets for us.
Public Company Directorships:
n KB
Home
n Southwest
Airlines Co.
Other Professional Experience:
n Director,
Hoover Institution (2015 – 2020)
n Dean,
McCombs School of Business (2008 – 2015)
n Interim
Dean, USC Marshall School of Business (2006 – 2007; Professor 1987 – 2006)
n Assistant
Professor, California Institute of Technology (1984 – 1987)
n Staff
Economist, White House Council of Economic Advisors (1983-1984)
|
| |
|
|
| |
|
| KB
Home ■ 2024 Proxy Statement |
15 |

Age: 60
Director Service Since:
2021
Founder and CEO,
Kozlak Capital Partners, LLC
|
|
Jodeen
A. Kozlak |
Jodeen A. Kozlak is the
founder and CEO of Kozlak Capital Partners, LLC, a private consulting firm. Ms. Kozlak previously served as the Global Senior
Vice President of Human Resources of Alibaba Group, a multinational conglomerate. Ms. Kozlak also previously served as the Executive
Vice President and Chief Human Resources Officer of Target Corporation, one of the largest retailers in the U.S., and held other
senior roles in her 15-year career at the company. Prior to joining Target, Ms. Kozlak was a partner in a private law practice. Ms.
Kozlak has significant experience and insight into human capital management, talent development and executive compensation across
a variety of organizational structures, as well as a strong background in executive leadership. In addition, she is well-known and
highly respected in California, which is a key market for us.
Public Company Directorships:
n KB
Home
n C.H.
Robinson Worldwide, Inc.
n MGIC
investment Corporation
n Leslie’s,
Inc. (2020 – 2023)
Other Professional Experience:
n Global
Senior Vice President of Human Resources of Alibaba Group (2016 – 2017)
n Executive
Vice President and Chief Human Resources Officer of Target Corporation (2007 – 2016)
|

Age: 68
Director Service Since:
2006
Chairman Service Since: 2016
Chairman and
Chief Executive Officer,
KB Home
|
|
Jeffrey
T. Mezger |
Jeffrey T. Mezger, our
Chief Executive Officer, served as our President and Chief Executive Officer from November 2006 to February 2024, and was elected
Chairman of the Board in 2016. Prior to becoming President and Chief Executive Officer, Mr. Mezger served as our Executive
Vice President and Chief Operating Officer, a position he assumed in 1999. From 1995 until 1999, Mr. Mezger held a number of executive
posts in our southwest region, including Division President, Arizona Division, and Senior Vice President and Regional General Manager
over Arizona and Nevada. Mr. Mezger joined us in 1993 as president of the Antelope Valley Division in Southern California. In 2012,
Mr. Mezger was inducted into the California Homebuilding Foundation Hall of Fame. As our CEO, Mr. Mezger has demonstrated consistently
strong operational leadership, and ownership of our business strategy and its results. He has also established himself as a leading
voice in the industry through his over 40 years of experience in the public company homebuilding sector.
Public Company Directorships:
n KB
Home
Other Professional Experience:
n Policy
Advisory Board Member, Fisher Center for Real Estate and Urban Economics at UC Berkeley Haas School of Business (2010 – present)
n Policy
Advisory Board Member, Harvard Joint Center for Housing Studies (2004 – present; Board Chair 2015 – 2016)
n Founding
Chairman, Leading Builders of America (2009-2013; Executive Committee member until 2016)
n Executive
Board Member, USC Lusk Center for Real Estate (2000 – 2018)
|
| |
|
|
| |
|
|
| KB Home ■ 2024 Proxy Statement |
16 |

Age: 48
Director Service Since:
2017
Chief Executive Officer
and Chairman,
CW Interests, LLC
|
|
James
C. Weaver |
James C. “Rad”
Weaver is CEO and Chairman of CW Interests, LLC, an investment management firm in San Antonio, Texas. He oversees the implementation
of the company’s investment strategies, including management of direct investments in private operating businesses. Mr. Weaver
is the former CEO of McCombs Partners. He also serves as a director of several private companies including Cox Enterprises, Inc.,
Circuit of the Americas, Jonah Energy and Milestone Brands. In 2017, he was appointed to the University of Texas System Board of
Regents. Mr. Weaver has considerable experience in executive leadership, business strategy and execution, financial planning
and analysis, and asset/investment management across a broad range of industries along with critical insight on governance and economic
and regulatory policymaking. In addition, with his professional achievements and significant community involvement, he has a substantial
presence and is well-regarded in Texas, a core market for us.
Public Company Directorships:
n KB
Home
Other Professional Experience:
n Board
Member, The University of Texas/Texas A&M Investment Management Company (Chairman 2022 – Present; Vice Chair 2017 –
2022)
n Member,
The University of Texas System Board of Regents (2017 – Present)
n Member,
The McCombs School of Business Advisory Council (2014 – Present)
n San
Antonio Chamber of Commerce Board of Directors (Member 2014 – 2017; Chairman 2016 – 2017)
n McCombs
Partners (2000-2020; Chief Executive Officer 2006 – 2020)
|
| |
|
|
| |
|
|
| KB
Home ■ 2024 Proxy Statement |
17 |
Ownership of KB Home Securities
The table below shows the amount and nature
of our non-employee directors’ and NEOs’ respective beneficial ownership of our common stock as of February 26, 2024.
Except as otherwise indicated below, the beneficial ownership is direct and each owner has sole voting and investment power with
respect to the reported securities holdings.
| Non-Employee Directors | |
Total Ownership(a) | |
Stock Options(b) |
| Jose M. Barra | |
3,914 | |
— |
| Arthur R. Collins | |
9,098 | |
— |
| Dorene C. Dominguez* | |
21,267 | |
— |
| Kevin P. Eltife | |
14,598 | |
— |
| Dr. Stuart A. Gabriel | |
35,292 | |
— |
| Dr. Thomas W. Gilligan | |
49,442 | |
— |
| Jodeen A. Kozlak | |
19,653 | |
— |
| Melissa Lora | |
180,619 | |
— |
| Brian R. Niccol | |
18,470 | |
— |
| James C. Weaver | |
39,285 | |
— |
| Named Executive Officers | |
| |
|
| Jeffrey T. Mezger | |
1,766,250 | |
274,952 |
| Jeff J. Kaminski | |
120,872 | |
82,486 |
| Robert V. McGibney | |
60,629 | |
34,621 |
| Albert Z. Praw | |
135,512 | |
— |
| Brian J. Woram | |
156,119 | |
— |
| All Directors and Executive Officers as a Group (15 people) | |
2,663,548 | |
392,059 |
| * |
Ms. Dominguez's beneficial ownership reported in our 2023 Proxy Statement overstated
her total securities holdings by 12,867 shares as a result of a March 2022 transaction that was not reported until
December 2023, as described below. |
| (a) |
The total ownership amount includes the stock option holdings shown on the table. No non-employee
director or NEO owns more than 1% of our outstanding common stock, except for Mr. Mezger, who owns 2.1%. All non-employee
directors and executive officers as a group own 3.2% of our outstanding common stock. The total ownership amount reported
for each non-employee director includes all equity-based compensation awarded to them for their service on the Board, encompassing
shares of common stock and stock units. Included in Messrs. Mezger’s and Woram’s reported total ownership are
67,807 and 4,255 time-vesting restricted shares of our common stock, respectively. Dr. Gabriel, Ms. Lora and Mr. Kaminski
each hold their respective vested shares of our common stock in family trusts over which they have shared voting and investment
control with their respective spouses. |
| (b) |
The reported stock option amounts are the shares of our common stock that can be acquired within
60 days of February 26, 2024. We have not granted stock options as an element of director and employee compensation since
2016. |
| KB Home ■ 2024 Proxy Statement |
18 |
The following table shows the ownership of
each stockholder known to us to beneficially own more than five percent of our common stock. Except for the Grantor Stock Ownership
Trust (“GSOT”), the below information (including footnotes) is based solely on the stockholders’ respective filings
with the SEC reporting such ownership as of December 29, 2023, December 31, 2023 and January 31, 2024, as applicable. Some percentage
figures below have been rounded.
| Stockholder(a) |
|
Total Ownership |
|
Percent of Class |
BlackRock, Inc.
50 Hudson Yards, New York, NY 10001 |
|
10,694,328 |
|
13.5% |
The Vanguard Group, Inc.
100 Vanguard Blvd., Malvern, PA
19355
|
|
7,784,840 |
|
10.3% |
KB Home Grantor Stock Ownership Trust(b)
Delaware Charter Guarantee &
Trust Company dba Principal Trust Company
Wilmington, DE 19805-1265
|
|
6,705,247 |
|
8.1% |
FMR LLC
245 Summer Street, Boston, MA 02210
|
|
5,007,432 |
|
6.3% |
| (a) |
The stockholders’ respective voting and dispositive power with respect to their
reported ownership is presented below, excluding the GSOT. |
| | |
Blackrock, Inc.(i) | |
The Vanguard Group, Inc.(ii) | |
FMR LLC(iii) |
| Sole voting power | |
10,459,742 | |
— | |
5,001,948 |
| Shared voting power | |
— | |
62,247 | |
— |
| Sole dispositive power | |
10,694,328 | |
7,638,638 | |
5,007,432 |
| Shared dispositive power | |
— | |
146,202 | |
— |
| (i) |
Blackrock, Inc. is a parent holding company. A BlackRock, Inc. subsidiary, BlackRock
Fund Advisors, beneficially owned five percent or more of Blackrock, Inc.’s reported total beneficial ownership. |
| (ii) |
The Vanguard Group, Inc. is an investment adviser to various investment companies. |
| (iii) |
FMR LLC is a parent holding company. A wholly-owned FMR LLC subsidiary, Fidelity Management &
Research Company, an investment adviser to various investment companies (“Fidelity Funds”), beneficially owned
five percent or more of FMR LLC’s reported total beneficial ownership and votes the shares of our common stock held
by the Fidelity Funds. |
| (b) |
The GSOT’s percent of class figure is relative to the total number of shares
of our common stock entitled to vote at the Annual Meeting. The GSOT holds these shares pursuant to a trust agreement with
a division of Delaware Charter Guarantee & Trust Company dba Principal Trust Company as trustee. Both the GSOT and the
trustee disclaim beneficial ownership of the shares. Under the trust agreement, our employees who hold unexercised common
stock options under our employee equity compensation plans determine the voting of the GSOT shares. Employees who are also
directors cannot vote GSOT shares; therefore, Mr. Mezger cannot direct the vote of any GSOT shares. If all eligible
employees submit voting instructions, our other NEOs can direct the vote of the following amounts of GSOT shares: Mr. Kaminski
2,240,025; Mr. McGibney 940,183; and all eligible executive officers as a group: 3,180,207. |
Stock Ownership Requirements
Our non-employee directors and senior executives
are subject to stock ownership requirements to better align their interests with those of our stockholders. Our Corporate Governance
Principles require each of our non-employee directors to own at least five times the Board retainer (which currently equates to
$500,000) in value of our common stock or common stock equivalents by the fifth anniversary of joining the Board. The executive
stock ownership policy requires applicable senior executives, including our NEOs, to own a certain number of shares within a specified
period. The policy is discussed under “Equity Stock Ownership Policy.” Each of our non-employee directors and NEOs
is in compliance with their respective policy requirements.
Delinquent Section 16(a) Reports
Under Section 16 of the Securities Exchange
Act of 1934, as amended (“Exchange Act”), our directors, executive officers and any persons holding more than 10% of
our common stock are required to report to the SEC initial ownership of our common stock and any subsequent changes in ownership.
The SEC has established specific filing due dates, and we are required to disclose any failure to file required ownership reports
by these dates. Based solely on a review of forms filed with the SEC and the written representations of such persons, we are aware
of no late Section 16(a) filings other than Ms. Dominguez not reporting a March 1, 2022 stock sale until a Form 5 filing made on
December 22, 2023, and a Form 4 filing made on November 2, 2023 to report Mr. McGibney’s October 25, 2023 disposition of
common stock to us solely to cover tax withholding obligations arising from the vesting of a previous grant of restricted shares.
| KB Home ■ 2024 Proxy Statement |
19 |
Compensation Discussion and Analysis
Financial Performance and Compensation Highlights
In 2023, as discussed in the Annual Report,
we generated solid financial results, as we remained focused on balancing pace, price and production levels at every community
to optimize our return on each inventory asset within its local market context amid a mixed operating environment over the course
of the year.
We began the year navigating weak housing
market conditions, stemming from higher mortgage interest rates, persistent inflationary pressures and an uncertain economic outlook,
which significantly depressed housing demand during the 2022 second half and into the 2023 first quarter. Reflecting the difficult
operating context, and our business’ considerable cyclicality, in the 2022 fourth quarter, when the measures and goals for
the long-term incentive awards tied to 2023-2025 performance were established and planning began for the 2023 annual incentive
program, our gross orders and net orders were down 47% and 80%, respectively, compared to the prior year. Moreover, through the
first five weeks of fiscal 2023, just prior to the Compensation Committee’s approving the 2023 annual incentive program goals,
our net orders were 72% lower than the corresponding year-earlier period. We also forecasted, relative to corresponding 2022 periods,
that our 2023 first quarter net orders would be down between 50% and 60%, our 2023 fiscal year revenues would be approximately
20% lower and our profit margins would be compressed.
Demand began to improve in the 2023 second
quarter and remained relatively healthy for the balance of the year due to, among other things, constrained resale home inventory,
favorable demographic trends, buyer interest in homes at our price points and our selective implementation of targeted sales strategies
to help drive order activity and minimize cancellations. In addition, a significant factor in our success in 2023 was a meaningful
improvement in our average construction cycle time, resulting in higher-than-expected home deliveries and revenues.
Altogether, in 2023, we delivered more than
13,200 homes (compared to an initial projection of roughly 11,400 homes), driving revenues of $6.4 billion, and diluted earnings
of $7.03 per share. Our top-line, together with an operating margin above 11%, and the repurchase of shares during the year equal
to 11% of our shares outstanding at the beginning of 2023, contributed to a 15% growth in our book value per share to $50.22.
In addition to our outperformance across several metrics for the year relative to our initial expectations, we continued to build
our brand in 2023. We also further advanced our industry leadership in sustainability, earning recognition from several organizations
for our accomplishments and contributions, including in the broader communities in which we operate.
Notable 2023 Annual Results and Long-Term Growth and Returns
We produced a one-year total stockholder
return of approximately 68%, at the 64th percentile of our peer group, and strong results across several key measures during 2023.
In addition, the following are five-year (2018-2023) result comparisons, except as noted:
| ■ |
Homebuilding revenues grew to $6.38 billion from $4.53 billion, a 41% increase. |
| ■ |
Pretax income rose to $771.3 million from $368.0 million, up 110%. |
| ■ |
Net income grew to $590.2 million from $170.4 million, a 246% improvement. |
| ■ |
Diluted earnings per share rose to $7.03 from $1.71, up 311%. |
| ■ |
Book value per share improved nearly 90%, from $26.60 to $50.22. |
| ■ |
Return on equity increased to 15.7% from 14.4%. |
| ■ |
Debt to capital ratio improved significantly to 30.7% from 49.7%. |
| ■ |
In July 2023, the Board increased our quarterly cash dividend by approximately 33% to $.20 per share. |
| ■ |
In 2023, we generated approximately $1.1 billion in operating cash flow and returned nearly $470 million of cash to our
stockholders through share repurchases and cash dividends. |
We achieved strong homebuilding revenues,
net income, and diluted earnings per share results between 2019 and 2023 as shown in the charts below.
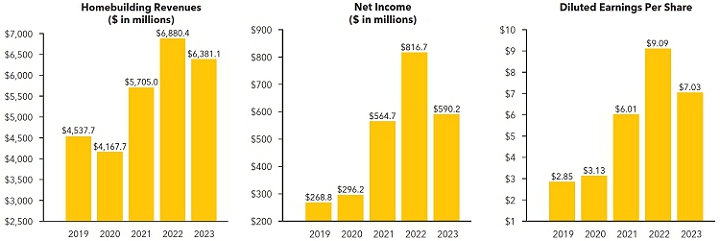
| KB Home ■ 2024 Proxy Statement |
20 |
Recent Recognition
We have been recognized by the following
organizations, among others, for our sustainability and human capital initiatives and practices:
| ■ |
Forbes’ 2021, 2022 and 2024 lists of America’s Best Midsize Employers, including being
listed among the top 20% of recognized companies in 2024. |
| ■ |
Newsweek’s 2022 and 2023 lists of America’s Most Trustworthy Companies, which is a recognition based on three
main public pillars: customer trust, investor trust and employee trust. |
| ■ |
Newsweek’s 2021, 2022, 2023 and 2024 lists of America’s Most Responsible Companies, the only homebuilder to
make this distinguished list four years in a row, recognizing us for demonstrating leading practices, specifically, our industry-leading
environmental initiatives, dedication to social responsibility and strong corporate governance standards. |
| ■ |
Fortune’s 2023 Change the World list, the first and only homebuilder named, which recognizes companies that have
created a positive impact on society through activities such as sustainability that are integral to their core strategies. |
| ■ |
USA TODAY’s inaugural 2023 list of America’s Climate Leaders for leading efforts to produce less greenhouse
gas emissions, the highest-ranked homebuilder listed. |
Pay For Performance — 2023 Fiscal Year CEO Compensation
| ■ |
Approximately 93% of our CEO’s 2023 total direct compensation was performance-based, and his
base salary has remained the same since 2017. |
| ■ |
The payouts under the 2023 annual incentive program were down year over year. While this reduction was proportionately
smaller than the applicable pretax income performance measure’s year-over-year reduction, the Compensation Committee
did not make any adjustments to the formula-driven payouts, taking into consideration, among other things, the program participants’
strong individual performance in a challenging operating environment and our one-year total stockholder return of 68%, which
was above our peer group median. |
| ■ |
To better align cash and equity incentives and enhance retention and stockholder value creation, a portion of our CEO’s
annual incentive was paid out in time-vesting restricted stock in lieu of cash. The $7,280,000 cash payout was less than the
prior year, and the $1,678,644 restricted stock portion, which was also less than the prior year, vests over three years. |
| ■ |
Our CEO’s October 2023 long-term incentive award was solely performance-based restricted stock units (“PSUs”),
with the 2023 target award grant value up approximately 10% from the value granted in each of the previous four years, an
increase based on peer group and market data analysis. |
| ■ |
Our CEO earned his three-year 2020 PSU award at 200% of target (as discussed under “2020 PSU Awards”), reflecting
our strong performance on the three applicable measures over the three-year performance period that ran from December 1, 2021
to November 30, 2023. |
| ■ |
Taken together, the above actions resulted in overall CEO reported compensation that is lower year over year. |
The table below compares our CEO’s
total compensation for 2023 and 2022 and reflects the more than $627,000 reduction in his annual incentive compensation payout
and a market-based increase to his long-term incentive grant, which was comprised entirely of PSUs that will not fully vest until
after our 2026 fiscal year concludes.
| Total
Compensation* | |
2023 | | |
2022 | | |
Change | |
| Base Salary | |
$ | 1,150,000 | | |
$ | 1,150,000 | | |
$ | — | |
| Annual Incentive Plan Compensation(a) | |
| 8,958,644 | | |
| 9,585,872 | | |
| (627,228 | ) |
| Long-Term Incentive Awards(b) | |
| 5,500,020 | | |
| 5,000,010 | | |
| 500,010 | |
| Other | |
| 80,391 | | |
| 78,909 | | |
| 1,482 | |
| TOTAL | |
$ | 15,689,055 | | |
$ | 15,814,791 | | |
$ | (125,736 | ) |
| * |
This table includes all aspects of compensation that are disclosed in the Summary Compensation
Table, with the “Other” category above consisting of the sum of amounts in the Change in Pension Value and Nonqualified
Deferred Compensation Earnings column and the All Other Compensation column. |
| (a) |
Reflects our CEO’s entire annual incentive for each year, including both the portion paid
out in cash and the portion paid out in time-vesting restricted stock in lieu of cash. |
| (b) |
Reflects our CEO’s long-term incentive award grants for each year, consisting solely of PSUs. |
| KB Home ■ 2024 Proxy Statement |
21 |
Engaging With Our Stockholders
Direct engagement with our stockholders is
an integral part of managing our business to drive long-term value and aligns with our core value of building strong and collaborative
relationships.
Why We Engage
To Interact: We seek to understand
the issues that are important to our stockholders through an ongoing, two-way dialogue in which we can respectfully discuss their
priorities.
To Inform: We are committed to providing
transparency into our strategy, performance, outlook and sustainability-related practices.
To Improve: We use feedback from stockholders
to enhance our public disclosures and consider it in our decision-making.
How We Engage
We conduct extensive stockholder outreach
throughout the year, typically engaging with the investment management teams of our largest stockholders, as well as their governance
representatives. Our stockholder conversations involve our senior management, investor relations, human resources and legal executives.
Matters raised in these engagements are actively discussed with directors as relevant.
In 2023, we continued our longstanding practice
of reaching out to our stockholders, including each of our 25 largest stockholders, in advance of our annual meeting and engaged
with holders representing over 50% of our outstanding shares through written communications, phone calls and virtual meetings.
We conducted additional proactive outreach with some of our largest stockholders throughout the balance of the year. During the
course of these meetings, we discussed and received constructive feedback on a broad range of topics, including our company strategy
and performance, executive compensation, board tenure and composition, environmental and social sustainability initiatives and
governance matters.
We also provide stockholders with opportunities
throughout the year to engage with us. We participate in formal events, including sell-side analyst hosted conferences, non-deal
roadshows, and investor visits to our communities. In addition, we speak with stockholders more informally during the year, particularly
following the announcement of our quarterly earnings results.
Actions Taken Following 2022 and 2023 Stockholder Engagements
We value our stockholders’ opinions
and are responsive to them. At our 2023 annual meeting, stockholder support for our proposal on named executive compensation was
80%, an improvement from the prior year. The feedback we received in 2022 and 2023 through our stockholder engagement efforts shaped
the following changes in our executive compensation programs, which we believe have helped strengthen the connection between our
performance and executive compensation, as shown in the prior section:
| ■ |
Developed with the Compensation Committee and FWC a structured scorecard methodology to guide annual
incentive payout determinations. |
| ■ |
Implemented a limit on the cash payouts for annual incentives to our NEOs. |
| ■ |
Further reduced the cash payout of the CEO’s annual incentive below the program limit by allocating a higher portion
of his total annual incentive to time-vesting equity in lieu of cash to, among other things, additionally balance his cash
and equity compensation and enhance alignment with stockholder value creation. |
| ■ |
Increased in 2022 the asset efficiency hurdle rate under the annual incentive program. |
| KB Home ■ 2024 Proxy Statement |
22 |
The adjustments to our executive compensation
programs complemented the following elements, which we have maintained for several years:
| |
What
We Do |
|
|
What
We Don’t Do |
 |
Engage
with and consider stockholder input in designing our executive pay programs. |
|
 |
No
re-pricing or cash-out of underwater stock options without stockholder approval. |
|
Link
annual NEO incentive pay to objective, pre-set financial performance goals, which are three-year goals for long-term incentives. |
|
|
We
prohibit our NEOs (and our other employees and non-employee directors) from hedging or pledging their holdings of our securities. |
|
Solely
utilize PSUs for our NEOs’ regular long-term incentive grants, and subject NEOs to robust stock ownership requirements. |
|
|
No
new executive officer severance arrangements above a certain amount without stockholder approval (see under “Severance
Arrangements”). |
|
Include
in employee equity awards a double-trigger vesting requirement in a change in control. |
|
|
No
new excise tax “gross-ups” for any officer or employee. |
|
Subject
our executive officers to an updated incentive-based compensation recovery (a/k/a “clawback”) policy, adopted
in 2023 per NYSE rules. |
|
|
No
payments of dividends or dividend equivalents on performance-based equity awards before they vest. |
|
Perform,
under Compensation Committee oversight, annual risk assessments to determine that our employee compensation policies and programs
are not likely to have a material adverse effect on us. |
|
|
Avoid
excessive perquisites. Perquisites are generally limited to market-competitive medical benefits and the opportunity to participate
in a deferred compensation plan. |
|
Engage,
at the sole direction of the Compensation Committee, an independent compensation consultant. |
|
|
|
|
Consider
our sustainability-related programs’ progress in annual incentive plan IPF assessments. |
|
|
|
|
Maintain
a relevant industry peer group. |
|
|
| KB Home ■ 2024 Proxy Statement |
23 |
Pay Program Overview
The table below sets forth the components of,
and rationale for, each element of our executive compensation program.
| Compensation
Type |
|
Description |
|
Rationale |
| Base Salary |
|
■
Fixed compensation delivered in cash on a semi-monthly basis. |
|
■
A market-aligned component of the overall pay package to provide a baseline level of pay; key to attracting and retaining highly qualified executives. |
| Annual Incentive Program |
|
■
Our NEOs’ 2023 annual
incentives were performance-based and formula-driven, focused on pretax income and asset efficiency measures, with final
determinations based on a structured incentive compensation scorecard.
■
The 2023 annual incentives
had cash payout limits, with the balance of any earned award paid out in restricted stock |
|
■
Motivates achievement of core strategic short-term financial results with additional emphasis on attaining specified key leadership, strategic planning and execution objectives. |
| Long-Term Incentive Program |
|
■
PSUs constituted all awards
for our NEOs’ regular long-term incentive grants, similar to our 2018-2022 grants.
■
2023 grants have three separate
three-year performance measures: cumulative adjusted earnings per share, average adjusted return on invested capital,
and revenue growth versus our peer group. |
|
■
Focuses executives on achievement
of long-term results and encourages retention.
■
Establishes strong alignment
with long-term stockholder interests through performance-based payouts in shares of our common stock. |
| Retirement Programs and Perquisites |
|
■
A 401(k) plan in which all
eligible employees may participate; market-competitive medical, dental and vision benefits; and opportunity to participate
in a deferred compensation plan.
■
Legacy executive retirement
and death benefit plans have been closed to new participants for over 18 years. |
|
■
Programs are aligned with
market practices.
■
Focuses executives on earning
rewards through performance pay elements, not as entitlements. |
As outlined above, we place a significant emphasis
on at-risk, performance-based pay. As shown below, in 2023, approximately 93% of our CEO’s total direct compensation consisted
of performance-based and/or at-risk vehicles. For our other NEOs, such vehicles, on average, approximated 82% of their total direct
compensation.
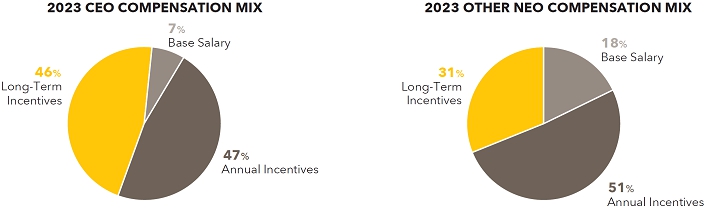
| KB Home ■ 2024 Proxy Statement |
24 |
NEO Compensation Components
Base Salaries
The Compensation Committee annually reviews and
approves our CEO’s and our other NEOs’ base salaries. The Compensation Committee approves NEO base salaries after considering
several factors, including an NEO’s experience, specific responsibilities, capabilities, individual performance and expected
future contributions; our current and expected financial and operational results; and market pay levels and trends to ensure competitiveness.
In July 2023, based on an evaluation of these
factors, our business trajectory and challenges, and our CEO’s recommendations, the Compensation Committee approved base
salary increases for each NEO other than our CEO, who last received an increase in 2017, his only increase since 2007. Effective
February 1, 2024, Mr. McGibney received an additional annual base salary increase in conjunction with his promotion to President
and Chief Operating Officer.
2023 Annual Incentives
| Our CEO’s performance-driven annual incentive award of $8.96 million was determined pursuant to a largely formula-based plan typical of several peers. Reflecting our performance in 2023, our CEO’s annual incentive award decreased approximately $627,000, or 6.5%, from the prior year. Taking stockholder feedback into account, the cash payout of the CEO’s 2023 annual incentive was limited to $7.28 million, approximately $200,000 less than the prior year’s cash incentive award, with the remainder paid out in time-vesting restricted stock in lieu of cash. The restricted stock vests ratably over the next three years, further aligning, along with the below-described performance-based long-term incentive awards, our CEO’s compensation with stockholder value creation. |
Our annual incentive program is designed to drive
performance within a single fiscal year period, with pay outcomes tied to our performance on total adjusted pretax income (“API”).
The program is based on two components. First, threshold and target API goals are set based on our internal operational objectives
established near the beginning of each year, which take into account expected business conditions for the year. API is our total
pretax income excluding certain compensation expense and certain inventory-related charges. Payouts under this first component
are capped at 100% of the participants’ respective target level. Second, for the participants to earn any above-target payouts,
API must exceed a hurdle based on a pre-set minimum asset efficiency objective. If the hurdle is met, an asset efficiency performance
pool is funded for every dollar of API over the hurdle. The funded pool is then allocated based on the participants’ individual
performance and contributions as measured under a structured scorecard methodology, which is outlined below, and such allocations
are further limited by the individual maximum payout amounts approved under the plan.
We view API as a comprehensive short-term measure
of our senior officers’ performance, as it reflects their ability to produce profits by generating revenues, managing expenses
and controlling fixed costs. In addition, with the homebuilding industry’s significant cyclicality and its volatility in
recent years, using API as a primary measure intrinsically scales senior officer pay outcomes (down or up) to a degree relative
to the API generated in a one-year period. Combining the API and asset efficiency measures is intended to motivate our senior officers
to generate profitable growth aligned with our strategic goals.
In 2022, based on stockholder feedback and FWC’s
recommendations, the Compensation Committee refined the annual incentive program to further align it with our strategic focus on
expanding our scale and to incorporate features to enhance its rigor, including the following, which were maintained in the 2023
program:
| ■ |
limiting each participating officer’s cash payouts to no more than 80% of their respective maximum
opportunity, with the balance of any earned award above that level paid out in time-vesting restricted stock in lieu of cash.
As discussed below, the Compensation Committee further limited the CEO’s cash payout under the 2023 program, as
it did under the 2022 program; |
| ■ |
applying a detailed, structured scorecard methodology to determine the annual incentive awards’ asset efficiency
component; and |
| ■ |
increasing the asset efficiency component’s pool funding threshold to 3% of a return on inventory measure, up from
1% three years ago. |
The 2023 target payout opportunities remained
the same as for 2022 and were set at 225% of base salary for our CEO, 175% for our COO and 140% for our other NEOs. As shown in
the Grants of Plan-Based Awards During Fiscal Year 2023 table, maximum payout opportunities were limited to a multiple of target.
The target and maximum opportunities were designed to generate payout levels that, if achieved, would appropriately reward strong
performance for 2023, and together with base salary and long-term incentives, provide competitive total direct compensation.
2023 Annual Incentive Program Component Determinations
Our NEOs received annual incentive payouts under
the 2023 program as described below.
API Performance Relative to Goals Component
The Compensation Committee set an API performance
target of $500.0 million, a 44% decrease compared to our 2022 target API performance goal, and approximately 56% below our 2022
actual API performance. The 2023 performance target was set early in the year amid a highly uncertain operating environment and
was based on then current and expected depressed housing market conditions, such as our forecast at the time that our 2023 first
quarter net orders would be down between 50% and 60% year over year. Notwithstanding the challenging operating environment we expected
and experienced in 2023, due to our executives’ strong performance, as described above and in the Annual Report, we achieved
API of $858.6 million, approximately 27% lower than our actual 2022 API result of $1.18 billion. Although our actual 2023 API exceeded
the target performance level, payouts were limited to 100% of each NEO’s individual target amount under this component of
the program. As explained above and shown in the table below, this performance led to strictly formula-based payouts of 100% of
target to our NEOs under the API performance component.
| KB Home ■ 2024 Proxy Statement |
25 |
2023 API PERFORMANCE LEVELS AND PAYOUT SUMMARY
| |
Threshold |
Target |
Actual Result |
| API Performance Levels |
$375.0 million |
$500.0 million |
$858.6 million |
| API Performance Levels Relative to Target |
75% |
100% |
172% |
| Payout Level Ratios |
50% |
100% |
100% |
API Performance Relative to Asset Efficiency Component
Under this component, (a) two and one quarter
percent of each dollar of API over our minimum asset efficiency objective of up to 110% of the API target, and (b) three and one
quarter percent of each dollar of API above the level of 110% of our 2023 API target, funded an additional annual incentive pool
to be allocated among the participating officers. The Compensation Committee set the minimum asset efficiency objective at a three
percent return on inventory for 2023, consistent with the prior year. Therefore, the 2023 minimum asset efficiency objective increased
to $160.2 million, up approximately 3% from the 2022 objective of $155.2 million. With the difference between our API and
the minimum asset efficiency objective equal to about $698.4 million, the asset efficiency performance pool could be funded up
to a total level of approximately $18.8 million.
Annual Incentive Compensation Scorecard and Individual Performance
Factor (or “IPF”)
The Compensation Committee determined the asset
efficiency performance pool’s allocation to the participating officers guided by a detailed scorecard methodology through
which their individual 2023 performance and contributions were assessed across four key dimensions: financial results, leadership,
strategic planning and execution. Within the scorecard structure, each participating officer received points in each dimension
based on our CEO’s assessment of their performance, and on the Compensation Committee’s assessment, with FWC’s
assistance, of our CEO’s performance. The respective cumulative points a participating officer achieved corresponded to an
IPF range with upper and lower limits of potential payouts to the officer of the total available asset efficiency performance pool.
These pre-established IPF-based payout ranges, outlined below, took into consideration each participating officer’s 2023
annual incentive payout opportunities at threshold, target and maximum levels; historical relative annual incentive payouts by
functional role; additional individual accomplishments and competitive market pay information.
2023 Annual Incentive Compensation Scorecard
| Dimension |
|
Financial Results (0-8 pts.) |
|
|
Leadership (0-4 pts.) |
|
|
Strategic Planning (0-4 pts.) |
|
|
Execution (0-4 pts.) |
| Goals and Objectives |
|
Meet or exceed FY23 goals for:
■ Homebuilding revenues
■ Homebuilding operating income as a percentage
of total revenues
■ Selling, general and administrative
expenses as a percentage of homebuilding revenues
■ Cash flow
■ Return on equity
■ Diluted earnings per share |
|
|
■ Attract, retain and develop critical
talent to drive current and future results
■ Enhance culture of customer obsession,
driving best in class results in homebuyer satisfaction
■ Strive to achieve
top homebuilder
rankings and external
recognition for our sustainability-related accomplishments |
|
|
■ Build forecasts and business plans to
reflect current and expected future market conditions
■ Establish future community count pipeline
through 2025 in response to current market conditions and community needs
■ Develop long-term objectives supported
by concrete action plans for sustainability-related goals, such as average HERS score and workforce diversity, wellness
and safety |
|
|
■ Optimize performance of each community
by balancing pricing, sales pace and return on investment
■ Drive construction cycle times down
by 10% or more from 2022 levels
■ Achieve a minimum 90% customer satisfaction
rating in the majority of served markets, per an outside firm
■ Enhance supply chain to ensure ability
to support the business with qualified partners that have committed to our Supplier Code of Conduct
■ Analyze workplace practices, including
as to pay, to ensure equitable outcomes |
| KB Home ■ 2024 Proxy Statement |
26 |
Maximum Potential IPF per Cumulative Scorecard Points
| Cumulative Scorecard Points |
Mr. Mezger |
Mr. Kaminski |
Mr. McGibney |
Mr. Praw |
Mr. Woram |
| 18-20 |
36.00% |
6.00% |
10.00% |
4.75% |
4.25% |
| 15-17 |
31.00% |
5.00% |
8.00% |
3.75% |
3.25% |
| 11-14 |
26.00% |
4.00% |
6.00% |
2.75% |
2.25% |
| 0-10 |
22.00% |
3.25% |
4.50% |
2.00% |
1.50% |
Based on their respective cumulative scorecard
assessment points, the Compensation Committee determined each NEO’s IPF, as shown in the table below, within the corresponding
lower and upper IPF limits indicated on the above table.
| Named Executive Officer |
2023 Cumulative Scorecard Points |
2023 IPF |
| Mr. Mezger |
19.00 |
33.90% |
| Mr. Kaminski |
18.00 |
5.10% |
| Mr. McGibney |
19.00 |
9.10% |
| Mr. Praw |
18.00 |
3.90% |
| Mr. Woram |
18.00 |
3.30% |
The table below summarizes our NEOs’ individual
performance contributions that informed their IPF assessments under the scorecard.
| NEO |
2023 NEO Individual Performance Contributions |
| Mr. Mezger |
■
Drove our strong
financial results, including exceeding our goals for homebuilding revenues, homebuilding operating income, cash flow from
operations, return on equity and diluted earnings per share, and increasing our book value per share to over $50, up 15%
year over year
■
Directed a balanced
capital allocation strategy, resulting in our returning nearly $470 million of cash to our stockholders through share
repurchases and cash dividends, including an approximately 33% increase in our quarterly cash dividend to $.20 per share
■
Continued to enhance our culture of customer obsession, with
a #1 ranking in customer satisfaction on the TrustBuilder® review site
■
Progressed our
sustainability leadership, which is broadly recognized by third-parties, including Forbes, Fortune, Newsweek and USA TODAY
■
Led, in conjunction
with our human resources team, the process to hire, develop and promote several senior corporate, regional and division
leaders, including Mr. McGibney, in alignment with our talent and leadership strategies, to enhance succession planning
and expand leadership diversity
■
Navigated challenging
current conditions and established realistic land investment goals while balancing the need to optimize current assets
and generate strong cash flows from operations |
| Mr. Kaminski |
■
Drove solid performance
on key financial metrics, including deliveries, gross margins, selling, general and administrative expenses, and inventory
efficiency
■
Built a three-year
strategic plan, reflecting anticipated financial results and a capital structure strategy that considered expected market
challenges
■
Effectively managed
our capital structure and improved the quality of the balance sheet, including ending 2023 with more than $1.81 billion
of total liquidity, compared to $1.26 billion at 2022 year end, and fully repaying $150 million of unsecured credit facility
borrowings, helping to lower our year-end debt to capital ratio by 270 basis points to 30.7%, compared to 33.4% at November 30,
2022
■
Supported workforce
development and diversity initiatives by mentoring key staff members for their future growth and succession |
| KB Home ■ 2024 Proxy Statement |
27 |
| NEO |
2023 NEO Individual Performance Contributions |
| Mr. McGibney |
■
Led our field teams
to exceed our homes delivered, revenues and profitability forecasts in each quarter of 2023
■
Partnered with
our mortgage joint-venture partner to develop and deploy programs designed to support orders and our backlog
■
Drove significant
improvement in our average construction cycle time, which, together with his leadership on achieving meaningful direct
cost reductions through product value-engineering and KB Home Design Studio option simplification initiatives, was a critical
driver for our 2023 delivery, revenue and operational cash flow outperformance compared to our expectations at the start
of the year
■
Ended 2023 with
a #1 ranking in customer satisfaction from third-party sources despite challenging market conditions
■
Heads our internal
Sustainability Leadership Team and leads our National Advisory Board, both of which inform our future goals regarding
sustainability-related initiatives
■
Restructured and
mentored regional and division leadership while expanding diversity in key roles, including the promotion of three diverse
candidates to Division President roles, to strengthen operational focus and succession planning |
| Mr. Praw |
■
Strategically managed
company-wide land acquisitions by pivoting toward a growth-oriented pipeline amid changing market conditions in 2023
■
Led the process
to recalibrate community growth targets for 2024 and 2025, including the reevaluation and optimization of land development
phasing to accelerate community openings and align with just-in-time operational needs
■
Established and
fostered existing relationships with land sellers, developers and potential capital resources to maximize both growth
opportunities and returns on capital employed.
■
Aided in mentoring
division land team members through interacting in regular strategic land pipeline meetings |
| Mr. Woram |
■
Successfully led
litigation management, insurance recoveries and litigation avoidance strategies, including several favorable outcomes,
resulting in better than expected financial and cash flow outcomes for us
■
Skillful support
of diverse transactional attorney team, including career development and mentorship of high-potential team members while
executing plan to optimize external legal spending
■
Provided strong
leadership over our risk management and compliance efforts including workforce safety and employment practices, consumer
regulatory compliance, and insurance programs |
The Total Payout in the table below represents
a cash payment to each officer other than Messrs. Mezger and Woram. Under the 2023 program terms, cash payouts were limited to
80% of a participating officer’s respective maximum payout opportunity, with any earned award balance above the cash maximum paid
in time-vesting restricted stock in lieu of cash. As an annual incentive payout, this stock grant is not part of our separate long-term
incentive program described below. Mr. Mezger’s total payout included $7,280,000 in cash, which was $1.0 million less than
his cash maximum under the 2023 program terms, as the Compensation Committee decided to further reduce the cash payout under
the plan by allocating the $1.0 million into time-vesting restricted stock in lieu of cash to additionally balance his overall
cash and equity compensation and increase its alignment with stockholder value creation. As a result, Mr. Mezger was granted
a total of $1,678,644 in time-vesting restricted stock. Per the 2023 program, Mr. Woram’s total payout included $1,545,600
in cash and $31,383 in time-vesting restricted stock in lieu of cash.
2023 ANNUAL INCENTIVE PROGRAM COMPONENT AND TOTAL PAYOUT LEVELS(a)
| NEO |
API Performance
Component Payout |
Asset Efficiency
Component Payout |
Total Payout(b) |
| Mr. Mezger |
$ |
2,587,500 |
$ |
6,371,144 |
$ |
8,958,644 |
| Mr. Kaminski |
|
1,162,000 |
|
960,653 |
|
2,122,653 |
| Mr. McGibney |
|
1,487,500 |
|
1,705,113 |
|
3,192,613 |
| Mr. Praw |
|
966,000 |
|
735,060 |
|
1,701,060 |
| Mr. Woram |
|
966,000 |
|
610,983 |
|
1,576,983 |
| (a) |
Annex 2 to this Proxy Statement contains a reconciliation of our pretax income calculated in accordance with U.S. generally
accepted accounting principles (“GAAP”) to the non-GAAP financial measure of API. |
| (b) |
As discussed above, and as reflected in the Summary Compensation Table, Messrs. Mezger’s and Woram’s respective
total payouts are comprised of cash and time-vesting restricted stock. The total payouts for Messrs. Kaminski, McGibney
and Praw comprised only cash. |
| KB Home ■ 2024 Proxy Statement |
28 |
2024 Annual Incentive Program
The 2024 annual incentive program will be
similar to our 2023 program, including a primarily formula-driven funding structure established by API and asset efficiency performance
measures with payout levels determined by our outcomes on these measures and individual performance against key scorecard objectives.
The pre-established 2024 annual incentive program’s API target performance goal will reflect, among other things, the Compensation
Committee’s consideration of expected business conditions for the current year.
Long-Term Incentives
In October 2023, the Compensation Committee
approved long-term incentive awards to our NEOs consisting solely of PSUs to reinforce the alignment of pay with our performance
and stockholder value creation. The target values of these awards were again based on peer group and market data analysis. In order
to maintain commensurate pay arrangements intended to reward strong long-term performance and help retain key talent, the following
awards were made to our NEOs:
NEO LONG-TERM INCENTIVES GRANTED IN 2023
| |
PSUs # |
PSUs $ |
| Mr. Mezger |
124,717 |
$ |
5,500,020 |
| Mr. Kaminski |
34,014 |
|
1,500,017 |
| Mr. McGibney |
51,020 |
|
2,249,982 |
| Mr. Praw |
21,542 |
|
950,002 |
| Mr. Woram |
20,408 |
|
899,993 |
Performance-Based Restricted Stock Units
We have granted PSUs to our executive officers
each year since 2012. As with prior PSU grants, the PSUs granted in 2023 are designed to focus our executive officers on achieving
important long-term financial objectives over a three-year period. The 2023 PSU measures described below are a combination of absolute
and relative metrics that should generate positive outcomes for our business, and, if achieved, are expected to be strong drivers
of stockholder value creation.
| PSU Measures |
Weight |
|
Purpose |
| ■ |
Cumulative Adjusted Earnings Per Share (“AEPS”) |
40% |
|
Measures profitability trajectory over the period |
| ■ |
Average Adjusted Return on Invested Capital (“AROIC”) |
35% |
|
Measures profitability relative to capital deployed |
| ■ |
Revenue Growth Rank Versus Peers |
25% |
|
Measures top-line growth relative to peers |
The 2023 PSU amounts shown in the table above
reflect a target award of shares of our common stock and their grant date fair value. Each 2023 PSU entitles a recipient to a grant
of 0% to 200% of his target award depending on our performance relative to the above-noted performance measures over the three-year
period of December 1, 2023 to November 30, 2026. The AEPS and AROIC measures’ performance will be determined on a tax-effected
basis that excludes only pre-specified categories of compensation expense; certain inventory-related charges; and other extraordinary
items approved by the Compensation Committee. Upon vesting, each 2023 PSU recipient is entitled to receive a proportionate amount
of credited cash dividends that are paid in respect of one share of our common stock with a record date between the grant date
and the date the Compensation Committee determines the applicable performance achievements, if any. Except for death, disability
or certain retirement circumstances, a recipient will forfeit any rights to a 2023 PSU payout if the recipient terminates service
before the date the Compensation Committee determines the applicable performance achievements.
The following tables present our goals with
respect to the 2020 – 2023 absolute PSU performance measures. As shown below, the goals for both the AEPS and AROIC measures
generally increased year over year at threshold, target and maximum performance levels, reflecting the consistent improvement in
our performance in the prior-year periods and stockholder feedback. As it relates to fiscal 2022, when the Compensation Committee
established the PSU measures and goals in the fourth quarter of that year, homebuyer demand had turned sharply lower, stemming
from higher mortgage interest rates, persistent inflationary pressures and an uncertain economic outlook, as discussed above. Given
this environment, the Compensation Committee established 2022 PSU goals for both AEPS and AROIC that were lower than the goals
for the same measures under the 2021 PSUs. With market conditions relatively improved in our 2023 fourth quarter, the Compensation
Committee established both AEPS and AROIC goals at levels higher than those for all prior years. These goals reflect our expectations
regarding performance against the measures at the times that the goals were set.
| KB Home ■ 2024 Proxy Statement |
29 |
| Performance Measure |
PSU Grant Year |
Performance Period |
Threshold Goal |
Target Goal |
Maximum Goal |
| AEPS |
2020 |
2021-2023 |
$6.36 |
$9.09 |
$10.91 |
| 2021 |
2022-2024 |
$7.22 |
$10.32 |
$13.42 |
| 2022 |
2023-2025 |
$5.43 |
$7.75 |
$10.08 |
| 2023 |
2024-2026 |
$7.35 |
$10.50 |
$13.65 |
| AROIC |
2020 |
2021-2023 |
4.7% |
6.7% |
8.0% |
| 2021 |
2022-2024 |
6.2% |
8.9% |
11.6% |
| 2022 |
2023-2025 |
4.3% |
6.1% |
7.9% |
| 2023 |
2024-2026 |
6.3% |
9.0% |
11.7% |
We utilize a percentile rank approach to
determine the target award multiplier for the relative revenue growth measure as outlined in the table below. Payouts for performance
between the levels shown below are determined by straight-line interpolation.
| Relative Revenue Growth |
Performance (Rank) |
Target Award Multiplier |
| |
75th Percentile
or above |
200% |
| 50th Percentile
(Median) |
100% |
| 25th Percentile |
25% |
| Below
25th Percentile |
0% |
As with our annual incentive program, the
Compensation Committee intends the threshold performance levels outlined above to be reasonably achievable, yet uncertain to be
met under expected market and business conditions at the time of grant. Target performance levels are designed to require significant
management effort to achieve, and maximum performance levels are designed to be measurably more difficult to achieve than target
performance levels. Each of these performance levels directly scale to threshold, target and maximum payout opportunities. As vesting
for the PSUs granted in 2021 – 2023 will not be determined until after their respective performance periods end, we cannot
predict the extent to which any shares under these awards will ultimately vest.
2020 PSU Awards
The PSUs granted to our executive officers
in 2020 entitled recipients to a grant of 0% to 200% of a target award of shares of our common stock based on our AEPS performance,
AROIC performance, and relative revenue growth performance (with the respective rankings and multipliers as shown in the above
table) over the three-year period of December 1, 2020 to November 30, 2023. The applicable AEPS and AROIC performance measures
and goals are set forth below.
| 2020 PSU Performance Measure |
2020 PSU Performance Goals |
2020 PSU Target Award Multiplier |
| AEPS |
$10.91 and above |
200% |
| $9.09 |
100% |
| $6.36 |
25% |
| Below $6.36 |
0% |
| AROIC |
8.0% and above |
200% |
| 6.7% |
100% |
| 4.7% |
25% |
| Below 4.7% |
0% |
| KB Home ■ 2024 Proxy Statement |
30 |
2020 PSU AWARD DETERMINATIONS
| Performance Measure |
Average Annual Performance |
Aggregate Total Performance |
Target Award Multiplier |
| AEPS (40% weight) |
N/A |
$22.68* |
200% |
| AROIC (35% weight) |
13.3%* |
N/A |
200% |
| Relative Revenue Growth (25% weight) |
N/A |
91st percentile (2nd) |
200% |
| | |
| * | Annex 2 to this Proxy Statement contains a reconciliation of our net income and diluted earnings
per share calculated in accordance with GAAP to the non-GAAP financial measures of adjusted net income and adjusted earnings per
share used in computing AEPS and AROIC. |
The cumulative AEPS performance result for
the 2020 PSUs exceeded the challenging $10.91 maximum goal level set at the time of grant and reflected our emphasis on and success
at growing our diluted earnings per share by 125% amid volatile housing market conditions during the entire performance period.
Historically strong profitability and cumulative adjusted net income of approximately $2.01 billion contributed to a significant
increase in our adjusted return on invested capital, exceeding our maximum goal for this measure. The relative revenue ranking
for the 2020 PSUs reflected our robust revenue growth performance over the applicable period and put us in a strong 2nd place
within the peer group. Based on the relative revenue scale outlined in the above table, our performance placed us approximately
at the 91st percentile of our peer group, resulting in a payment of 200% for this measure. All of these outcomes were uncertain
at the time the 2020 PSUs were granted, and the Compensation Committee determined that they required significant management effort
to achieve and sustain through the entirety of the performance period.
On February 28, 2024, the Compensation Committee
certified the performance we achieved for the period ended November 30, 2023 and approved share grants with respect to the 2020
PSUs as set forth in the table below. Mr. McGibney was not a participant in the 2020 PSU program because he was not an eligible
executive officer at the time the 2020 PSUs were granted.
2020 PSU AWARDS
| NEO |
Target Award(#) |
Actual Award(#) |
| Mr. Mezger |
124,813 |
249,626 |
| Mr. Kaminski |
34,948 |
69,896 |
| Mr. Praw |
22,466 |
44,932 |
| Mr. Woram |
21,218 |
42,436 |
Executive Compensation Decision-Making Process and Policies
Pursuant to its charter, the Compensation
Committee oversees the decision-making process for our executive compensation and benefits policies and programs. In making executive
compensation decisions, the Compensation Committee considers a variety of factors and data, most importantly our performance and
individual executives’ performance, and the totality of compensation that may be paid. Data the Compensation Committee considers
includes our financial and operational performance, including comparisons to prior years’ performance, our current business
plans and our peer group; surveys and forecasts of comparative general industry and peer group compensation and benefits practices;
and, at least annually, management-prepared tally sheets for senior executives with up to six years of compensation data.
Role of Our Management and Compensation Consultants
Our CEO, senior human resources and legal
department executives, and FWC provide information and recommendations to assist the Compensation Committee’s decision-making
and advise on compliance and disclosure requirements. The Compensation Committee does not delegate its decision-making authority
to management, except for establishing certain performance goals under our performance cash program for participating division-level
personnel and certain administrative actions under our current equity compensation plan, but only to the extent consistent with
our equity-based award grant policy and applicable law. FWC, which the Compensation Committee directly retains, attends Compensation
Committee meetings as needed, communicates between meetings with the Compensation Committee chair and other committee members,
advises the Compensation Committee as to the CEO’s and other executive officers’ compensation, and assists the Compensation
Committee with the annual employee compensation risk assessment, as discussed under “Management Development and Compensation
Committee—Delegated Risk Oversight.” To maintain its independence and avoid any conflicts of interest, FWC may not
work directly for our management unless the Compensation Committee pre-approves the work, including fees. During 2023, FWC did
not provide any services that would have required such pre-approval. Based on its consideration of factors under New York Stock
Exchange (“NYSE”) listing standards, the Compensation Committee determined that FWC’s work did not raise any
conflicts of interest, and therefore considered FWC to be independent.
| KB Home ■ 2024 Proxy Statement |
31 |
Peer Group
Our peer group is composed solely of U.S.
public companies that, like us, are engaged in high production homebuilding as their primary business. We compete with all these
companies for both homebuyers and management talent. The competition with these companies for talent reflects our, and their, need
to attract and retain high caliber management and other personnel with strong high production homebuilding expertise and experience
to execute business activities nationally as well as in specific local markets. Therefore, a principal focus of our compensation
and benefits programs is to meet this critical competitive need. The Compensation Committee, in consultation with FWC and
our management, periodically reviews and considers changes to our peer group. The Compensation Committee principally considers
the competitive factors described above, as well as relative total revenues and market capitalization among the peer group companies.
The Compensation Committee considers the composition of our peer group at least annually, and the group’s members were last
adjusted during 2018. As of their most recently filed proxy statements before the date of this Proxy Statement, each member
of our peer group included us in its own peer group.
OUR PEER GROUP
|
■ Beazer
Homes USA, Inc.
■ Lennar
Corporation
■ NVR,
Inc.
■ Toll
Brothers, Inc.
|
■ D.R.
Horton, Inc.
■ M.D.C.
Holdings, Inc.
■ PulteGroup,
Inc.
■ Tri
Pointe Homes, Inc.
|
■ Hovnanian
Enterprises, Inc.
■ Meritage
Homes Corporation
■ Taylor
Morrison Home Corporation
|
As of December 31, 2023, the reported total
revenues (on a trailing 12-month basis) of the companies in our peer group were within a range of approximately 0.3 to 5.5 times
our total revenues, and our total revenues of $6.41 billion placed us at the 46th percentile of the peer group. Also, as of December
31, 2023, the market capitalization of our peer group was within a range of approximately 0.2 to 10.2 times our market capitalization,
and our market capitalization of $4.95 billion was in the second quartile of the peer group.
Equity Stock Ownership Policy
Our longstanding executive stock ownership
policy is intended to encourage, and has encouraged, our executives to increase their ownership of our common stock over time and
to align their interests with our stockholders’ interests. Under the policy, designated senior executives are expected to
achieve specific levels of common stock ownership within five years of joining us or being promoted to a position with a higher
ownership guideline and, once achieved, maintain such ownership throughout their employment with us. The targeted common stock
ownership levels for our NEOs are as follows:
| Executive |
Ownership Guideline |
| CEO |
6.0 times base salary |
| COO |
3.0 times base salary |
| Other NEOs |
2.0 times base salary |
Common stock ownership includes shares directly
owned by the NEO, and shares are valued at the greater of the most recent closing price on a valuation date and the closing price
on the date shares are acquired. Designated executives are required to hold all vested net (after-tax) shares of time-vesting and
performance-vesting restricted stock and up to 100% of net shares acquired through stock option exercises until their applicable
stock ownership guideline is met, absent a hardship or other qualified exception. Each of our NEOs is in compliance with the requirements
of the policy.
Prohibition on Hedging/Pledging of Our Securities
To further align their interests with those
of our stockholders, our employees and non-employee directors cannot engage in short sales of our securities and cannot buy or
sell puts, calls or any other financial instruments that are designed to hedge or offset decreases or increases in the value of
our securities. They also cannot hold our securities in a margin account or otherwise pledge our securities as collateral for any
loan.
| KB Home ■ 2024 Proxy Statement |
32 |
Equity-Based Award Grant Policy
Our equity-based award grant policy governs
the timing and establishes certain internal controls over the grant of equity-based awards, including stock options, restricted
stock and PSUs. The policy requires that the Compensation Committee (or the Board) approve all grants of equity-based awards and
their terms and does not permit delegation of this authority to our management. Per the policy, the exercise or grant price of
any relevant equity-based award cannot be less than the closing price of our common stock on the grant date.
Compensation Recovery Policy
The Board adopted in November 2023 an updated
incentive-based compensation recovery policy per the applicable NYSE listing standard. Under the policy, if we are required
to prepare an accounting restatement due to material noncompliance with any financial reporting requirement under the securities
laws, we will be entitled to recover in accordance with the listing standard the amount of erroneously awarded incentive-based
compensation an executive officer received. This policy replaced in its entirety a compensation recoupment policy the Board adopted
in 2018. In addition, under our CEO’s employment agreement, we may require him to repay certain bonus and incentive- or equity-based
compensation he receives as well as any profits realized from the sale of certain securities if we are required to restate our
financial statements as a result of his misconduct, consistent with Section 304 of the Sarbanes-Oxley Act of 2002.
Tax Implications of our Executive Compensation
Program
Due to changes to the Internal Revenue Code
(“Code”) enacted in 2017, specifically repealing an exemption for performance-based compensation, we are generally
not able to deduct compensation over $1.0 million paid to certain of our executive officers. The Compensation Committee will
approve compensation that may not be deductible under the Code where it believes it is in our and our stockholders’ best
interests to do so.
Indemnification Agreements
We have entered into agreements with each
NEO and certain other senior executives, which were updated in January 2024, that provide them with indemnification and advancement
of expenses to supplement what our Certificate of Incorporation and insurance policies provide, subject to certain limitations.
Severance, Change in Control and Post-Termination
Arrangements
Severance Arrangements
Mr. Mezger’s Employment Agreement
and our Executive Severance Plan, in which all our NEOs participate, provide certain severance benefits, as discussed under “Potential
Payments Upon Termination of Employment or Change in Control.” In considering our stockholders’ approval of an advisory
proposal, in 2008 we adopted a policy under which we will obtain stockholder approval before paying severance benefits to an executive
officer under a future severance arrangement in excess of 2.99 times the sum of the executive officer’s then-current base
salary and target bonus. Future severance arrangements do not include arrangements existing when we adopted the policy or that
we assume or acquire unless, in each case, any such arrangement is changed in a manner that materially increases its severance
benefits.
Change in Control Arrangements
Since 2001, we have maintained without modification
the terms of a Change in Control Severance Plan (“CIC Plan”) that provides participants with certain benefits, as discussed
under “Potential Payments Upon Termination of Employment or Change in Control.” The CIC Plan is intended to enable
and encourage our management to focus its attention on obtaining the best possible result for our stockholders in a change in control,
to promote management continuity, and to provide income protection if there is an involuntary loss of employment. All unvested
employee equity awards require double-trigger vesting in a change in control.
Death Benefits
Our Death Benefit Only Plan (“DBO Plan”),
in which Messrs. Mezger and Praw participate, provides a $1.0 million death benefit to a participant’s designated
beneficiary (plus an additional tax restoration amount sufficient to pay taxes on the benefit and the additional amount). We closed
the plan to new participants beginning in 2006. Since then, only term life insurance, with a $750,000 benefit level, has been made
available to incoming eligible executives, including Messrs. Kaminski, McGibney and Woram. We also maintain a $400,000 life insurance
death benefit for designated beneficiaries of Mr. Mezger.
| KB Home ■ 2024 Proxy Statement |
33 |
Other Benefits
Most of our health and welfare benefits are
made available to all full-time employees, including our NEOs. During 2023, as in prior years, our NEOs were eligible to participate
in a supplemental plan that reimburses them for qualified out-of-pocket expenses that exceed amounts payable under our standard
medical, dental and vision plans. Certain of our NEOs, and other employees, also participate in our unfunded nonqualified Deferred
Compensation Plan (“DCP”), which is described below. These market-competitive benefits are offered to attract and retain
key executive talent.
Retirement Programs
The KB Home 401(k) Savings Plan (“401(k)
Plan”), a qualified defined contribution plan, is the only post-employment benefit program we offer to all full-time employees.
We provide a dollar-for-dollar match of 401(k) Plan and DCP contributions up to an aggregate of 6% of a participant’s base
salary. Matching contributions generally vest after five years of service.
The DCP allows participants to make pretax
contributions of up to 75% of their base salary and 75% of their annual incentive compensation, and to select from one or more
investment options in which their deferred compensation is deemed to be invested. As we do not provide a guaranteed rate of
return under the DCP, a participant’s credited earnings depend on their investment elections. Deferred amounts together with
any credited investment returns under the DCP are paid out to participants in a lump sum or in installments, commencing either
at a participant-specified date during employment or upon termination of employment, subject to certain limitations. NEO deferrals
under the DCP are shown in the Non-Qualified Deferred Compensation During Fiscal Year 2023 table.
We also maintain a supplemental non-qualified,
unfunded retirement plan (“Retirement Plan”) for certain executives, including Mr. Mezger, whose participation is shown
in the Pension Benefits During Fiscal Year 2023 table. The Retirement Plan, closed to new participants since 2004 with no additional
benefit accruals to participants (other than the same cost-of-living adjustments applied to federal Social Security benefits),
provides each participant with specific annual payments for 20 years that begin upon the later of reaching age 55, the
tenth anniversary of a participation commencement date or the termination of employment with us. Mr. Mezger’s original
annual benefit amount under the Retirement Plan was $450,000. The change in our CEO’s pension value shown in the Summary
Compensation Table for 2021 is a required reporting item and represents only the actuarial increase in our CEO’s Retirement
Plan benefits based on interest rate fluctuations. It does not reflect any new plan benefits, cash or other compensation granted
to or received by our CEO that year.
Management Development and Compensation Committee Report
The Management Development and Compensation
Committee of the Board of Directors has reviewed and discussed the above “Compensation Discussion and Analysis” with
KB Home management. Based on this review and discussion, the Management Development and Compensation Committee recommended to the
Board of Directors that the “Compensation Discussion and Analysis” be included in this Proxy Statement.
Management Development and Compensation Committee
Melissa Lora, Chair
Arthur R. Collins
Jodeen A. Kozlak
Brian R. Niccol
James C. Weaver
| KB Home ■ 2024 Proxy Statement |
34 |
Executive Compensation
Summary Compensation Table
| Fiscal Year |
|
Salary
($)(a) |
|
Bonus
($) |
|
Stock
Awards
($)(b) |
|
Non-Equity
Incentive Plan
Compensation
($)(c) |
|
Change in Pension
Value and Nonqualified
Deferred Compensation
Earnings ($)(d) |
|
All Other
Compensation
($)(e) |
|
Total
($) |
| Jeffrey T. Mezger, Chairman and Chief Executive Officer |
|
|
|
|
|
|
|
| 2023 |
|
$ |
1,150,000 |
|
$ |
— |
|
$ |
7,178,664 |
|
$ |
7,280,000 |
|
$ |
— |
|
$ |
80,391 |
|
$ |
15,689,055 |
| 2022 |
|
|
1,150,000 |
|
|
— |
|
|
7,105,882 |
|
|
7,480,000 |
|
|
— |
|
|
78,909 |
|
|
15,814,791 |
| 2021 |
|
|
1,150,000 |
|
|
— |
|
|
4,999,996 |
|
|
7,995,919 |
|
|
142,560 |
|
|
78,043 |
|
|
14,366,518 |
| Jeff J. Kaminski, Executive Vice President and Chief Financial
Officer |
|
|
|
|
|
|
|
| 2023 |
|
|
812,500 |
|
|
— |
|
|
1,500,017 |
|
|
2,122,653 |
|
|
— |
|
|
61,841 |
|
|
4,497,011 |
| 2022 |
|
|
785,417 |
|
|
— |
|
|
1,400,008 |
|
|
2,272,201 |
|
|
— |
|
|
60,234 |
|
|
4,517,860 |
| 2021 |
|
|
757,500 |
|
|
— |
|
|
1,399,986 |
|
|
2,029,530 |
|
|
— |
|
|
58,593 |
|
|
4,245,609 |
| Robert V. McGibney, President and Chief Operating Officer |
|
|
|
|
|
|
|
| 2023 |
|
|
820,833 |
|
|
— |
|
|
2,249,982 |
|
|
3,723,971 |
|
|
— |
|
|
62,281 |
|
|
6,857,067 |
| 2022 |
|
|
770,833 |
|
|
— |
|
|
1,999,998 |
|
|
3,656,299 |
|
|
— |
|
|
59,308 |
|
|
6,486,438 |
| 2021 |
|
|
557,500 |
|
|
— |
|
|
2,000,014 |
|
|
2,685,311 |
|
|
— |
|
|
58,934 |
|
|
5,301,759 |
| Albert Z. Praw, Executive Vice President, Real Estate and Business
Development |
|
|
|
|
|
|
| 2023 |
|
|
675,417 |
|
|
— |
|
|
950,002 |
|
|
1,701,060 |
|
|
— |
|
|
53,148 |
|
|
3,379,627 |
| 2022 |
|
|
650,417 |
|
|
— |
|
|
899,986 |
|
|
1,821,451 |
|
|
— |
|
|
51,666 |
|
|
3,423,520 |
| 2021 |
|
|
628,333 |
|
|
— |
|
|
900,002 |
|
|
1,626,214 |
|
|
— |
|
|
63,806 |
|
|
3,218,355 |
| Brian J. Woram, Executive Vice President and General Counsel |
|
|
|
|
|
|
|
| 2023 |
|
|
675,417 |
|
|
— |
|
|
931,376 |
|
|
1,545,600 |
|
|
— |
|
|
47,866 |
|
|
3,200,259 |
| 2022 |
|
|
650,417 |
|
|
— |
|
|
1,045,327 |
|
|
1,489,600 |
|
|
— |
|
|
52,134 |
|
|
3,237,478 |
| 2021 |
|
|
628,333 |
|
|
— |
|
|
850,000 |
|
|
1,503,741 |
|
|
— |
|
|
50,843 |
|
|
3,032,917 |
| (a) |
Salary. As discussed under “Base Salaries,”
except for Mr. Mezger, NEO annual base salary levels were increased in July 2023 to the following amounts: Mr. Kaminski $830,000;
Mr. McGibney $850,000; Mr. Praw $690,000; and Mr. Woram $690,000. Mr. McGibney’s annual base salary was increased to
$900,000 in February 2024 in conjunction with his promotion to President and Chief Operating Officer. |
| (b) |
Stock Awards. These amounts include the aggregate grant date fair
value of stock awards (consisting of PSUs granted in October 2023) computed as described in Note 21 — Employee
Benefit and Stock Plans in the Notes to the Consolidated Financial Statements in our Annual Report. They do not represent
realized compensation. The October 2023 stock awards represent the grant date fair value of the probable award of shares of
our common stock underlying the PSUs granted. The grant date fair value of the PSUs if maximum performance is achieved is
as follows: Mr. Mezger $11,000,040; Mr. Kaminski $3,000,034; Mr. McGibney $4,499,964; Mr. Praw $1,900,004;
and Mr. Woram $1,799,986. The amounts for Messrs. Mezger and Woram also include the value of the respective restricted stock
grant each received on January 18, 2024, as discussed under “2023 Annual Incentives” and as shown under “Grants
of Plan-Based Awards During Fiscal Year 2023.” The grant date fair value of Mr. Mezger’s award was $1,678,644;
for Mr. Woram’s award, it was $31,383. |
| (c) |
Non-Equity Incentive Plan Compensation. For Mr. McGibney, the
amount reflects the sum of his annual incentive and a three-year performance cash award of $531,358 in 2023, $402,758 in 2022
and $275,011 in 2021, each originally granted to him prior to his becoming an executive officer in 2021. For all other NEOs,
the amounts reflect only the cash portion of their annual incentive payouts. |
| (d) |
Change in Pension Value and Nonqualified Deferred Compensation Earnings. These amounts
(as applicable) reflect the increase in the actuarial present value of accumulated benefits under our Retirement Plan. These
changes do not reflect any cash or other compensation received. |
| KB Home ■ 2024 Proxy Statement |
35 |
| (e) |
All Other Compensation. The amounts shown consist
of payouts of unused vacation balances in 2021 (Mr. McGibney $12,398 and Mr. Praw $13,431); and the following items: |
| |
■ |
401(k) Plan and DCP Matching Contributions. The respective aggregate
2023, 2022 and 2021 401(k) Plan and DCP matching contributions we made to our NEOs were as follows: Mr. Mezger $65,800,
$64,300 and $63,400; Mr. Kaminski $48,750, $47,125 and $45,450; Mr. McGibney $49,250, $46,250 and $33,450; Mr. Praw $40,525,
$39,025 and $37,700; and Mr. Woram $34,775, $39,025 and $37,700. |
| |
■ |
Premium Payments. The respective aggregate premiums we paid for our NEOs in 2023,
2022 and 2021 for a supplemental medical expense reimbursement plan and life insurance policies, as described under “Other
Benefits,” were as follows: Mr. Mezger $14,591, $14,609 and $14,643; Mr. Kaminski $13,091, $13,109 and $13,143;
Mr. McGibney $13,031, $13,058 and $13,086; Mr. Praw $12,623, $12,641 and $12,675; and Mr. Woram $13,091, $13,109
and $13,143. |
Grants of Plan-Based Awards During Fiscal Year 2023
| |
|
|
|
|
|
Estimated Future Payouts Under
Non-Equity Incentive
Plan Awards(b) |
|
Estimated Future Payouts
Under Equity Incentive
Plan Awards(c) |
|
Grant Date
Fair Value of
Stock and
Option
Awards
($)(d) |
| Name |
|
Grant
Date(a) |
|
Type of
Award |
|
Threshold
($) |
|
Target
($) |
|
Maximum
($) |
|
Threshold
(#) |
|
Target
(#) |
|
Maximum
(#) |
|
| Mr. Mezger |
|
2/24/2023 |
|
Annual Incentive |
|
$ |
1,293,750 |
|
$ |
2,587,500 |
|
$ |
8,280,000 |
|
|
|
|
|
|
|
|
|
| |
10/05/2023 |
|
PSUs |
|
|
|
|
|
|
|
|
|
|
31,179 |
|
124,717 |
|
249,434 |
|
$ |
5,500,020 |
| |
1/18/2024 |
|
Restricted Stock |
|
|
|
|
|
|
|
|
|
|
|
|
27,465 |
|
|
|
|
1,678,644 |
| Mr. Kaminski |
|
2/24/2023 |
|
Annual
Incentive |
|
|
581,000 |
|
|
1,162,000 |
|
|
2,788,800 |
|
|
|
|
|
|
|
|
|
| |
10/05/2023 |
|
PSUs |
|
|
|
|
|
|
|
|
|
|
8,504 |
|
34,014 |
|
68,028 |
|
|
1,500,017 |
| Mr. McGibney |
|
2/24/2023 |
|
Annual
Incentive |
|
|
743,750 |
|
|
1,487,500 |
|
|
3,570,000 |
|
|
|
|
|
|
|
|
|
| |
10/05/2023 |
|
PSUs |
|
|
|
|
|
|
|
|
|
|
12,755 |
|
51,020 |
|
102,040 |
|
|
2.249,982 |
| Mr. Praw |
|
2/24/2023 |
|
Annual
Incentive |
|
|
483,000 |
|
|
966,000 |
|
|
2,318,400 |
|
|
|
|
|
|
|
|
|
| |
10/05/2023 |
|
PSUs |
|
|
|
|
|
|
|
|
|
|
5,386 |
|
21,542 |
|
43,084 |
|
|
950,002 |
| Mr. Woram |
|
2/24/2023 |
|
Annual
Incentive |
|
|
483,000 |
|
|
966,000 |
|
|
1,545,600 |
|
|
|
|
|
|
|
|
|
| |
10/05/2023 |
|
PSUs |
|
|
|
|
|
|
|
|
|
|
5,102 |
|
20,408 |
|
40,816 |
|
|
899,993 |
| |
1/18/2024 |
|
Restricted Stock |
|
|
|
|
|
|
|
|
|
|
|
|
513 |
|
|
|
|
31,383 |
| (a) |
Grant Date. The date the Compensation Committee
approved each award. The January 18, 2024 restricted stock grants represent each applicable recipient’s portion of their
ultimate 2023 fiscal year annual incentive award, as discussed under “2023 Annual Incentives.” These awards vest
in three equal annual installments beginning January 18, 2025. |
| (b) |
Estimated Future Payouts Under Non-Equity Incentive Plan Awards.
The 2023 target payouts were set at 225% of base salary for our CEO and at 140% — 175% of base salary for each of our
other NEOs with the maximum incentive set at a multiple of four times target for our CEO, three times target for Messrs. Kaminski,
McGibney, and Praw, and two times target for Mr. Woram. Notwithstanding these potential maximum incentive calculations, “Maximum”
in the above table represents each officer’s maximum cash payout, which, as described under “2023 Annual Incentives,”
was limited to no more than 80% of a participant’s respective maximum opportunity. “Threshold” represents
the lowest possible payout if threshold performance is achieved for each performance measure. The performance measures are
described under “2023 Annual Incentives.” |
| (c) |
Estimated Future Payouts Under Equity Incentive Plan Awards. If
there is a payout of the PSUs, “Threshold” represents the lowest possible payout (25% of the target award of shares
granted) if threshold performance is achieved for each performance measure, and “Maximum” reflects the highest
possible payout (200% of the target award of shares granted). The performance measures are described under “Performance-Based
Restricted Stock Units.” If threshold performance is not achieved on all three measures, the NEOs will not receive any
payout of the PSUs. |
| (d) |
Grant Date Fair Value of Stock and Option Awards. The grant date fair value for each
award is computed as described in footnote (b) to the Summary Compensation Table. The 2023 PSUs represent the grant date fair
value of the probable award of shares of our common stock underlying the PSUs granted as of the grant date. The restricted
stock amounts for Messrs. Mezger and Woram are the value of the respective grant each received on January 18, 2024,
as discussed under “2023 Annual Incentives.” |
| KB Home ■ 2024 Proxy Statement |
36 |
Outstanding Equity Awards at Fiscal Year-End 2023
| |
|
|
|
Option Awards |
|
Stock Awards |
| Name |
|
Grant Date |
|
Number of
Securities
Underlying
Unexercised
Options
Exercisable
(#)(a) |
|
Option
Exercise
Price
($) |
|
Option
Expiration
Date |
|
Number of
Shares or
Units of
Stock That
Have Not
Vested
(#)(b) |
|
Market Value
of Shares or
Units of Stock
That Have
Not Vested
($)(c) |
|
Equity Incentive
Plan Awards:
Number of
Unearned Shares,
Units or Other
Rights That Have
Not Vested
(#)(d) |
|
Equity
Incentive Plan
Awards: Market or
Payout Value of
Unearned Shares,
Units
or Other Rights That
Have Not Vested
($)(d) |
| Mr. Mezger |
|
10/8/2015 |
|
333,000 |
|
$ |
14.92 |
|
10/8/2025 |
|
|
|
|
|
|
|
|
|
|
|
| |
10/6/2016 |
|
274,952 |
|
|
16.21 |
|
10/6/2026 |
|
|
|
|
|
|
|
|
|
|
|
| |
10/8/2020 |
|
|
|
|
|
|
|
|
|
249,626 |
|
$ |
13,005,515 |
|
|
|
|
|
| |
10/7/2021 |
|
|
|
|
|
|
|
|
|
|
|
|
|
|
127,194 |
|
$ |
6,626,807 |
| |
11/14/2022 |
|
|
|
|
|
|
|
|
|
|
|
|
|
|
166,003 |
|
|
8,648,756 |
| |
1/19/2023 |
|
|
|
|
|
|
|
|
|
60,514 |
|
|
3,152,779 |
|
|
|
|
|
| |
10/5/2023 |
|
|
|
|
|
|
|
|
|
|
|
|
|
|
124,717 |
|
|
6,497,756 |
| Mr.
Kaminski |
|
10/8/2015 |
|
115,000 |
|
|
14.92 |
|
10/8/2025 |
|
|
|
|
|
|
|
|
|
|
|
| |
10/6/2016 |
|
82,486 |
|
|
16.21 |
|
10/6/2026 |
|
|
|
|
|
|
|
|
|
|
|
| |
10/8/2020 |
|
|
|
|
|
|
|
|
|
69,896 |
|
|
3,641,582 |
|
|
|
|
|
| |
10/7/2021 |
|
|
|
|
|
|
|
|
|
|
|
|
|
|
35,614 |
|
|
1,855,489 |
| |
11/14/2022 |
|
|
|
|
|
|
|
|
|
|
|
|
|
|
46,481 |
|
|
2,421,660 |
| |
10/5/2023 |
|
|
|
|
|
|
|
|
|
|
|
|
|
|
34,014 |
|
|
1,772,129 |
| Mr.
McGibney |
|
10/9/2014 |
|
14,781 |
|
|
14.62 |
|
10/9/2024 |
|
|
|
|
|
|
|
|
|
|
|
| |
10/8/2015 |
|
14,000 |
|
|
14.92 |
|
10/8/2025 |
|
|
|
|
|
|
|
|
|
|
|
| |
10/6/2016 |
|
20,621 |
|
|
16.21 |
|
10/6/2026 |
|
|
|
|
|
|
|
|
|
|
|
| |
10/7/2021 |
|
|
|
|
|
|
|
|
|
|
|
|
|
|
50,878 |
|
|
2,650,744 |
| |
11/14/2022 |
|
|
|
|
|
|
|
|
|
|
|
|
|
|
66,401 |
|
|
3,459,492 |
| |
10/5/2023 |
|
|
|
|
|
|
|
|
|
|
|
|
|
|
51,020 |
|
|
2,658,142 |
| Mr.
Praw |
|
10/8/2020 |
|
|
|
|
|
|
|
|
|
44,932 |
|
|
2,340,957 |
|
|
|
|
|
| |
10/7/2021 |
|
|
|
|
|
|
|
|
|
|
|
|
|
|
22,895 |
|
|
1,192,830 |
| |
11/14/2022 |
|
|
|
|
|
|
|
|
|
|
|
|
|
|
29,880 |
|
|
1,556,748 |
| |
10/5/2023 |
|
|
|
|
|
|
|
|
|
|
|
|
|
|
21,542 |
|
|
1,122,338 |
| KB Home ■ 2024 Proxy Statement |
37 |
| |
|
|
|
Option Awards |
|
Stock Awards |
| Name |
|
Grant Date |
|
Number of
Securities
Underlying
Unexercised
Options
Exercisable
(#)(a) |
|
Option
Exercise
Price
($) |
|
Option
Expiration
Date |
|
Number of
Shares or
Units of
Stock That
Have Not
Vested
(#)(b) |
|
Market Value
of Shares or
Units of Stock
That Have
Not Vested
($)(c) |
|
Equity Incentive
Plan Awards:
Number of
Unearned Shares,
Units or Other
Rights That Have
Not Vested
(#)(d) |
|
Equity
Incentive Plan
Awards: Market or
Payout Value of
Unearned Shares,
Units
or Other Rights That
Have Not Vested
($)(d) |
| Mr. Woram |
|
10/8/2015 |
|
40,000 |
|
$ |
14.92 |
|
10/8/2025 |
|
|
|
|
|
|
|
|
|
|
|
| |
10/6/2016 |
|
53,272 |
|
|
16.21 |
|
10/6/2026 |
|
|
|
|
|
|
|
|
|
|
|
| |
10/8/2020 |
|
|
|
|
|
|
|
|
|
42,436 |
|
$ |
2,210,916 |
|
|
|
|
|
| |
10/7/2021 |
|
|
|
|
|
|
|
|
|
|
|
|
|
|
21,623 |
|
$ |
1,126,558 |
| |
11/14/2022 |
|
|
|
|
|
|
|
|
|
|
|
|
|
|
28,220 |
|
|
1,470,262 |
| |
1/19/2023 |
|
|
|
|
|
|
|
|
|
5,613 |
|
|
292,437 |
|
|
|
|
|
| |
10/5/2023 |
|
|
|
|
|
|
|
|
|
|
|
|
|
|
20,408 |
|
|
1,063,257 |
| (a) |
Number of Securities Underlying Unexercised Options Exercisable. Subsequent to our 2023 fiscal year end, Mr. Mezger
exercised all 333,000 stock options granted to him on October 8, 2015; Mr. Kaminski exercised all 115,000 stock options granted
to him on October 8, 2015; Mr. McGibney exercised all 14,781 stock options granted to him on October 9, 2014; and Mr. Woram
exercised all stock options granted to him on October 8, 2015 and October 6, 2016. |
| (b) |
Number of Shares or Units of Stock That Have Not Vested. The October 8, 2020 shares represent the shares of our
common stock the Compensation Committee approved for grant on February 28, 2024 pursuant to the 2020 PSUs based on our performance
through the performance period, as described under “2020 PSU Awards.” Upon this approval, the earned 2020 PSU-related
shares became fully vested and unrestricted. The January 19, 2023 shares for Messrs. Mezger and Woram represent the portion
of their earned 2022 fiscal year annual incentive that exceeded their cash payout limits under the program; these shares vest
in three equal annual installments beginning on January 19, 2024. The table does not include the 27,465 and 513 restricted
stock awards granted on January 18, 2024 to Messrs. Mezger and Woram, respectively, representing the portion of their earned
2023 fiscal year annual incentive that exceeded their cash payout limit under the program, as discussed under “2023
Annual Incentives.” These shares vest in three equal annual installments beginning on January 18, 2025. |
| (c) |
Market Value of Shares or Units of Stock That Have Not Vested. The market value shown is based on the closing price
of our common stock on November 30, 2023, which was $52.10. |
| (d) |
Equity Incentive Plan Awards: Number and Market or Payout Value of Unearned Shares, Units or Other Rights That
Have Not Vested. The awards shown are the PSUs granted to our NEOs in 2021, 2022 and 2023, reflecting target award amounts
as of November 30, 2023, and the closing price of our common stock on November 30, 2023, which was $52.10. These PSUs will
vest based on our achievement of certain performance measures, as described under “Performance-Based Restricted Stock
Units,” over an applicable three-year performance period and subject to the recipients being employed through the date
that the Compensation Committee determines the number of shares that were earned pursuant to the PSUs. |
Option Exercises and Stock Vested During Fiscal Year 2023
| Name |
Option Awards |
|
Stock Awards |
Number of Shares
Acquired on Exercise
(#) |
Value Realized
on Exercise
($) |
Number of Shares
Acquired on Vesting
(#)(a) |
Value Realized
on Vesting
($)(b) |
| Mr. Mezger |
150,000 |
$ |
4,293,840 |
|
249,626 |
$ |
15,966,079 |
| Mr. Kaminski |
108,396 |
|
3,960,051 |
|
69,896 |
|
4,470,548 |
| Mr. McGibney |
— |
|
— |
|
2,288 |
|
96,920 |
| Mr. Praw |
— |
|
— |
|
44,932 |
|
2,873,851 |
| Mr. Woram |
40,000 |
|
1,515,356 |
|
42,436 |
|
2,714,207 |
| (a) |
The shares reported are the total each NEO acquired from the vesting of their 2020 PSU awards, as discussed under “Long-Term
Incentives,” except for Mr. McGibney, who acquired his reported shares through the vesting of a restricted stock
award granted to him in 2020. |
| (b) |
The amount shown is the total gross dollar value realized upon the vesting of the PSUs and the restricted stock, based
on the closing price of our common stock on the vesting dates, and the applicable Dividend Equivalents paid on the earned
PSUs. The restricted stock vested on October 25, 2023 with a closing price of $42.36 and the PSUs vested on February 28, 2024
with a closing price of $63.96. |
| KB Home ■ 2024 Proxy Statement |
38 |
Pension Benefits During Fiscal Year 2023
| Name* |
Plan Name |
Number of Years
Credited Service
(#)(a) |
|
Present Value of
Accumulated Benefit
($)(b) |
|
Payments During
Last Fiscal Year
($) |
| Mr. Mezger |
Retirement Plan |
30 |
|
$ |
10,997,651 |
|
$ |
— |
| * |
Messrs. Kaminski, McGibney, Praw and Woram are not participants in the Retirement Plan, as the plan was open for
a limited period and closed to new participants in 2004. |
| (a) |
Number of Years of Credited Service. This is as of the valuation date. As of November 30, 2023, Mr. Mezger
is fully vested in his Retirement Plan benefit. |
| (b) |
Present Value of Accumulated Benefit. This amount represents the actuarial present value of
the total retirement benefit that would be payable to Mr. Mezger under the Retirement Plan as of November 30, 2023. The
payment of Retirement Plan benefits is described under “Retirement Programs.” The following key actuarial assumptions
and methodologies were used to calculate this present value: the base benefit is assumed to begin as of the earliest possible date
(generally the later of age 55 or the 10th anniversary of the commencement of participation); the base benefit is
adjusted by past and future cost of living adjustments including a 3.2% increase for the fiscal year ending November 30, 2024 and
an assumed 2.25% annual increase thereafter, until the last benefits are paid. The discount rate used to calculate the present value
of the accumulated benefit shown in the table was 5.15%. Mr. Mezger is entitled to receive a lump sum payment of the actuarial value
(as specified under the Retirement Plan) of his plan benefits in the event of a change in control or death. If any such event occurred
on November 30, 2023, the payment to Mr. Mezger would be $11,306,529, using a 4.83% Applicable Federal Rate discount rate, as specified
under the Retirement Plan. |
Non-Qualified Deferred Compensation During Fiscal Year
2023
| Name |
Executive
Contributions in
Last Fiscal Year
($)(a) |
Registrant
Contributions in
Last Fiscal Year
($)(b) |
Aggregate
Earnings in Last
Fiscal Year
($)(c) |
Aggregate
Withdrawals/
Distributions
($) |
Aggregate
Balance at Last
Fiscal Year End
($)(d) |
| Mr. Mezger |
$ |
46,000 |
$ |
46,000 |
$ |
420,104 |
$ |
— |
$ |
4,241,469 |
| Mr. Kaminski |
|
48,750 |
|
28,950 |
|
94,570 |
|
— |
|
1,268,585 |
| Mr. McGibney |
|
99,250 |
|
29,450 |
|
42,421 |
|
— |
|
679,934 |
| Mr. Praw |
|
40,525 |
|
20,725 |
|
32,541 |
|
(238,777) |
|
650,163 |
| Mr. Woram |
|
28,679 |
|
14,975 |
|
55,070 |
|
— |
|
850,450 |
| (a) |
Executive Contributions in Last Fiscal Year. These amounts reflect compensation the NEOs earned
in 2023 that they have voluntarily deferred. The amounts are included in the Summary Compensation Table. |
| (b) |
Registrant Contributions in Last Fiscal Year. These amounts are matching contributions we made to the NEOs’
voluntary contributions to our DCP and are included in the Summary Compensation Table. The DCP is discussed under “Retirement
Programs.” |
| (c) |
Aggregate Earnings in Last Fiscal Year. These amounts do not include any above-market or preferential earnings.
Accordingly, these amounts are not reported in the Summary Compensation Table. |
| (d) |
Aggregate Balance at Last Fiscal Year End. These amounts reflect compensation the NEOs earned in 2023 or in prior
years, but which they voluntarily elected to defer receipt, adjusted for changes in the value of their investments and distributions,
if any. All the NEOs are fully vested in their respective balances. A portion of these amounts was previously reported as
deferred compensation in the Summary Compensation Tables in our proxy statements for our 2020 annual meeting. |
Pay Versus Performance
The following table presents information as
required under Item 402(v) of SEC Regulation S-K regarding the relationship for the three most recently completed fiscal years
between the compensation of our NEOs – as reported in the Summary Compensation Table and adjusted to reflect “compensation
actually paid” (“CAP”) as defined under SEC rules – and our performance relative to the identified metrics.
Our compensation philosophy and how we align executive compensation with our performance is described under “Compensation
Discussion and Analysis.” The CAP amounts disclosed do not reflect the actual amount of compensation earned, realized,
or received by our NEOs during the applicable fiscal year. The Compensation Committee did not consider the information provided
in this section in making its compensation decisions for the years shown.
| KB Home ■ 2024 Proxy Statement |
39 |
Fiscal
Year |
Summary
Compensation
Table Total for
PEO
($) |
Compensation
Actually Paid to
PEO
($)(a) |
Average
Summary
Compensation
Table Total for
Other NEOs
($)(b) |
Average
Compensation
Actually Paid to
Other NEOs
($)(a)(b) |
|
Value of Initial Fixed $100
Investment Based on: |
|
Net Income
($000s)(e) |
AEPS
($)(f) |
Total
Shareholder
Return
($)(c) |
Peer Group
Total
Shareholder
Return
($)(d) |
| 2023 |
$ |
15,689,055 |
$ |
43,713,700 |
$ |
4,483,491 |
$ |
10,469,248 |
|
$ |
155.12 |
$ |
176.92 |
|
$ |
590,177 |
$ |
7.18 |
| 2022 |
|
15,814,791 |
|
12,168,706 |
|
4,416,324 |
|
4,273,279 |
|
|
92.08 |
|
112.90 |
|
|
816,666 |
|
9.36 |
| 2021 |
|
14,366,518 |
|
25,125,414 |
|
4,556,264 |
|
7,144,468 |
|
|
115.18 |
|
133.37 |
|
|
564,746 |
|
6.14 |
| |
|
2023 |
|
2022 |
|
2021 |
| PEO |
Average
Other NEOs |
PEO |
Average
Other NEOs |
PEO |
Average
Other NEOs |
| Summary Compensation Table Total |
|
$ |
15,689,055 |
$ |
4,483,491 |
|
$ |
15,814,791 |
$ |
4,416,324 |
|
$ |
14,366,518 |
$ |
4,556,264 |
| Adjustments: |
|
|
|
|
|
|
|
|
|
|
|
|
|
|
|
| Grant date fair value of stock awards from Summary Compensation Table |
|
|
(7,178,664) |
|
(1,407,844) |
|
|
(7,105,882) |
|
(1,336,330) |
|
|
(4,999,996) |
|
(1,575,004) |
| Fair value of equity awards granted in the year and unvested as of year end(1) |
|
|
14,848,740 |
|
3,050,249 |
|
|
9,171,068 |
|
2,361,535 |
|
|
8,901,354 |
|
2,803,936 |
| Increase (decrease) in fair value from prior year end of outstanding and unvested awards granted
in prior years(2) |
|
|
18,435,361 |
|
4,092,993 |
|
|
(5,939,248) |
|
(1,127,786) |
|
|
5,205,965 |
|
1,168,011 |
| Increase (decrease) in fair value from prior year end of vested awards granted in prior years(3) |
|
|
1,035,950 |
|
169,437 |
|
|
(569,805) |
|
(112,753) |
|
|
1,201,244 |
|
163,721 |
| Dividends paid on awards during the year before vesting |
|
|
548,099 |
|
80,922 |
|
|
408,026 |
|
72,289 |
|
|
202,027 |
|
27,540 |
| “Change in pension value and nonqualified deferred compensation earnings” from Summary Compensation
Table |
|
|
- |
|
- |
|
|
- |
|
- |
|
|
(142,560) |
|
- |
| Service cost for pension plans |
|
|
335,159 |
|
- |
|
|
389,756 |
|
- |
|
|
390,862 |
|
- |
| CAP (as calculated per SEC rules) |
|
$ |
43,713,700 |
$ |
10,469,248 |
|
$ |
12,168,706 |
$ |
4,273,279 |
|
$ |
25,125,414 |
$ |
7,144,468 |
| (b) |
Mr. Mezger served as our PEO for each fiscal year shown. Our other NEOs were as follows: Messrs. Kaminski, McGibney,
Praw and Woram for the 2023 and 2022 fiscal years; and Messrs. Kaminski, McGibney and Praw, and Matthew W. Mandino for the
2021 fiscal year. |
| (c) |
The amounts reported reflect the cumulative total shareholder return (“TSR”) on our common stock for each
of the last three fiscal years ended November 30, 2023, assuming an investment of $100 on November 30, 2020, and the
reinvestment of dividends. |
| (d) |
The peer group used in this disclosure is the Dow Jones US Home Construction Index, which is the same index we used in
the Stock Performance Graph in our Annual Report. The amounts reported reflect the cumulative TSR of the Dow Jones US Home
Construction Index for each of the last three fiscal years ended November 30, 2023, assuming an investment of $100 on November
30, 2020, and the reinvestment of dividends. |
| (e) |
Represents net income reported in our audited consolidated financial statements for each of the applicable fiscal years. |
| (f) |
Annex 2 to this Proxy Statement contains a reconciliation of our diluted earnings per share calculated in accordance with
GAAP to the non-GAAP financial measure of AEPS. We included AEPS as our company-selected financial measure as this metric
has the largest weighting in determining our NEO’s long-term incentive compensation, a significant component of their
overall compensation. |
| KB Home ■ 2024 Proxy Statement |
40 |
Relationship between CAP and Financial Performance
Measures
The graphs below illustrate the relationships
between CAP for the PEO and the average CAP for our other NEOs, with (i) the cumulative TSR of our common stock, (ii) our net
income, and (iii) our AEPS, each as set forth in the Pay Versus Performance table above, as well as the relationship between the
cumulative TSR of our common stock and of the Dow Jones US Home Construction Index.
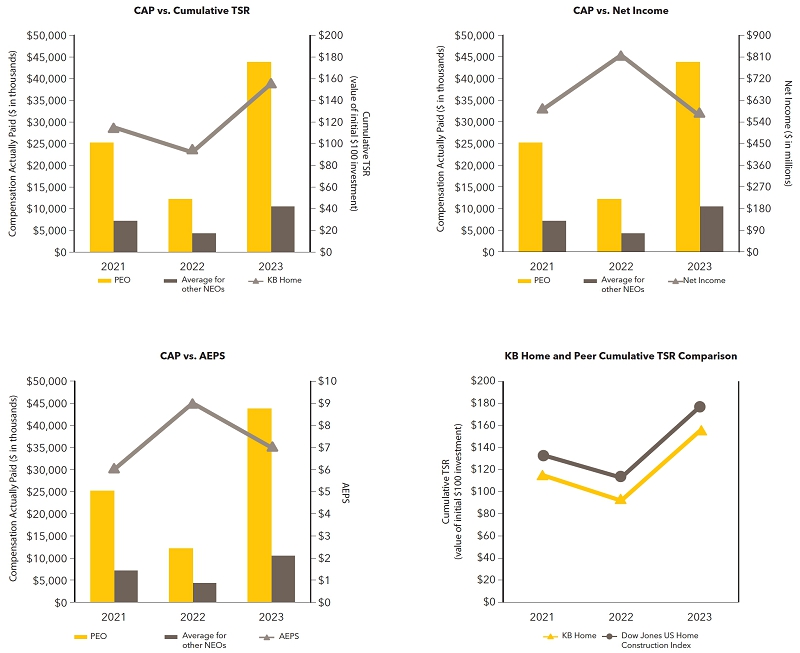
Pay Versus Performance Tabular List
Below is a list of the most important financial
performance measures we used to link CAP for our NEOs to our performance for the fiscal year ended November 30, 2023. Our use
of these measures is discussed under “Compensation Discussion and Analysis.”
| ■ |
AEPS (the company-selected measure); |
| ■ |
AROIC; |
| ■ |
Adjusted pretax income; |
| ■ |
Revenue growth, relative to our peer group; |
| ■ |
Strategic measures, to the extent they incorporate or reflect financial performance metrics. |
| KB Home ■ 2024 Proxy Statement |
41 |
CEO Pay Ratio
For our last completed fiscal year ended November 30, 2023:
| ■ |
The annual total compensation of our median employee (excluding Mr. Mezger), based
on W-2 compensation paid in the 12-month period ended November 30, 2023, and calculated consistent with how NEO total compensation
is calculated for the Summary Compensation Table, was $119,068. |
| ■ |
Mr. Mezger’s annual total compensation, as reported in the 2023 Summary Compensation
Table, was $15,689,055. |
| ■ |
Based on this information, the ratio of Mr. Mezger’s annual total compensation to our
identified median employee’s is 132 to 1. |
As of November 30, 2023, we had approximately 2,211 full-time and part-time employees.
In identifying the median employee, we excluded our CEO and six employees who did not have regular earnings in the fiscal year
due to extended leaves of absence or being hired at the end of November 2023. As the exact median employee compensation value
fell between two employees whose W-2 compensation differed by approximately $65, we selected the individual with the longest tenure.
Because companies are allowed to identify the median employee and determine a CEO
pay ratio using various methodologies, estimates and assumptions applicable to their own employee populations, compensation practices
and other circumstances, the pay ratio other companies report – including those in our peer group – may not be comparable
to the foregoing pay ratio.
Potential Payments Upon Termination of Employment or Change in Control
Based on the terms of certain of our employee benefit plans – primarily our
Executive Severance Plan and our CIC Plan – our NEOs are entitled to certain payments and other benefits if their employment
is terminated under certain circumstances and/or if we experience a change in control. Mr. Mezger is also entitled to certain
payments and other benefits in such circumstances under the terms of his Employment Agreement. Per Section 409A of the Code, certain
payments to our NEOs would not commence for six months following a termination of employment.
Termination of Employment
If we terminate Mr. Mezger without cause or he resigns for good reason (each as
defined in his Employment Agreement), or if we terminate any of the other NEOs without cause (as defined in the Executive Severance
Plan), each is entitled to receive a cash severance payment equal to a multiple of base salary and average bonus. For Mr. Mezger,
the severance amount is 2.0 times the sum of his annual salary plus average annual bonus earned for the prior three years, with
the total payment capped at $6.0 million. Mr. Mezger would additionally receive a prorated bonus for the year in which his
employment terminates. For our other NEOs, the severance amount is 2.0 times the sum of their respective annual base salary
in effect at the time of termination and average bonus. The applicable average bonus is the lesser of (a) the average of
the annual cash bonuses, if any, paid to them for the three most recent completed fiscal years prior to termination; or (b) 3.0
times their annual base salary. Each NEO is also entitled to a continuation of health coverage for up to two years. In each case,
the foregoing benefits are subject to an affected NEO’s executing a release and post-termination non-solicitation (for two
years), non-disparagement and confidentiality obligations.
For equity awards granted to Mr. Mezger on and after the effective date of his Employment
Agreement, he is entitled to (a) two years of additional service credited to compute equity vesting plus full vesting
for any equity issued to him in lieu of cash bonuses; (b) the earlier of 36 months and the original term duration of
each equity grant to exercise any such outstanding equity; and (c) performance shares paid as if the performance period closed
on the termination date if the performance period would otherwise close in the next 24 months.
Change in Control
If Mr. Mezger’s employment is terminated without cause or he resigns
for good reason in a change in control (generally, per his Employment Agreement, during the period starting three months before
and ending 12 months after a change in control), he is entitled, subject to the same conditions described under “Termination
of Employment,” to (a) a severance payment as described above, with a 3.0 times multiple rather than 2.0 times and total
payment capped at $12.0 million; (b) health coverage continuation for up to two years; (c) full vesting and lump sum
cash payment of deferred compensation, retirement or other employee benefits per the relevant arrangements, with any lump sum
payments subject to Section 409A of the Code permitted only as provided by those arrangements; and (d) an additional amount
to compensate for any excise taxes under Section 280G of the Code (“Section 280G”).
If a change of control occurs, each of our other NEOs is entitled to receive, upon
executing a release and if in the following 18-month period his employment is terminated other than for cause or disability, or
he terminates employment for good cause (in each case, as defined in the CIC Plan), a severance benefit of 2.0 times the sum of
his average base salary and average actual annual cash bonus for the three fiscal years prior to the year in which the change
in control occurs. While Mr. Mezger is a CIC Plan participant, he can receive only CIC Plan benefits that do not duplicate
those provided under his Employment Agreement, and his total CIC Plan severance benefit is capped at $12.0 million.
| KB Home ■ 2024 Proxy Statement |
42 |
Per the terms of each recipient’s award agreement, the vesting of our NEOs’
outstanding equity awards will not accelerate upon a change in control unless the recipient is terminated without cause or resigns
for good reason within 18 months. Generally, if such a termination occurs (a) within the first year of the award’s performance
period, the recipient will receive a target payout; (b) after the first year of the award’s performance period, the recipient
will receive a payout determined using prorated calculations of the applicable performance measures; and (c) before the award’s
performance period begins, the recipient will receive no payout of the award. In addition, under the CIC Plan, only Mr. Mezger
and four other senior executives can potentially receive an additional tax restoration amount to compensate for any excise taxes
imposed on them under Section 280G and for any taxes on the additional amount. Pursuant to a Board policy, since April 7,
2011, we have not extended this tax restoration benefit to any other officer or employee, including all the other NEOs, even though
they are CIC Plan participants.
Other Change in Control and Employment
Termination Provisions
Our restricted stock award agreements provide for accelerated vesting upon the recipient’s
death or disability. Our PSU award agreements provide for pro rata vesting if the recipient retires under certain circumstances,
and for accelerated vesting upon death or disability; provided that any payout is delayed until the performance period is completed.
The time a recipient can exercise a common stock option after termination of employment depends on the reason for termination.
For example, they may have only five days if termination is for cause; while for retirement, death or disability, they may have
the original term.
Our DCP provides for full vesting of benefits if there is a change in control or
disability, as defined under the plan, or death. Under our Retirement Plan, a participant will immediately receive a lump sum
payment of the actuarial value (as specified under the plan) of the participant’s plan benefits if there is a change in
control or death. Our DBO Plan provides for (a) distribution of an insurance contract to a participant sufficient to pay the death
benefit (if death occurs before age 100); and (b) an additional tax restoration amount sufficient to pay specified taxes caused
thereby, if there is a change in control as defined in the plan. We also maintain term life insurance policies that pay benefits
upon certain NEOs’ deaths, as described under “Death Benefits.”
The tables below show payments our NEOs may receive assuming various employment
termination and change in control scenarios occurred on November 30, 2023, with equity awards valued at the $52.10 closing price
of our common stock on that date. The tables reflect that references to “bonuses” in Mr. Mezger’s Employment
Agreement, the Executive Severance Plan or the CIC Plan include the amounts in the Summary Compensation Table’s “Non-Equity
Incentive Plan Compensation” column. The amounts shown do not include the value of unexercised stock options reported
in the Outstanding Equity Awards at Fiscal Year-End 2023 table, accrued Retirement Plan and DCP amounts reported in the Pension
Benefits During Fiscal Year 2023 table and the Non-Qualified Deferred Compensation During Fiscal Year 2023 table (and associated
footnotes), respectively, term life insurance benefits or generally available employee benefits. In none of the change in control
scenarios below would our NEOs receive a tax restoration benefit under the CIC Plan, nor would our CEO receive a tax restoration
benefit under his Employment Agreement.
| KB Home ■ 2024 Proxy Statement |
43 |
Potential Payments Upon Termination
Of Employment Or Change In Control
Post-Employment Payments — Mr. Mezger
Executive Payments
and Benefits
upon Termination
or Change in Control |
|
Voluntary
Termination |
|
Involuntary
Termination
for Cause |
|
Involuntary
Termination
Without Cause/
Termination for
Good Reason |
|
Change in
Control
Without
Termination |
|
Change in
Control With
Termination for
Good Reason or
Without Cause |
|
Death |
|
Disability |
| Severance |
$ |
— |
$ |
— |
$ |
14,035,244 |
$ |
— |
$ |
20,035,244 |
$ |
— |
$ |
— |
| Long-term Incentives(a) |
|
|
|
|
|
|
|
|
|
|
|
|
|
|
| Restricted Stock |
|
— |
|
— |
|
2,101,870 |
|
— |
|
3,152,779 |
|
3,152,779 |
|
3,152,779 |
| PSUs |
|
21,214,050 |
|
— |
|
21,214,050 |
|
— |
|
29,093,445 |
|
36,416,333 |
|
36,416,333 |
| DBO Plan(b) |
|
— |
|
— |
|
— |
|
989,764 |
|
989,764 |
|
1,652,893 |
|
— |
| Health Benefits(c) |
|
— |
|
— |
|
80,495 |
|
— |
|
80,495 |
|
— |
|
— |
| Credited Vacation(d) |
|
88,462 |
|
88,462 |
|
88,462 |
|
— |
|
88,462 |
|
88,462 |
|
88,462 |
| TOTAL |
$ |
21,302,512 |
$ |
88,462 |
$ |
37,520,421 |
$ |
989,764 |
$ |
53,440,189 |
$ |
41,310,467 |
$ |
39,657,574 |
| (a) |
Assumes Mr. Mezger’s 2020 PSUs pay out at 200% of the target value and other PSU grants pay out
at 100% of target or prorated target values. Except for death and disability scenarios, assumes (i) Mr. Mezger’s 2023
PSUs have no value as the performance period would not have started by November 30, 2023; and (ii) Mr. Mezger’s
termination would be considered a retirement under the applicable award agreements. Therefore, in the voluntary termination
scenario, Mr. Mezger would receive full payout of his 2020 PSUs (at 200% of target), two-thirds of his 2021 PSUs and one-third
of his 2022 PSUs. Mr. Mezger's restricted stock awards would immediately vest upon death, disability, and as a result
of a qualifying termination in connection with a change in control. In an involuntary termination without cause or termination
for good reason, he would vest in the restricted stock awards scheduled to vest in the 24 months following his termination. |
| (b) |
Mr. Mezger’s designated beneficiaries would be entitled to receive an estimated death benefit of $1,652,893
($1,000,000 benefit plus an income tax restoration payment of $652,893) upon his death. The present value of the benefit as
of November 30, 2023 is approximately $687,405 based on a 5.32% discount factor and the PRI-2012 Top Quartile Employee
and Healthy Annuitant Table (M/F), with the MP-2021 generational projection scales for life expectancy (consistent with mortality
tables and rates used for Accounting Standards Codification Topic No. 715, “Compensation — Retirement Benefits”
(“ASC 715”) valuations). For the change in control scenarios, the amounts shown are the cash surrender value of
the underlying life insurance policy as of November 30, 2023 of $575,548 and an estimated tax restoration payment of
$414,216. |
| (c) |
Assumes we make 24 months of contributions for health benefits of approximately $3,354 per month. |
| (d) |
Assumes payout of 160 hours of vacation benefits, which Mr. Mezger is credited with during his employment, regardless
of actual vacation time taken. |
Post-Employment Payments — Mr. Kaminski
Executive Payments
and Benefits
upon Termination
or Change in Control |
|
Voluntary
Termination |
|
Involuntary
Termination
for Cause |
|
Involuntary
Termination
Without Cause/
Termination for
Good Reason |
|
Change in
Control
Without
Termination |
|
Change in
Control With
Termination for
Good Reason or
Without Cause |
|
Death |
|
Disability |
| Severance |
$ |
— |
$ |
— |
$ |
5,631,562 |
$ |
— |
$ |
5,496,840 |
$ |
— |
$ |
— |
| Long-term Incentives(a) |
|
|
|
|
|
|
|
|
|
|
|
|
|
|
| PSUs |
|
5,939,964 |
|
— |
|
5,939,964 |
|
— |
|
8,146,195 |
|
10,146,823 |
|
10,146,823 |
| Health Benefits(b) |
|
— |
|
— |
|
61,074 |
|
— |
|
— |
|
— |
|
— |
| TOTAL |
$ |
5,939,964 |
$ |
— |
$ |
11,632,600 |
$ |
— |
$ |
13,643,035 |
$ |
10,146,823 |
$ |
10,146,823 |
| (a) |
The values for Mr. Kaminski’s PSU award-related payouts reflect the same
assumptions as described in footnote (a) of Mr. Mezger’s table. |
| (b) |
Assumes we make 24 months of contributions for health benefits of approximately $2,545 per
month. |
| KB Home ■ 2024 Proxy Statement |
44 |
Post-Employment Payments — Mr. McGibney
Executive Payments
and Benefits
upon Termination
or Change in Control |
Voluntary
Termination |
Involuntary
Termination
for Cause |
Involuntary
Termination
Without Cause/
Termination for
Good Reason |
Change in
Control
Without
Termination |
Change in
Control With
Termination for
Good Reason or
Without Cause |
Death |
Disability |
| Severance |
$ |
— |
$ |
— |
$ |
6,619,227 |
$ |
— |
$ |
6,084,783 |
$ |
— |
$ |
— |
| Long-term Incentives(a) |
|
|
|
|
|
|
|
|
|
|
|
|
|
|
| PSUs |
|
— |
|
— |
|
— |
|
— |
|
6,230,490 |
|
9,201,888 |
|
9,201,888 |
| Performance Cash |
|
— |
|
— |
|
— |
|
— |
|
— |
|
531,358 |
|
531,358 |
| Health Benefits(b) |
|
— |
|
— |
|
74,768 |
|
— |
|
— |
|
— |
|
— |
| TOTAL |
$ |
— |
$ |
— |
$ |
6,693,995 |
$ |
— |
$ |
12,315,273 |
$ |
9,733,246 |
$ |
9,733,246 |
| (a) |
The values for Mr. McGibney's 2021, 2022 and 2023 PSU award related payouts reflect
the same assumptions as described in footnote (a) of Mr. Mezger's table, except that Mr. McGibney is not currently eligible
to retire under the terms of the applicable award agreements. Upon death or disability, he or his beneficiaries would be entitled
to receive performance cash payments as if he had remained employed through the determination date; the 2020 performance cash
award is assumed to pay out at 193.22% of the award. |
| (b) |
Assumes we make 24 months of contributions for health benefits of approximately $3,115 per
month. |
Post-Employment Payments — Mr. Praw
Executive Payments
and Benefits
upon Termination
or Change in Control |
Voluntary
Termination |
Involuntary
Termination
for Cause |
Involuntary
Termination
Without Cause/
Termination for
Good Reason |
Change in
Control
Without
Termination |
Change in
Control With
Termination for
Good Reason or
Without Cause |
Death |
Disability |
| Severance |
$ |
— |
$ |
— |
$ |
4,563,474 |
$ |
— |
$ |
4,449,307 |
$ |
— |
$ |
— |
| Long-term Incentives(a) |
|
|
|
|
|
|
|
|
|
|
|
|
|
|
| PSUs |
|
3,818,485 |
|
— |
|
3,818,485 |
|
— |
|
5,236,759 |
|
6,505,080 |
|
6,505,080 |
| DBO Plan(b) |
|
— |
|
— |
|
— |
|
1,360,455 |
|
1,360,455 |
|
2,012,072 |
|
— |
| Health Benefits(c) |
|
— |
|
— |
|
61,074 |
|
— |
|
— |
|
— |
|
— |
| TOTAL |
$ |
3,818,485 |
$ |
— |
$ |
8,443,033 |
$ |
1,360,455 |
$ |
11,046,521 |
$ |
8,517,152 |
$ |
6,505,080 |
| (a) |
The values for Mr. Praw’s PSU award-related payouts reflect the same assumptions
as described in footnote (a) of Mr. Mezger’s table. |
| (b) |
Mr. Praw’s designated beneficiaries would be entitled to receive an estimated death
benefit of $2,012,072 ($1,000,000 benefit plus an income tax restoration payment of $1,012,072) upon his death. The present
value of the benefit as of November 30, 2023 is approximately $1,095,355 based on the factors described in footnote (b)
of Mr. Mezger’s table. For the change in control scenarios, the amounts shown are the cash surrender value of the underlying
life insurance policy as of November 30, 2023 of $644,176 and an estimated tax restoration payment of $716,278. |
| (c) |
Assumes we make 24 months of contributions for health benefits of approximately $2,545 per
month. |
Post-Employment Payments — Mr. Woram
Executive Payments
and Benefits
upon Termination
or Change in Control |
Voluntary
Termination |
Involuntary
Termination
for Cause |
Involuntary
Termination
Without Cause/
Termination for
Good Reason |
Change in
Control
Without
Termination |
Change in
Control With
Termination for
Good Reason or
Without Cause |
Death |
Disability |
| Severance |
$ |
— |
$ |
— |
$ |
4,323,428 |
$ |
— |
$ |
4,209,261 |
$ |
— |
$ |
— |
| Long-term Incentives(a) |
|
|
|
|
|
|
|
|
|
|
|
|
|
|
| Restricted Stock |
|
— |
|
— |
|
— |
|
— |
|
292,437 |
|
292,437 |
|
292,437 |
| PSUs |
|
3,606,357 |
|
— |
|
3,606,357 |
|
— |
|
4,945,837 |
|
6,147,142 |
|
6,147,142 |
| Health Benefits(b) |
|
— |
|
— |
|
61,074 |
|
— |
|
— |
|
— |
|
— |
| TOTAL |
$ |
3,606,357 |
$ |
— |
$ |
7,990,859 |
$ |
— |
$ |
9,447,535 |
$ |
6,439,579 |
$ |
6,439,579 |
| (a) |
The values for Mr. Woram’s PSU award-related payouts reflect the same assumptions
as described in footnote (a) of Mr. Mezger’s table. Mr. Woram's restricted stock awards would immediately vest
upon death, disability and as a result of a qualifying termination in connection with a change in control. |
| (b) |
Assumes we make 24 months of contributions for health benefits of approximately $2,545 per
month. |
| KB Home ■ 2024 Proxy Statement |
45 |
Advisory Vote to Approve Named Executive Officer Compensation
We believe that our CEO’s and our other NEOs’ 2023 fiscal year compensation
was well-aligned with our performance and stockholders’ interests, as detailed under “Compensation Discussion and
Analysis.” We also believe that the design and implementation of our executive compensation programs reflect our longstanding
significant outreach to our stockholders. In turn, our stockholders have generally expressed support through our annual NEO compensation
advisory votes. At the 2023 annual meeting, the advisory vote received approximately 80% support, an improvement from the prior
year.
As a result, and in accordance with regulations under Section 14A of the Exchange
Act, we are seeking an advisory vote from our stockholders to approve our NEOs’ 2023 fiscal year compensation as follows:
RESOLVED, that KB Home stockholders approve, on an advisory basis, the compensation
paid to its named executive officers, as disclosed in this Proxy Statement, including the Compensation Discussion and Analysis,
compensation tables and the related narrative discussion.
Responsiveness to Stockholders
The advisory vote result at our 2022 and 2023 annual meetings and the feedback we
received in those years through our stockholder engagement efforts shaped the following changes in our executive compensation
programs, which we believe have helped strengthen the connection between our performance and executive compensation, as described
below:
| ■ |
Developed with the Compensation Committee and Frederic W. Cook & Co., Inc.
a structured scorecard methodology to guide annual incentive payout determinations. |
| ■ |
Implemented a limit on the cash payouts for annual incentives to our NEOs. |
| ■ |
Further reduced the cash payout of the CEO’s annual incentive below the program limit
by allocating a higher portion of his total annual incentive to time-vesting equity in lieu of cash to, among other things,
additionally balance his cash and equity compensation and enhance alignment with stockholder value creation. |
| ■ |
Increased in 2022 the asset efficiency hurdle rate under the annual incentive program. |
Pay for Performance and 2023 Fiscal
Year CEO Compensation
We achieved strong homebuilding revenues, net income, and diluted earnings per share
results between 2018 and 2023 as shown in the charts below.
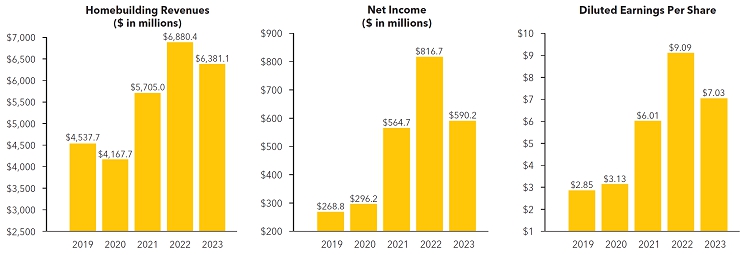
| KB Home ■ 2024 Proxy Statement |
46 |
| ■ |
Approximately 93% of our CEO’s 2023 total direct compensation was performance-based,
and his base salary has remained the same since 2017. |
| ■ |
The payouts under the 2023 annual incentive program were down year over year. While this reduction
was proportionately smaller than the year-over-year reduction in the applicable pretax income performance measure, the Compensation
Committee did not make any adjustments to the formula-driven annual incentive payouts, taking into consideration, among other
things, the program participants’ strong individual performance in a challenging operating environment and our one-year
total stockholder return of 68%, which was above our peer group median. |
| ■ |
To better align cash and equity incentives and enhance retention and stockholder value creation,
a portion of our CEO’s annual incentive was paid out in time-vesting restricted stock in lieu of cash. The $7,280,000
cash payout was less than the prior year, and the $1,678,644 restricted stock portion, which was also less than the prior
year, vests over three years. |
| ■ |
Our CEO’s October 2023 long-term incentive award was solely PSUs, with the 2023 target
award grant value up approximately 10% from the value granted in each of the previous four years, an increase based on peer
group and market data analysis. |
| ■ |
Our CEO earned his three-year 2020 PSU award at 200% of target (as discussed under “2020
PSU Awards”), reflecting our strong performance on the three applicable measures over the three-year performance period
that ran from December 1, 2021 to November 30, 2023. |
| ■ |
Taken together, the above actions resulted in overall CEO reported compensation that is lower
year over year. |
Reflecting the nearly 94% support stockholders expressed at our 2023 Annual Meeting
for an annual frequency, we intend to offer this non-binding Say-on-Pay vote at each of our annual meetings. We and the Board
welcome our stockholders’ views on our NEOs’ compensation and, as in past years, will carefully consider the outcome
of this advisory vote consistent with the best interests of all stockholders. As an advisory vote, it is not intended to have
any use or effect for or on behalf of KB Home or its stockholders outside this Annual Meeting except as permitted by the
Board.
Voting Standard
This non-binding advisory resolution will be considered approved based upon the
affirmative vote of a majority of the shares of our common stock present or represented, and entitled to vote thereon, at the
Annual Meeting.
FOR
|
Board recommendation: FOR approval of NEO compensation
|
| KB Home ■ 2024 Proxy Statement |
47 |
Ratify Ernst & Young LLP’s Appointment as Independent Auditor
In January 2024, the Audit Committee appointed Ernst & Young LLP as our independent
registered public accounting firm to audit our consolidated financial statements for our fiscal year ending November 30, 2024.
This appointment was based on Ernst & Young LLP’s effective performance in 2023 and audit efficiencies from its
33 years of service as our Independent Auditor, as well as the results of the Audit Committee’s five-year in-depth review
conducted in July 2023, which is further described in its report on the next page. The Audit Committee believes this appointment
is in our and our stockholders’ best interests. We are seeking stockholder ratification of this appointment.
Voting Standard
The Audit Committee’s appointment of Ernst & Young LLP will be considered
ratified based upon the affirmative vote of a majority of the shares of our common stock present or represented, and entitled
to vote thereon, at the Annual Meeting.
FOR
|
Board recommendation: FOR ratifying Ernst & Young LLP’s appointment
|
Representatives of Ernst & Young LLP are expected to be present at the
Annual Meeting, be available to respond to appropriate questions and, if they desire, make a statement. If Ernst & Young
LLP’s appointment is not ratified, the Audit Committee will consider whether to retain Ernst & Young LLP, but still
may retain the firm. Even if the appointment is ratified, the Audit Committee, in its discretion, may change the appointment of
our independent registered public accounting firm at any time during the year if it determines it would be in our and our stockholders’
best interests to do so.
Independent Auditor Services and Fees
Below are the services provided by Ernst & Young LLP and related fees in
each of our last two fiscal years. In 2023 and 2022, Ernst & Young LLP’s audit fees included an annual consolidated
financial statement audit, audits of our financial services subsidiary, procedures related to our continuing implementation of
a new enterprise resource planning system, other information technology systems testing, consents relating to financing transactions
in 2022, and an audit of our internal control over financial reporting. Audit-related fees in both years included 401(k) Plan
audits and access to certain accounting resources.
| |
Fiscal Year Ended ($000s) |
| |
2023 |
|
2022 |
| Audit Fees |
$ |
1,453 |
$ |
1,525 |
| Audit-Related Fees |
|
54 |
|
51 |
| Tax Fees |
|
— |
|
— |
| All Other Fees |
|
— |
|
— |
| TOTAL FEES |
$ |
1,507 |
$ |
1,576 |
| KB Home ■ 2024 Proxy Statement |
48 |
Audit Committee Report
The Audit Committee acts under a written charter to assist the Board in overseeing,
among other things, KB Home’s corporate accounting and reporting practices. All Audit Committee members are independent,
and four members are considered SEC “audit committee financial experts.” In its role, the Audit Committee, among
other activities:
| ■ |
conducts at most meetings separate executive sessions with KB Home’s
chief financial officer; chief accounting officer; chief legal officer; internal audit head; and Independent Auditor, Ernst &
Young LLP, to discuss matters relevant to their respective duties and roles. |
| ■ |
oversees management’s performance of an annual enterprise risk management assessment
and discusses with management identified significant business and operations risks, along with corresponding mitigating factors. |
| ■ |
periodically reviews with management KB Home’s cybersecurity tools and resources, threat
environment, incident reporting procedures, and future plans, with the most recent review conducted in January 2024. |
| ■ |
annually reviews and approves the internal audit department’s audit plan, which is based
on the top risks identified in the annual enterprise risk management assessment, and receives at least quarterly plan status
updates. |
| ■ |
reviews and discusses with management quarterly and annual periodic reports before they are
filed with the SEC. |
| ■ |
receives and discusses quarterly management reports on the structure and testing of KB Home’s
system of internal control over financial reporting, and management’s assessment of the system’s effectiveness. |
| ■ |
receives and discusses reports from the chief legal officer and senior compliance executives
on material legal, compliance and ethics matters, and the Independent Auditor on its audit and internal control evaluation
activities. |
Management is responsible for KB Home’s financial statements, financial
reporting process and the adequacy of internal control over financial reporting. The Independent Auditor is responsible for performing
an independent audit of such financial statements and internal control over financial reporting, and expressing an opinion thereon.
The Audit Committee is responsible for the appointment (with consideration given
to stockholder ratification), compensation, engagement terms (including fees), retention (or termination) and oversight of the
Independent Auditor’s work. As to the Independent Auditor, the Audit Committee also:
| ■ |
annually evaluates the Independent Auditor’s qualifications, independence
and effectiveness and conducts an in-depth review every five years, or more frequently as conditions warrant, to determine
whether to retain the Independent Auditor or undertake a request-for-proposal process with other accounting firms. Based on
an in-depth review conducted in July 2023 (the immediately prior such review occurred in 2018), and a confirmatory evaluation
in January 2024 at the firm’s completion of its 2023 fiscal year financial audit, the Audit Committee appointed Ernst
& Young LLP as KB Home’s independent registered public accounting firm for the fiscal year ending November
30, 2024. |
| |
■ |
In the July 2023 review, and in the January 2024 confirmatory evaluation, the Audit Committee,
as well as management, favorably considered Ernst & Young LLP’s experience and homebuilding industry expertise;
technical competence, internal human and technology resources and capabilities; quality, timeliness and candor of communications;
cost competitiveness; independence and integrity; objectivity and professional skepticism, as well as the firm’s tenure
and associated audit efficiencies. The Audit Committee presented the results of the July 2023 review and January 2024
confirmatory evaluation to the Board. |
| ■ |
reviews and discusses with the Independent Auditor the scope and plan of its financial statement
and internal control over financial reporting audits; the critical accounting policies and practices in the firm’s audits;
and any critical audit matter that is identified in KB Home’s Annual Reports on Form 10-K. |
In this context, the Audit Committee reviewed and discussed KB Home’s
audited financial statements with management and Ernst & Young LLP. It also discussed with Ernst & Young LLP
the matters the Public Company Accounting Oversight Board and the SEC require, including the required disclosures and letter
from the firm concerning its independence, and discussed the firm’s independence from KB Home and KB Home’s
management.
In reliance on the reviews, reports, activities and discussions referred to above,
the Audit Committee recommended to the Board, and the Board approved, the inclusion of KB Home’s audited financial statements
in KB Home’s Annual Report on Form 10-K for the fiscal year ended November 30, 2023 for filing with the SEC.
The Audit Committee respectfully submits this report.
Dr. Thomas W. Gilligan, Chair
Jose M. Barra
Dorene C. Dominguez
Kevin P. Eltife
Dr. Stuart A. Gabriel
| KB Home ■ 2024 Proxy Statement |
49 |
Annual Meeting Voting Matters and Other Information
Holders of record of the 75,643,726 shares of our common stock outstanding as of
the close of business on the February 26, 2024 record date are entitled to one vote for each share held. The trustee will vote
the 6,705,247 shares the GSOT held on the record date based on instructions from eligible employees who hold common stock options
under our equity compensation plans, as discussed under “Ownership of KB Home Securities.” Therefore, a total
of 82,348,973 shares are entitled to vote at the Annual Meeting.
For stockholders to take action at the Annual Meeting, the holders of a majority
of the shares of our common stock outstanding on the record date must be present or represented at the meeting. Abstentions and
“broker non-votes” are counted for this purpose. A “broker non-vote” occurs when a broker or financial
institution does not receive instructions from a beneficial holder and does not have the discretionary authority to vote on an
item of business, which will apply for all Annual Meeting matters other than ratifying our Independent Auditor’s appointment.
Therefore, if you are a beneficial owner, you must instruct your broker or financial institution on how you want your shares to
be voted on the other items of business in order for your shares to be counted for those items.
Voting Your Shares
Stockholders can vote via the Internet, telephone or mail or in person at the Annual
Meeting, as described under “Voting Procedures.” There are no dissenters’ rights or rights of appraisal as to
any item to be acted upon at the Annual Meeting. There is no right to cumulative voting.
The Annual Meeting named proxies — Jeffrey T. Mezger and Brian J. Woram,
our Executive Vice President and General Counsel (or their duly authorized designees) — will follow submitted proxy voting
instructions. They will vote as the Board recommends for any submitted instructions that do not direct how to vote on an item
and on any other matters properly presented at the Annual Meeting in their discretion, including a motion to adjourn or postpone
all or a portion of the Annual Meeting. We have engaged our transfer agent, Computershare, to count votes and act as an independent
inspector of election. William A. (Tony) Richelieu, our Corporate Secretary, will also act as an inspector of election.
Voting Standards
You will find the voting standard for each item of business at the Annual Meeting
on the first page on which it is discussed in this Proxy Statement. Approval of any other matter properly presented at the Annual
Meeting requires the affirmative vote of a majority of the shares of our common stock present or represented and entitled to vote
thereon. Shares that are not present or represented at the Annual Meeting and broker non-votes will not affect the outcome for
any items of business at the Annual Meeting. Abstentions will not affect the outcome of the election of directors but will have
the effect of an against vote for any other items of business.
Voting Procedures
| |
|
Holders of Record |
|
Beneficial Holders |
|
Plan Participant Holders |
| How to Vote |
|
If your shares are registered directly with our transfer agent, Computershare, vote via the
Internet, telephone or mail following the instructions on your mailed or electronic proxy form. |
|
If your shares are held by an intermediary broker or financial institution, vote via the Internet,
telephone or mail following the instructions on your mailed or electronic voting instruction form. |
|
If you can vote any shares under the 401(k) Plan or the GSOT, vote via the Internet, telephone
or mail following the instructions on your mailed or electronic proxy form. |
| Voting Deadlines |
|
Internet and telephone voting is available until 11:59 p.m., Eastern Time, on April 17, 2024.
Mailed proxy forms must be received before polls close. |
|
Your broker/other holder of record sets the voting deadlines. |
|
Internet and telephone voting is available until, and mailed proxy forms must be received
by, 11:59 p.m., Eastern Time, on April 16, 2024. |
| Changing Your Vote |
|
You may revoke voting instructions by submitting a later vote in person before polls close,
or via the Internet, telephone or mail before the above-noted deadlines. |
|
You must contact your broker/ other holder of record to revoke any prior voting instructions. |
|
You may revoke voting instructions by submitting a later vote in person before polls close,
or via the Internet, telephone or mail before the above-noted deadline. |
| KB Home ■ 2024 Proxy Statement |
50 |
Proxy Solicitation Costs
We will pay the cost to solicit proxies for the Annual Meeting. In addition to this
Proxy Statement, our officers, directors and other employees may solicit proxies personally, in writing or by telephone, facsimile,
email or other means for no additional compensation. We will, if requested, reimburse banks, brokers and other custodians, nominees
and certain fiduciaries for their reasonable expenses in providing proxy materials to their principals. We have hired Georgeson
LLC, a professional soliciting organization, to assist us in soliciting proxies and distributing proxy materials for a fee of
$10,500, plus reimbursement of out-of-pocket expenses.
Internet Availability of Proxy Materials
The Annual Meeting proxy materials are being made available primarily via the Internet
at www.kbhome.com/investor/proxy in order to speed their delivery to our stockholders, to contain costs and to reduce
the impact on the environment. In addition, beginning March 8, 2024, we mailed the Notice of Internet Availability to stockholders,
which provides instructions on how to access and view the proxy materials, and to vote via the Internet or telephone. To request
a printed copy of our proxy materials, follow the instructions on the notice. Stockholders who previously elected to receive proxy
materials electronically will continue to receive them and a notice by e-mail, unless we are told otherwise. Please note that
you cannot vote your shares by marking and returning a notice.
Stockholder Proposals for Our 2025 Annual Meeting of Stockholders
To be included in the proxy statement and form of proxy for our 2025 annual meeting,
we must receive any proposal of a stockholder intended to be presented at that meeting no later than November 8, 2024. Any such
proposal must comply with the requirements of Rule 14a-8 under the Exchange Act. In addition, per our By-Laws, a stockholder who
wishes to nominate a director candidate or bring any other business for consideration at the 2025 annual meeting must provide
notice to us no earlier than December 19, 2024 and no later than January 18, 2025. In addition to complying with the terms of
the By-Laws and applicable law, stockholders who intend to solicit proxies in support of director nominees other than the company’s
nominees must also comply with the additional requirements of Rule 14a-19(b) under the Exchange Act.
Governance
Documents and Public Filings Availability
Our Certificate of Incorporation,
By-Laws, Corporate Governance Principles, Board-approved charters for each standing committee and Ethics Policy serve
as the foundation of our corporate governance. Each document may be viewed, printed or downloaded at https://investor.kbhome.com/environmental-social-and-governance-esg/governance/default.asp.
These documents are also available in print at no charge upon request. The information on our website, including
the investor relations section and our annual sustainability reports, is not incorporated by reference into and does not
form a part of this Proxy Statement.
Our SEC filings are available on our website at https://investor.kbhome.com/financial-information/sec-filings/.
|
Communicating with the Board
Any interested party may write to the Board, the Chairman of the Board,
the Lead Independent Director or any other director in care of our Corporate Secretary at KB Home, 10990 Wilshire Boulevard,
7th Floor, Los Angeles, CA 90024.
|
| KB Home ■ 2024 Proxy Statement |
51 |
Commitment to Sustainability
Since 2007, we have been a sustainability leader in the homebuilding industry. As
a natural extension of our highly customer-centric operating philosophy, our sustainability efforts are focused on benefiting
our customers, primarily through helping them lower their long-term costs of homeownership. In doing so, we believe these efforts
also distinguish us in important ways from other new home builders and from resale homes, and enable us to contribute positively
to the environment and communities in our served markets.
Our Annual Report, and our annual sustainability reports and investor relations
website, which are not incorporated in this Proxy Statement or any other SEC filing we make, provide more details on our sustainability
programs and objectives. These include our commitment to building energy-efficient homes, and our making available to our buyers
renewable solar energy systems, high water efficiency and indoor air environments that support personal wellness. They also
include information on our human capital priorities to develop and support a diverse and inclusive workforce, and our broader
social contributions. Our most recent sustainability report, published in May 2023, provides more information, including
data presented in line with voluntary reporting frameworks. We plan to publish our next sustainability report - our 17th
consecutive and longest-running publication of its kind in the homebuilding industry - on Earth Day, April 22, 2024.
Sustainability Governance
Our Board oversees our sustainability efforts as part of our overall business strategy.
The Board’s Audit and Compliance Committee assesses environmental sustainability, and its Management Development
and Compensation Committee evaluates workforce matters. Two directors, Mr. Collins and Ms. Dominguez are the
Board’s liaisons to management on sustainability-related matters. For the past 16 years, our National Advisory Board, a
panel of external advisors, has helped shape our sustainability priorities and reporting, as well as our stakeholder engagement
approach. Internally, our sustainability initiatives and external stakeholder interactions are directed primarily through two
cross-functional teams, one led by our COO and the other by our Senior Vice President, Investor Relations.
Sustainability Focus Areas
In our business, we acquire land, develop communities on the land and sell homes
in the communities. We engage independent contractors to perform land development and home construction work. We do not operate
manufacturing facilities or a vehicle fleet, or package our products. Various local utilities, and their power sources, supply
the energy used in community development. Once all homes in a community are delivered, development work ceases and residents use
their homes, typically over decades.
Within the foregoing operational context, and as a home’s energy consumption
mostly occurs after it is delivered to a customer, we have focused on maximizing our homes’ energy efficiency to the extent
possible using advanced, cost-effective products and technology. This direction aligns with our core first-time homebuyers’
long-term affordability needs through potentially lower utility bills. It also helps to minimize our homes’ impact on the
environment.
We assess our progress in this area using the RESNET
Home Energy Rating System (HERS®) Index, as each HERS Index score point reduction equates to a 1% improvement in energy
efficiency relative to a standard new home. We have a target to lower our national average HERS Index score by five points, from 50 for
2020 to 45 for 2025. For comparison, a typical resale home today has a HERS Index score of 130. For 2023, our national average
HERS Index score was 46, improving from 48 for 2022. As each HERS Index score point reduction also potentially creates less greenhouse
gas emissions by an average of 0.1 metric tons (as calculated based on the states in which we operate), if we achieve our HERS Index
score goal by the end of 2025, our homes built in that year would, on average, produce 0.5 metric tons less in such emissions per year
than our average home built in 2020, an 8% reduction.
Our homes also include several water-saving features
to help mitigate strain on water resources. To advance this priority, every home built in our new communities in Arizona, California
and Nevada since July 2022 has been RESNET HERS H2O® rated to ensure they meet the U.S. Environmental Protection Agency’s
WaterSense labeled home requirements, helping homeowners use less water and lower their utility bills in these severely drought-affected
areas.
| KB Home ■ 2024 Proxy Statement |
52 |
ANNEX 1
Corporate Governance Processes and Procedures
This Annex provides additional information
about KB Home’s corporate governance.
Director Independence Determinations
We believe that a substantial majority of
our directors should be independent. To be independent, the Board must affirmatively determine that a director does not have any
direct or indirect material commercial or charitable relationship with us based on all relevant facts and circumstances. The Board
makes independence determinations from information supplied by directors, director nominees and other sources, the Nominating Committee’s
prior review and recommendation, and certain categorical standards contained in our Corporate Governance Principles that are consistent
with NYSE listing standards. The Board determined that all directors who served in 2023 and all director nominees are independent,
other than Mr. Mezger.
In making its independence determinations,
the Board found that the following directors’ independence was not impaired by, and each did not have a direct or indirect
material interest in, the following: Mr. Barra with respect to purchases we made in our 2023 fiscal year at standard prices at
Home Depot retail stores of certain appliances, equipment, supplies and other items for use in our business, totaling less than
$1.0 million; Ms. Dominguez with respect to our corporate office lease with a subsidiary of Douglas Emmett, Inc., where
she serves as a non-employee director, or by our making a $25,000 donation to The Dominguez Dream, a nonprofit organization for
which Ms. Dominguez serves as Chairwoman; and Mr. Weaver with respect to certain of our divisions’ payments to
Cox Communications, a division of Cox Enterprises, Inc., where he serves as a non-employee director, for standard Internet and
telephone service where Cox is the provider in the relevant local area, or our receiving certain marketing-related payments from
Cox.
The Board also determined that each Compensation
Committee member is a “non-employee director” under SEC rules and an “outside director” under Section 162(m)
of the Code.
Related Party Transactions
The Nominating Committee reviews any transactions,
arrangements or relationships in which we participate and in which a director, director nominee, executive officer or beneficial
owner of five percent or more of our common stock (or, in each case, an immediate family member) had or will have a direct or indirect
material interest (a “Related Party Transaction”). Covered individuals and stockholders are expected to inform
our Corporate Secretary of any Related Party Transactions, and we collect information from our directors, director nominees and
executive officers so that we can review our records for any such transactions. During 2023, there were no such Related Party
Transactions.
Per the policies and procedures set forth
in its Charter, the Nominating Committee will approve a Related Party Transaction if, based on a review of all material facts and
feasible alternatives, it deems the transaction to be in our and our stockholders’ best interests. In addition, specified
categories of transactions set forth in the Nominating Committee’s Charter are deemed pre-approved, including those in which
the total amount involved is less than or equal to $120,000; and those that would not (a) need to be reported under federal
securities laws, (b) be deemed to impair a director’s independence or (c) be deemed to be a conflict of interest.
Director Qualifications and Nominations
The Nominating Committee evaluates and recommends
individuals for election to the Board at its meetings and at any point during the year. Current directors may nominate individuals,
and the Nominating Committee has retained professional search firms from time to time to assist with director recruitment. Among
other factors, the Nominating Committee takes into consideration the attributes listed in our Corporate Governance Principles and
diversity as described under “Board Experience and Skills.” There is no formal policy as to how diversity is applied,
and an individual’s background and experience, while important, do not necessarily outweigh any other factors.
Security holders may propose director nominees
by following the procedures in our By-Laws, which require, among other things, timely advance written notice to our Corporate Secretary
of any potential nominee that contains specified information about the nominee and the nominating security holder. Director nominees
proposed by security holders in accordance with the procedures in our By-Laws are considered in the same manner as any other potential
nominees.
| KB Home ■ 2024 Proxy Statement |
53 |
Board Evaluation Process
In October 2023, the Board and each committee
conducted an annual evaluation of their respective performance as part of their regular fourth quarter meetings. Their discussions
were guided by a set of subjects the Nominating Committee approved in July 2023. The subjects included, among others: Board/committee
structure, composition, diversity, skills, meeting processes, interaction with management, and the performance of the Board Chairman/committee
chair and the Lead Independent Director. Each committee reported on the results of its own assessment to the Board.
Audit Fee Pre-Approval Policy; Audit Committee Designation
The Audit Committee has established a policy
that requires it to pre-approve all services our Independent Auditor provides to us, including audit, audit-related, tax and other
permitted non-audit services. In certain circumstances under the policy, our chief accounting officer (or a functional equivalent)
can authorize the firm to perform services, and the Audit Committee Chair can pre-approve services up to a specific per-engagement
fee limit. The Audit Committee Chair must report to the Audit Committee any such pre-approvals granted.
The Audit Committee approved all services
Ernst & Young LLP provided in 2023 and 2022 and the corresponding fees (as shown in the table under “Independent
Auditor Services and Fees”) in accordance with this policy.
The Audit Committee is a separately designated
standing audit committee as defined in Section 3(a)(58)(A) of the Exchange Act.
| KB Home ■ 2024 Proxy Statement |
54 |
ANNEX 2
Reconciliation of Non-GAAP Financial Measures
This Proxy Statement contains information
regarding Adjusted Pretax Income, Adjusted Net Income and Adjusted Earnings Per Share, all of which are financial measures that
are not calculated in accordance with GAAP. We believe these non-GAAP financial measures are relevant and useful for purposes of
this Proxy Statement to understand our 2023 fiscal year performance generally and in relation to the annual incentive payouts the
Compensation Committee approved for our NEOs, as described under “2023 Annual Incentives,” and how the 2020 PSU performance
measures of AEPS and AROIC were determined, as described under “Long-Term Incentives.” However, because Adjusted Pretax
Income, Adjusted Net Income and Adjusted Earnings Per Share are not calculated in accordance with GAAP, these financial measures
may not be completely comparable to other companies in the homebuilding industry and, thus, should not be considered in isolation
or as an alternative to measures prescribed by GAAP. Also, we do not necessarily use these specific financial measures to make
business decisions or in other investor communications about our results of operations. Rather, these financial measures should
be used to supplement the most directly comparable GAAP financial measures in order to provide a greater understanding of our performance
solely with respect to the 2023 fiscal year annual incentives and 2020 PSU payouts to our NEOs.
The table below reconciles our total pretax
income calculated in accordance with GAAP to the non-GAAP measure of Adjusted Pretax Income used in the computation of the 2023
fiscal year annual incentives (in thousands):
| | |
For the Fiscal Year Ended
November 30, 2023 |
| Total pretax income | |
$ | 771,277 |
| Add: Incentive and variable compensation expense | |
| 75,850 |
| Add: Inventory-related charges related to land purchased or optioned prior to January 1, 2008 | |
| 11,424 |
| ADJUSTED PRETAX INCOME | |
$ | 858,551 |
Adjusted Pretax Income is a non-GAAP financial
measure, which is calculated as our total pretax income excluding incentive and variable compensation expense and inventory-related
charges related to land purchased or optioned prior to January 1, 2008. For Adjusted Pretax Income, the most directly comparable
GAAP financial measure is pretax income.
The tables below reconcile our net income
and diluted earnings per share calculated in accordance with GAAP to the non-GAAP measures of Adjusted Net Income and Adjusted
Earnings Per Share used in the computation of the AEPS and AROIC performance measures for the 2020 PSU payouts to our NEOs ($ in
thousands, except per share amounts):
| | |
For the Fiscal Years Ended November 30, |
| | |
2023 | | |
2022 | | |
2021 |
| Total pretax income | |
$ | 771,277 | | |
$ | 1,072,066 | | |
$ | 695,346 |
| Income tax expense | |
| (181,100) | | |
| (255,400) | | |
| (130,600) |
| NET INCOME | |
$ | 590,177 | | |
$ | 816,666 | | |
$ | 564,746 |
| DILUTED EARNINGS PER SHARE | |
$ | 7.03 | | |
$ | 9.09 | | |
$ | 6.01 |
| KB Home ■ 2024 Proxy Statement |
55 |
| | |
For the Fiscal Years Ended November 30, |
| | |
2023 | | |
2022 | | |
2021 |
| Net income | |
$ | 590,177 | | |
$ | 816,666 | | |
$ | 564,746 |
Adjustments:
Inventory-related charges related to land purchased or optioned prior to January 1, 2008 | |
| 11,424 | | |
| 25,542 | | |
| 11,953 |
| Variable compensation expense | |
| — | | |
| — | | |
| — |
| Income tax impact* | |
| (2,700) | | |
| (6,100) | | |
| (2,200) |
| ADJUSTED NET INCOME | |
$ | 598,901 | | |
$ | 836,108 | | |
$ | 574,499 |
| ADJUSTED EARNINGS PER SHARE (AEPS) | |
$ | 7.18 | | |
$ | 9.36 | | |
$ | 6.14 |
| * |
Represents the total adjustments to net income multiplied
by our effective tax rate, which was 23.5% for 2023, 23.8% for 2022 and 18.8% for 2021. |
| | |
For the Fiscal Years Ended November 30, |
| | |
2023 | | |
2022 | | |
2021 |
| ADJUSTED NET INCOME | |
$ | 598,901 | | |
$ | 836,108 | | |
$ | 574,499 |
| Average notes payable | |
$ | 1,764,205 | | |
$ | 1,761,769 | | |
$ | 1,716,101 |
| Average stockholders’ equity | |
| 3,735,468 | | |
| 3,340,135 | | |
| 2,842,622 |
| AVERAGE INVESTED CAPITAL | |
$ | 5,499,673 | | |
$ | 5,101,904 | | |
$ | 4,558,723 |
| ADJUSTED RETURN ON INVESTED CAPITAL (AROIC) | |
| 10.9% | | |
| 16.4% | | |
| 12.6% |
Adjusted Net Income is a non-GAAP financial
measure, which is calculated as our net income excluding inventory-related charges related to land purchased or optioned prior
to January 1, 2008, variable compensation expense, and the applicable income tax impact of these items for the period. AEPS is
calculated based on Adjusted Net Income. AROIC is calculated as Adjusted Net Income divided by average invested capital (average
notes payable and stockholders’ equity for the beginning and end of the applicable year). For Adjusted Net Income and AEPS,
the most directly comparable GAAP financial measures are net income and diluted earnings per share, respectively.
| KB Home ■ 2024 Proxy Statement |
56 |
FORWARD-LOOKING STATEMENTS
Certain statements contained in this Proxy
Statement and accompanying materials, are “forward-looking statements” within the meaning of the Private Securities
Litigation Reform Act of 1995 (“Act”). Statements that are predictive in nature, that depend upon or refer to
future events or conditions, or that include words such as “expect,” “anticipate,” “intend,”
“plan,” “believe,” “estimate,” “hope,” and similar expressions constitute forward-looking
statements. In addition, any statements concerning our future financial or operating performance (including without limitation
future revenues, community count, homes delivered, net orders, selling prices, sales pace per new community, expenses, expense
ratios, housing gross profits, housing gross profit margins, earnings or earnings per share, book value per share, or growth or
growth rates); future market conditions; future mortgage or other interest rates and other economic conditions; our ongoing business
strategies or prospects, including those relating to our sustainability-related programs and goals or targets; our executive compensation
program; future dividends and changes in dividend levels; our cash generation and liquidity; the value of our backlog (including
amounts that we expect to realize upon delivery of homes included in our backlog and the timing of those deliveries); the value
of our net orders; future share issuances or repurchases; whether and to what extent we return capital to stockholders, if at all;
future debt issuances, repurchases or redemptions; and other possible future actions in these or other areas of our business are
also forward-looking statements under the Act. Forward-looking statements are based on our expectations and projections about future
events at the time made and are subject to risks, uncertainties, and assumptions about our operations, economic and market factors,
and the homebuilding industry, among other things, including events outside our control. These statements are not guarantees of
future performance or outcomes, and we have no specific policy or intention to update these statements. If we update or revise
any such statement(s), no assumption should be made that we will further update or review that statement(s) or update or revise
any other such statement(s). In addition, forward-looking and other statements in this Proxy Statement and accompanying materials
may be based in whole or in part on general observations of our management, limited or anecdotal evidence and/or business or industry
experience without in-depth or any particular empirical investigation, inquiry or analysis. Actual events and results may
differ materially from those expressed, forecasted or implied in forward-looking statements due to a number of factors, including,
without limitation, economic and business conditions; our ability to successfully implement our current and planned strategies
and initiatives related to our product, geographic and market positioning; and if we can successfully implement our business and
capital allocation strategies and achieve any associated financial and operational objectives. Please see our periodic reports
and other filings with the Securities and Exchange Commission for a further discussion of the risks, uncertainties and other factors
applicable to our business.

v3.24.0.1
| X |
- DefinitionBoolean flag that is true when the XBRL content amends previously-filed or accepted submission.
| Name: |
dei_AmendmentFlag |
| Namespace Prefix: |
dei_ |
| Data Type: |
xbrli:booleanItemType |
| Balance Type: |
na |
| Period Type: |
duration |
|
| X |
- DefinitionThe type of document being provided (such as 10-K, 10-Q, 485BPOS, etc). The document type is limited to the same value as the supporting SEC submission type, or the word 'Other'.
| Name: |
dei_DocumentType |
| Namespace Prefix: |
dei_ |
| Data Type: |
dei:submissionTypeItemType |
| Balance Type: |
na |
| Period Type: |
duration |
|
| X |
- DefinitionA unique 10-digit SEC-issued value to identify entities that have filed disclosures with the SEC. It is commonly abbreviated as CIK. Reference 1: http://www.xbrl.org/2003/role/presentationRef
-Publisher SEC
-Name Exchange Act
-Number 240
-Section 12
-Subsection b-2
| Name: |
dei_EntityCentralIndexKey |
| Namespace Prefix: |
dei_ |
| Data Type: |
dei:centralIndexKeyItemType |
| Balance Type: |
na |
| Period Type: |
duration |
|
| X |
- DefinitionThe exact name of the entity filing the report as specified in its charter, which is required by forms filed with the SEC. Reference 1: http://www.xbrl.org/2003/role/presentationRef
-Publisher SEC
-Name Exchange Act
-Number 240
-Section 12
-Subsection b-2
| Name: |
dei_EntityRegistrantName |
| Namespace Prefix: |
dei_ |
| Data Type: |
xbrli:normalizedStringItemType |
| Balance Type: |
na |
| Period Type: |
duration |
|
v3.24.0.1
Pay vs Performance Disclosure
|
12 Months Ended |
|
Nov. 30, 2023
USD ($)
$ / shares
|
Nov. 30, 2022
USD ($)
$ / shares
|
Nov. 30, 2021
USD ($)
$ / shares
|
| Pay vs Performance Disclosure [Table] |
|
|
|
|
| Pay vs Performance [Table Text Block] |
|
Pay Versus Performance
The following table presents information as
required under Item 402(v) of SEC Regulation S-K regarding the relationship for the three most recently completed fiscal years
between the compensation of our NEOs – as reported in the Summary Compensation Table and adjusted to reflect “compensation
actually paid” (“CAP”) as defined under SEC rules – and our performance relative to the identified metrics.
Our compensation philosophy and how we align executive compensation with our performance is described under “Compensation
Discussion and Analysis.” The CAP amounts disclosed do not reflect the actual amount of compensation earned, realized,
or received by our NEOs during the applicable fiscal year. The Compensation Committee did not consider the information provided
in this section in making its compensation decisions for the years shown.
Fiscal
Year |
Summary
Compensation
Table Total for
PEO
($) |
Compensation
Actually Paid to
PEO
($)(a) |
Average
Summary
Compensation
Table Total for
Other NEOs
($)(b) |
Average
Compensation
Actually Paid to
Other NEOs
($)(a)(b) |
|
Value of Initial Fixed $100
Investment Based on: |
|
Net Income
($000s)(e) |
AEPS
($)(f) |
Total
Shareholder
Return
($)(c) |
Peer Group
Total
Shareholder
Return
($)(d) |
| 2023 |
$ |
15,689,055 |
$ |
43,713,700 |
$ |
4,483,491 |
$ |
10,469,248 |
|
$ |
155.12 |
$ |
176.92 |
|
$ |
590,177 |
$ |
7.18 |
| 2022 |
|
15,814,791 |
|
12,168,706 |
|
4,416,324 |
|
4,273,279 |
|
|
92.08 |
|
112.90 |
|
|
816,666 |
|
9.36 |
| 2021 |
|
14,366,518 |
|
25,125,414 |
|
4,556,264 |
|
7,144,468 |
|
|
115.18 |
|
133.37 |
|
|
564,746 |
|
6.14 |
| (a) |
To calculate CAP per SEC rules, adjustments were made to the amounts reported in the Summary Compensation Table for the
applicable fiscal year. A reconciliation of the adjustments for the PEO and for the average of the other NEOs is set forth
below. |
| (b) |
Mr. Mezger served as our PEO for each fiscal year shown. Our other NEOs were as follows: Messrs. Kaminski, McGibney,
Praw and Woram for the 2023 and 2022 fiscal years; and Messrs. Kaminski, McGibney and Praw, and Matthew W. Mandino for the
2021 fiscal year. |
| (c) |
The amounts reported reflect the cumulative total shareholder return (“TSR”) on our common stock for each
of the last three fiscal years ended November 30, 2023, assuming an investment of $100 on November 30, 2020, and the
reinvestment of dividends. |
| (d) |
The peer group used in this disclosure is the Dow Jones US Home Construction Index, which is the same index we used in
the Stock Performance Graph in our Annual Report. The amounts reported reflect the cumulative TSR of the Dow Jones US Home
Construction Index for each of the last three fiscal years ended November 30, 2023, assuming an investment of $100 on November
30, 2020, and the reinvestment of dividends. |
| (e) |
Represents net income reported in our audited consolidated financial statements for each of the applicable fiscal years. |
| (f) |
Annex 2 to this Proxy Statement contains a reconciliation of our diluted earnings per share calculated in accordance with
GAAP to the non-GAAP financial measure of AEPS. We included AEPS as our company-selected financial measure as this metric
has the largest weighting in determining our NEO’s long-term incentive compensation, a significant component of their
overall compensation. |
| |
|
2023 |
|
2022 |
|
2021 |
| PEO |
Average
Other NEOs |
PEO |
Average
Other NEOs |
PEO |
Average
Other NEOs |
| Summary Compensation Table Total |
|
$ |
15,689,055 |
$ |
4,483,491 |
|
$ |
15,814,791 |
$ |
4,416,324 |
|
$ |
14,366,518 |
$ |
4,556,264 |
| Adjustments: |
|
|
|
|
|
|
|
|
|
|
|
|
|
|
|
| Grant date fair value of stock awards from Summary Compensation Table |
|
|
(7,178,664) |
|
(1,407,844) |
|
|
(7,105,882) |
|
(1,336,330) |
|
|
(4,999,996) |
|
(1,575,004) |
| Fair value of equity awards granted in the year and unvested as of year end(1) |
|
|
14,848,740 |
|
3,050,249 |
|
|
9,171,068 |
|
2,361,535 |
|
|
8,901,354 |
|
2,803,936 |
| Increase (decrease) in fair value from prior year end of outstanding and unvested awards granted
in prior years(2) |
|
|
18,435,361 |
|
4,092,993 |
|
|
(5,939,248) |
|
(1,127,786) |
|
|
5,205,965 |
|
1,168,011 |
| Increase (decrease) in fair value from prior year end of vested awards granted in prior years(3) |
|
|
1,035,950 |
|
169,437 |
|
|
(569,805) |
|
(112,753) |
|
|
1,201,244 |
|
163,721 |
| Dividends paid on awards during the year before vesting |
|
|
548,099 |
|
80,922 |
|
|
408,026 |
|
72,289 |
|
|
202,027 |
|
27,540 |
| “Change in pension value and nonqualified deferred compensation earnings” from Summary Compensation
Table |
|
|
- |
|
- |
|
|
- |
|
- |
|
|
(142,560) |
|
- |
| Service cost for pension plans |
|
|
335,159 |
|
- |
|
|
389,756 |
|
- |
|
|
390,862 |
|
- |
| CAP (as calculated per SEC rules) |
|
$ |
43,713,700 |
$ |
10,469,248 |
|
$ |
12,168,706 |
$ |
4,273,279 |
|
$ |
25,125,414 |
$ |
7,144,468 |
| |
(1) |
Represents the aggregate fair value as of the indicated fiscal year-end of outstanding and unvested stock awards granted
during such fiscal year, calculated using the same methodology used for financial statement reporting purposes. |
| |
(2) |
Represents the aggregate change in fair value during the indicated fiscal year of the outstanding and unvested stock awards
and option awards held, as of the last day of the indicated fiscal year, calculated using the same methodology used for financial
statement reporting purposes. For awards subject to performance-based vesting conditions, the fair value is based on the probable
outcome of such performance-based vesting conditions as of the last day of the fiscal year. |
| |
(3) |
Represents the aggregate change in fair value, measured from the prior fiscal year-end to the vesting date, of each stock
award and option award, that was granted in a prior fiscal year and which vested during the indicated fiscal year, calculated
using the same methodology used for financial statement reporting purposes. |
| (b) |
Mr. Mezger served as our PEO for each fiscal year shown. Our other NEOs were as follows: Messrs. Kaminski, McGibney,
Praw and Woram for the 2023 and 2022 fiscal years; and Messrs. Kaminski, McGibney and Praw, and Matthew W. Mandino for the
2021 fiscal year. |
| (c) |
The amounts reported reflect the cumulative total shareholder return (“TSR”) on our common stock for each
of the last three fiscal years ended November 30, 2023, assuming an investment of $100 on November 30, 2020, and the
reinvestment of dividends. |
| (d) |
The peer group used in this disclosure is the Dow Jones US Home Construction Index, which is the same index we used in
the Stock Performance Graph in our Annual Report. The amounts reported reflect the cumulative TSR of the Dow Jones US Home
Construction Index for each of the last three fiscal years ended November 30, 2023, assuming an investment of $100 on November
30, 2020, and the reinvestment of dividends. |
| (e) |
Represents net income reported in our audited consolidated financial statements for each of the applicable fiscal years. |
| (f) |
Annex 2 to this Proxy Statement contains a reconciliation of our diluted earnings per share calculated in accordance with
GAAP to the non-GAAP financial measure of AEPS. We included AEPS as our company-selected financial measure as this metric
has the largest weighting in determining our NEO’s long-term incentive compensation, a significant component of their
overall compensation. |
|
|
|
| Company Selected Measure Name |
|
AEPS
|
|
|
| Named Executive Officers, Footnote [Text Block] |
|
| (b) |
Mr. Mezger served as our PEO for each fiscal year shown. Our other NEOs were as follows: Messrs. Kaminski, McGibney,
Praw and Woram for the 2023 and 2022 fiscal years; and Messrs. Kaminski, McGibney and Praw, and Matthew W. Mandino for the
2021 fiscal year. |
|
|
|
| Peer Group Issuers, Footnote [Text Block] |
|
| (d) |
The peer group used in this disclosure is the Dow Jones US Home Construction Index, which is the same index we used in
the Stock Performance Graph in our Annual Report. The amounts reported reflect the cumulative TSR of the Dow Jones US Home
Construction Index for each of the last three fiscal years ended November 30, 2023, assuming an investment of $100 on November
30, 2020, and the reinvestment of dividends. |
|
|
|
| PEO Total Compensation Amount |
|
$ 15,689,055
|
$ 15,814,791
|
$ 14,366,518
|
| PEO Actually Paid Compensation Amount |
[1] |
$ 43,713,700
|
12,168,706
|
25,125,414
|
| Adjustment To PEO Compensation, Footnote [Text Block] |
|
| |
|
2023 |
|
2022 |
|
2021 |
| PEO |
Average
Other NEOs |
PEO |
Average
Other NEOs |
PEO |
Average
Other NEOs |
| Summary Compensation Table Total |
|
$ |
15,689,055 |
$ |
4,483,491 |
|
$ |
15,814,791 |
$ |
4,416,324 |
|
$ |
14,366,518 |
$ |
4,556,264 |
| Adjustments: |
|
|
|
|
|
|
|
|
|
|
|
|
|
|
|
| Grant date fair value of stock awards from Summary Compensation Table |
|
|
(7,178,664) |
|
(1,407,844) |
|
|
(7,105,882) |
|
(1,336,330) |
|
|
(4,999,996) |
|
(1,575,004) |
| Fair value of equity awards granted in the year and unvested as of year end(1) |
|
|
14,848,740 |
|
3,050,249 |
|
|
9,171,068 |
|
2,361,535 |
|
|
8,901,354 |
|
2,803,936 |
| Increase (decrease) in fair value from prior year end of outstanding and unvested awards granted
in prior years(2) |
|
|
18,435,361 |
|
4,092,993 |
|
|
(5,939,248) |
|
(1,127,786) |
|
|
5,205,965 |
|
1,168,011 |
| Increase (decrease) in fair value from prior year end of vested awards granted in prior years(3) |
|
|
1,035,950 |
|
169,437 |
|
|
(569,805) |
|
(112,753) |
|
|
1,201,244 |
|
163,721 |
| Dividends paid on awards during the year before vesting |
|
|
548,099 |
|
80,922 |
|
|
408,026 |
|
72,289 |
|
|
202,027 |
|
27,540 |
| “Change in pension value and nonqualified deferred compensation earnings” from Summary Compensation
Table |
|
|
- |
|
- |
|
|
- |
|
- |
|
|
(142,560) |
|
- |
| Service cost for pension plans |
|
|
335,159 |
|
- |
|
|
389,756 |
|
- |
|
|
390,862 |
|
- |
| CAP (as calculated per SEC rules) |
|
$ |
43,713,700 |
$ |
10,469,248 |
|
$ |
12,168,706 |
$ |
4,273,279 |
|
$ |
25,125,414 |
$ |
7,144,468 |
| |
(1) |
Represents the aggregate fair value as of the indicated fiscal year-end of outstanding and unvested stock awards granted
during such fiscal year, calculated using the same methodology used for financial statement reporting purposes. |
| |
(2) |
Represents the aggregate change in fair value during the indicated fiscal year of the outstanding and unvested stock awards
and option awards held, as of the last day of the indicated fiscal year, calculated using the same methodology used for financial
statement reporting purposes. For awards subject to performance-based vesting conditions, the fair value is based on the probable
outcome of such performance-based vesting conditions as of the last day of the fiscal year. |
| |
(3) |
Represents the aggregate change in fair value, measured from the prior fiscal year-end to the vesting date, of each stock
award and option award, that was granted in a prior fiscal year and which vested during the indicated fiscal year, calculated
using the same methodology used for financial statement reporting purposes. |
|
|
|
| Non-PEO NEO Average Total Compensation Amount |
[2] |
$ 4,483,491
|
4,416,324
|
4,556,264
|
| Non-PEO NEO Average Compensation Actually Paid Amount |
[1],[2] |
$ 10,469,248
|
4,273,279
|
7,144,468
|
| Adjustment to Non-PEO NEO Compensation Footnote [Text Block] |
|
| |
|
2023 |
|
2022 |
|
2021 |
| PEO |
Average
Other NEOs |
PEO |
Average
Other NEOs |
PEO |
Average
Other NEOs |
| Summary Compensation Table Total |
|
$ |
15,689,055 |
$ |
4,483,491 |
|
$ |
15,814,791 |
$ |
4,416,324 |
|
$ |
14,366,518 |
$ |
4,556,264 |
| Adjustments: |
|
|
|
|
|
|
|
|
|
|
|
|
|
|
|
| Grant date fair value of stock awards from Summary Compensation Table |
|
|
(7,178,664) |
|
(1,407,844) |
|
|
(7,105,882) |
|
(1,336,330) |
|
|
(4,999,996) |
|
(1,575,004) |
| Fair value of equity awards granted in the year and unvested as of year end(1) |
|
|
14,848,740 |
|
3,050,249 |
|
|
9,171,068 |
|
2,361,535 |
|
|
8,901,354 |
|
2,803,936 |
| Increase (decrease) in fair value from prior year end of outstanding and unvested awards granted
in prior years(2) |
|
|
18,435,361 |
|
4,092,993 |
|
|
(5,939,248) |
|
(1,127,786) |
|
|
5,205,965 |
|
1,168,011 |
| Increase (decrease) in fair value from prior year end of vested awards granted in prior years(3) |
|
|
1,035,950 |
|
169,437 |
|
|
(569,805) |
|
(112,753) |
|
|
1,201,244 |
|
163,721 |
| Dividends paid on awards during the year before vesting |
|
|
548,099 |
|
80,922 |
|
|
408,026 |
|
72,289 |
|
|
202,027 |
|
27,540 |
| “Change in pension value and nonqualified deferred compensation earnings” from Summary Compensation
Table |
|
|
- |
|
- |
|
|
- |
|
- |
|
|
(142,560) |
|
- |
| Service cost for pension plans |
|
|
335,159 |
|
- |
|
|
389,756 |
|
- |
|
|
390,862 |
|
- |
| CAP (as calculated per SEC rules) |
|
$ |
43,713,700 |
$ |
10,469,248 |
|
$ |
12,168,706 |
$ |
4,273,279 |
|
$ |
25,125,414 |
$ |
7,144,468 |
| |
(1) |
Represents the aggregate fair value as of the indicated fiscal year-end of outstanding and unvested stock awards granted
during such fiscal year, calculated using the same methodology used for financial statement reporting purposes. |
| |
(2) |
Represents the aggregate change in fair value during the indicated fiscal year of the outstanding and unvested stock awards
and option awards held, as of the last day of the indicated fiscal year, calculated using the same methodology used for financial
statement reporting purposes. For awards subject to performance-based vesting conditions, the fair value is based on the probable
outcome of such performance-based vesting conditions as of the last day of the fiscal year. |
| |
(3) |
Represents the aggregate change in fair value, measured from the prior fiscal year-end to the vesting date, of each stock
award and option award, that was granted in a prior fiscal year and which vested during the indicated fiscal year, calculated
using the same methodology used for financial statement reporting purposes. |
|
|
|
| Compensation Actually Paid vs. Total Shareholder Return [Text Block] |
|
|
|
|
| Compensation Actually Paid vs. Net Income [Text Block] |
|
|
|
|
| Compensation Actually Paid vs. Company Selected Measure [Text Block] |
|
|
|
|
| Total Shareholder Return Vs Peer Group [Text Block] |
|
|
|
|
| Tabular List [Table Text Block] |
|
Pay Versus Performance Tabular List
Below is a list of the most important financial
performance measures we used to link CAP for our NEOs to our performance for the fiscal year ended November 30, 2023. Our use
of these measures is discussed under “Compensation Discussion and Analysis.”
| ■ |
AEPS (the company-selected measure); |
| ■ |
AROIC; |
| ■ |
Adjusted pretax income; |
| ■ |
Revenue growth, relative to our peer group; |
| ■ |
Strategic measures, to the extent they incorporate or reflect financial performance metrics. |
|
|
|
| Total Shareholder Return Amount |
[3] |
$ 155.12
|
92.08
|
115.18
|
| Peer Group Total Shareholder Return Amount |
[4] |
176.92
|
112.90
|
133.37
|
| Net Income (Loss) Attributable to Parent |
[5] |
$ 590,177,000
|
$ 816,666,000
|
$ 564,746,000
|
| Company Selected Measure Amount | $ / shares |
[6] |
7.18
|
9.36
|
6.14
|
| Measure [Axis]: 1 |
|
|
|
|
| Pay vs Performance Disclosure [Table] |
|
|
|
|
| Measure Name |
|
AEPS (the company-selected measure);
|
|
|
| Measure [Axis]: 2 |
|
|
|
|
| Pay vs Performance Disclosure [Table] |
|
|
|
|
| Measure Name |
|
AROIC;
|
|
|
| Measure [Axis]: 3 |
|
|
|
|
| Pay vs Performance Disclosure [Table] |
|
|
|
|
| Measure Name |
|
Adjusted pretax income;
|
|
|
| Measure [Axis]: 4 |
|
|
|
|
| Pay vs Performance Disclosure [Table] |
|
|
|
|
| Measure Name |
|
Revenue growth, relative to our peer group;
|
|
|
| Measure [Axis]: 5 |
|
|
|
|
| Pay vs Performance Disclosure [Table] |
|
|
|
|
| Measure Name |
|
Strategic measures, to the extent they incorporate or reflect financial performance metrics.
|
|
|
| PEO [Member] | Jeffrey T. Mezger |
|
|
|
|
| Pay vs Performance Disclosure [Table] |
|
|
|
|
| PEO Name |
|
Mr. Mezger
|
Mr. Mezger
|
Mr. Mezger
|
| PEO [Member] | Grant date fair value of stock awards from Summary Compensation Table |
|
|
|
|
| Pay vs Performance Disclosure [Table] |
|
|
|
|
| Adjustment to Compensation Amount |
|
$ (7,178,664)
|
$ (7,105,882)
|
$ (4,999,996)
|
| PEO [Member] | Fair value of equity awards granted in the year and unvested as of year end |
|
|
|
|
| Pay vs Performance Disclosure [Table] |
|
|
|
|
| Adjustment to Compensation Amount |
[7] |
14,848,740
|
9,171,068
|
8,901,354
|
| PEO [Member] | Increase (decrease) in fair value from prior year end of outstanding and unvested awards granted in prior years |
|
|
|
|
| Pay vs Performance Disclosure [Table] |
|
|
|
|
| Adjustment to Compensation Amount |
[8] |
18,435,361
|
(5,939,248)
|
5,205,965
|
| PEO [Member] | Increase (decrease) in fair value from prior year end of vested awards granted in prior years |
|
|
|
|
| Pay vs Performance Disclosure [Table] |
|
|
|
|
| Adjustment to Compensation Amount |
[9] |
1,035,950
|
(569,805)
|
1,201,244
|
| PEO [Member] | Dividends paid on awards during the year before vesting |
|
|
|
|
| Pay vs Performance Disclosure [Table] |
|
|
|
|
| Adjustment to Compensation Amount |
|
548,099
|
408,026
|
202,027
|
| PEO [Member] | “Change in pension value and nonqualified deferred compensation earnings” from Summary Compensation Table |
|
|
|
|
| Pay vs Performance Disclosure [Table] |
|
|
|
|
| Adjustment to Compensation Amount |
|
|
|
(142,560)
|
| PEO [Member] | Service cost for pension plans |
|
|
|
|
| Pay vs Performance Disclosure [Table] |
|
|
|
|
| Adjustment to Compensation Amount |
|
$ 335,159
|
$ 389,756
|
$ 390,862
|
| Non-PEO NEO [Member] | Jeff J. Kaminski |
|
|
|
|
| Pay vs Performance Disclosure [Table] |
|
|
|
|
| PEO Name |
|
Kaminski
|
Kaminski
|
Kaminski
|
| Non-PEO NEO [Member] | Robert V. McGibney |
|
|
|
|
| Pay vs Performance Disclosure [Table] |
|
|
|
|
| PEO Name |
|
McGibney
|
McGibney
|
McGibney
|
| Non-PEO NEO [Member] | Albert Z. Praw |
|
|
|
|
| Pay vs Performance Disclosure [Table] |
|
|
|
|
| PEO Name |
|
Praw
|
Praw
|
Praw
|
| Non-PEO NEO [Member] | Brian J. Woram |
|
|
|
|
| Pay vs Performance Disclosure [Table] |
|
|
|
|
| PEO Name |
|
Woram
|
Woram
|
|
| Non-PEO NEO [Member] | Matthew W. Mandino |
|
|
|
|
| Pay vs Performance Disclosure [Table] |
|
|
|
|
| PEO Name |
|
|
|
Matthew W. Mandino
|
| Non-PEO NEO [Member] | Grant date fair value of stock awards from Summary Compensation Table |
|
|
|
|
| Pay vs Performance Disclosure [Table] |
|
|
|
|
| Adjustment to Compensation Amount |
|
$ (1,407,844)
|
$ (1,336,330)
|
$ (1,575,004)
|
| Non-PEO NEO [Member] | Fair value of equity awards granted in the year and unvested as of year end |
|
|
|
|
| Pay vs Performance Disclosure [Table] |
|
|
|
|
| Adjustment to Compensation Amount |
[7] |
3,050,249
|
2,361,535
|
2,803,936
|
| Non-PEO NEO [Member] | Increase (decrease) in fair value from prior year end of outstanding and unvested awards granted in prior years |
|
|
|
|
| Pay vs Performance Disclosure [Table] |
|
|
|
|
| Adjustment to Compensation Amount |
[8] |
4,092,993
|
(1,127,786)
|
1,168,011
|
| Non-PEO NEO [Member] | Increase (decrease) in fair value from prior year end of vested awards granted in prior years |
|
|
|
|
| Pay vs Performance Disclosure [Table] |
|
|
|
|
| Adjustment to Compensation Amount |
[9] |
169,437
|
(112,753)
|
163,721
|
| Non-PEO NEO [Member] | Dividends paid on awards during the year before vesting |
|
|
|
|
| Pay vs Performance Disclosure [Table] |
|
|
|
|
| Adjustment to Compensation Amount |
|
80,922
|
72,289
|
27,540
|
| Non-PEO NEO [Member] | “Change in pension value and nonqualified deferred compensation earnings” from Summary Compensation Table |
|
|
|
|
| Pay vs Performance Disclosure [Table] |
|
|
|
|
| Adjustment to Compensation Amount |
|
|
|
|
| Non-PEO NEO [Member] | Service cost for pension plans |
|
|
|
|
| Pay vs Performance Disclosure [Table] |
|
|
|
|
| Adjustment to Compensation Amount |
|
|
|
|
|
|
| X |
- ReferencesReference 1: http://www.xbrl.org/2003/role/presentationRef
-Publisher SEC
-Name Regulation S-K
-Number 229
-Section 402
-Subsection v
-Paragraph 3
| Name: |
ecd_AdjToCompAmt |
| Namespace Prefix: |
ecd_ |
| Data Type: |
xbrli:monetaryItemType |
| Balance Type: |
na |
| Period Type: |
duration |
|
| X |
- ReferencesReference 1: http://www.xbrl.org/2003/role/presentationRef
-Publisher SEC
-Name Regulation S-K
-Number 229
-Section 402
-Subsection v
-Paragraph 3
| Name: |
ecd_AdjToNonPeoNeoCompFnTextBlock |
| Namespace Prefix: |
ecd_ |
| Data Type: |
dtr-types:textBlockItemType |
| Balance Type: |
na |
| Period Type: |
duration |
|
| X |
- ReferencesReference 1: http://www.xbrl.org/2003/role/presentationRef
-Publisher SEC
-Name Regulation S-K
-Number 229
-Section 402
-Subsection v
-Paragraph 3
| Name: |
ecd_AdjToPeoCompFnTextBlock |
| Namespace Prefix: |
ecd_ |
| Data Type: |
dtr-types:textBlockItemType |
| Balance Type: |
na |
| Period Type: |
duration |
|
| X |
- ReferencesReference 1: http://www.xbrl.org/2003/role/presentationRef
-Publisher SEC
-Name Regulation S-K
-Number 229
-Section 402
-Subsection v
-Paragraph 2
-Subparagraph vi
| Name: |
ecd_CoSelectedMeasureAmt |
| Namespace Prefix: |
ecd_ |
| Data Type: |
xbrli:decimalItemType |
| Balance Type: |
na |
| Period Type: |
duration |
|
| X |
- ReferencesReference 1: http://www.xbrl.org/2003/role/presentationRef
-Publisher SEC
-Name Regulation S-K
-Number 229
-Section 402
-Subsection v
-Paragraph 2
-Subparagraph vi
| Name: |
ecd_CoSelectedMeasureName |
| Namespace Prefix: |
ecd_ |
| Data Type: |
xbrli:normalizedStringItemType |
| Balance Type: |
na |
| Period Type: |
duration |
|
| X |
- ReferencesReference 1: http://www.xbrl.org/2003/role/presentationRef
-Publisher SEC
-Name Regulation S-K
-Number 229
-Section 402
-Subsection v
-Paragraph 5
-Subparagraph iii
| Name: |
ecd_CompActuallyPaidVsCoSelectedMeasureTextBlock |
| Namespace Prefix: |
ecd_ |
| Data Type: |
dtr-types:textBlockItemType |
| Balance Type: |
na |
| Period Type: |
duration |
|
| X |
- ReferencesReference 1: http://www.xbrl.org/2003/role/presentationRef
-Publisher SEC
-Name Regulation S-K
-Number 229
-Section 402
-Subsection v
-Paragraph 5
-Subparagraph ii
| Name: |
ecd_CompActuallyPaidVsNetIncomeTextBlock |
| Namespace Prefix: |
ecd_ |
| Data Type: |
dtr-types:textBlockItemType |
| Balance Type: |
na |
| Period Type: |
duration |
|
| X |
- ReferencesReference 1: http://www.xbrl.org/2003/role/presentationRef
-Publisher SEC
-Name Regulation S-K
-Number 229
-Section 402
-Subsection v
-Paragraph 5
-Subparagraph i
| Name: |
ecd_CompActuallyPaidVsTotalShareholderRtnTextBlock |
| Namespace Prefix: |
ecd_ |
| Data Type: |
dtr-types:textBlockItemType |
| Balance Type: |
na |
| Period Type: |
duration |
|
| X |
- ReferencesReference 1: http://www.xbrl.org/2003/role/presentationRef
-Publisher SEC
-Name Regulation S-K
-Number 229
-Section 402
-Subsection v
-Paragraph 2
-Subparagraph vi
| Name: |
ecd_MeasureName |
| Namespace Prefix: |
ecd_ |
| Data Type: |
xbrli:normalizedStringItemType |
| Balance Type: |
na |
| Period Type: |
duration |
|
| X |
- ReferencesReference 1: http://www.xbrl.org/2003/role/presentationRef
-Publisher SEC
-Name Regulation S-K
-Number 229
-Section 402
-Subsection v
-Paragraph 3
| Name: |
ecd_NamedExecutiveOfficersFnTextBlock |
| Namespace Prefix: |
ecd_ |
| Data Type: |
dtr-types:textBlockItemType |
| Balance Type: |
na |
| Period Type: |
duration |
|
| X |
- ReferencesReference 1: http://www.xbrl.org/2003/role/presentationRef
-Publisher SEC
-Name Regulation S-K
-Number 229
-Section 402
-Subsection v
-Paragraph 2
-Subparagraph iii
| Name: |
ecd_NonPeoNeoAvgCompActuallyPaidAmt |
| Namespace Prefix: |
ecd_ |
| Data Type: |
xbrli:monetaryItemType |
| Balance Type: |
na |
| Period Type: |
duration |
|
| X |
- ReferencesReference 1: http://www.xbrl.org/2003/role/presentationRef
-Publisher SEC
-Name Regulation S-K
-Number 229
-Section 402
-Subsection v
-Paragraph 2
-Subparagraph ii
| Name: |
ecd_NonPeoNeoAvgTotalCompAmt |
| Namespace Prefix: |
ecd_ |
| Data Type: |
xbrli:monetaryItemType |
| Balance Type: |
na |
| Period Type: |
duration |
|
| X |
- ReferencesReference 1: http://www.xbrl.org/2003/role/presentationRef
-Publisher SEC
-Name Regulation S-K
-Number 229
-Section 402
-Subsection v
-Paragraph 2
-Subparagraph iv
| Name: |
ecd_PeerGroupIssuersFnTextBlock |
| Namespace Prefix: |
ecd_ |
| Data Type: |
dtr-types:textBlockItemType |
| Balance Type: |
na |
| Period Type: |
duration |
|
| X |
- ReferencesReference 1: http://www.xbrl.org/2003/role/presentationRef
-Publisher SEC
-Name Regulation S-K
-Number 229
-Section 402
-Subsection v
-Paragraph 2
-Subparagraph iv
| Name: |
ecd_PeerGroupTotalShareholderRtnAmt |
| Namespace Prefix: |
ecd_ |
| Data Type: |
xbrli:monetaryItemType |
| Balance Type: |
na |
| Period Type: |
duration |
|
| X |
- ReferencesReference 1: http://www.xbrl.org/2003/role/presentationRef
-Publisher SEC
-Name Regulation S-K
-Number 229
-Section 402
-Subsection v
-Paragraph 2
-Subparagraph iii
| Name: |
ecd_PeoActuallyPaidCompAmt |
| Namespace Prefix: |
ecd_ |
| Data Type: |
xbrli:monetaryItemType |
| Balance Type: |
na |
| Period Type: |
duration |
|
| X |
- ReferencesReference 1: http://www.xbrl.org/2003/role/presentationRef
-Publisher SEC
-Name Regulation S-K
-Number 229
-Section 402
-Subsection v
-Paragraph 3
| Name: |
ecd_PeoName |
| Namespace Prefix: |
ecd_ |
| Data Type: |
xbrli:normalizedStringItemType |
| Balance Type: |
na |
| Period Type: |
duration |
|
| X |
- ReferencesReference 1: http://www.xbrl.org/2003/role/presentationRef
-Publisher SEC
-Name Regulation S-K
-Number 229
-Section 402
-Subsection v
-Paragraph 2
-Subparagraph ii
| Name: |
ecd_PeoTotalCompAmt |
| Namespace Prefix: |
ecd_ |
| Data Type: |
xbrli:monetaryItemType |
| Balance Type: |
na |
| Period Type: |
duration |
|
| X |
- ReferencesReference 1: http://www.xbrl.org/2003/role/presentationRef
-Publisher SEC
-Name Regulation S-K
-Number 229
-Section 402
-Subsection v
-Paragraph 1
| Name: |
ecd_PvpTable |
| Namespace Prefix: |
ecd_ |
| Data Type: |
xbrli:stringItemType |
| Balance Type: |
na |
| Period Type: |
duration |
|
| X |
- ReferencesReference 1: http://www.xbrl.org/2003/role/presentationRef
-Publisher SEC
-Name Regulation S-K
-Number 229
-Section 402
-Subsection v
-Paragraph 1
| Name: |
ecd_PvpTableTextBlock |
| Namespace Prefix: |
ecd_ |
| Data Type: |
dtr-types:textBlockItemType |
| Balance Type: |
na |
| Period Type: |
duration |
|
| X |
- ReferencesReference 1: http://www.xbrl.org/2003/role/presentationRef
-Publisher SEC
-Name Regulation S-K
-Number 229
-Section 402
-Subsection v
-Paragraph 6
| Name: |
ecd_TabularListTableTextBlock |
| Namespace Prefix: |
ecd_ |
| Data Type: |
dtr-types:textBlockItemType |
| Balance Type: |
na |
| Period Type: |
duration |
|
| X |
- ReferencesReference 1: http://www.xbrl.org/2003/role/presentationRef
-Publisher SEC
-Name Regulation S-K
-Number 229
-Section 402
-Subsection v
-Paragraph 2
-Subparagraph iv
| Name: |
ecd_TotalShareholderRtnAmt |
| Namespace Prefix: |
ecd_ |
| Data Type: |
xbrli:monetaryItemType |
| Balance Type: |
na |
| Period Type: |
duration |
|
| X |
- ReferencesReference 1: http://www.xbrl.org/2003/role/presentationRef
-Publisher SEC
-Name Regulation S-K
-Number 229
-Section 402
-Subsection v
-Paragraph 5
-Subparagraph iv
| Name: |
ecd_TotalShareholderRtnVsPeerGroupTextBlock |
| Namespace Prefix: |
ecd_ |
| Data Type: |
dtr-types:textBlockItemType |
| Balance Type: |
na |
| Period Type: |
duration |
|
| X |
- DefinitionThe portion of profit or loss for the period, net of income taxes, which is attributable to the parent. Reference 1: http://www.xbrl.org/2003/role/disclosureRef
-Topic 235
-SubTopic 10
-Name Accounting Standards Codification
-Section S99
-Paragraph 1
-Subparagraph (SX 210.4-08(g)(1)(ii))
-Publisher FASB
-URI https://asc.fasb.org//1943274/2147480678/235-10-S99-1
Reference 2: http://www.xbrl.org/2003/role/disclosureRef
-Topic 323
-SubTopic 10
-Name Accounting Standards Codification
-Section 50
-Paragraph 3
-Subparagraph (c)
-Publisher FASB
-URI https://asc.fasb.org//1943274/2147481687/323-10-50-3
Reference 3: http://www.xbrl.org/2003/role/disclosureRef
-Topic 825
-SubTopic 10
-Name Accounting Standards Codification
-Section 50
-Paragraph 28
-Subparagraph (f)
-Publisher FASB
-URI https://asc.fasb.org//1943274/2147482907/825-10-50-28
Reference 4: http://www.xbrl.org/2003/role/disclosureRef
-Topic 220
-SubTopic 10
-Name Accounting Standards Codification
-Section 50
-Paragraph 6
-Publisher FASB
-URI https://asc.fasb.org//1943274/2147482765/220-10-50-6
Reference 5: http://www.xbrl.org/2003/role/disclosureRef
-Topic 250
-SubTopic 10
-Name Accounting Standards Codification
-Section 50
-Paragraph 3
-Publisher FASB
-URI https://asc.fasb.org//1943274/2147483443/250-10-50-3
Reference 6: http://www.xbrl.org/2003/role/disclosureRef
-Topic 250
-SubTopic 10
-Name Accounting Standards Codification
-Section 50
-Paragraph 1
-Subparagraph (b)(2)
-Publisher FASB
-URI https://asc.fasb.org//1943274/2147483443/250-10-50-1
Reference 7: http://www.xbrl.org/2003/role/disclosureRef
-Topic 815
-SubTopic 40
-Name Accounting Standards Codification
-Section 65
-Paragraph 1
-Subparagraph (f)
-Publisher FASB
-URI https://asc.fasb.org//1943274/2147480175/815-40-65-1
Reference 8: http://www.xbrl.org/2003/role/disclosureRef
-Topic 250
-SubTopic 10
-Name Accounting Standards Codification
-Section 50
-Paragraph 8
-Publisher FASB
-URI https://asc.fasb.org//1943274/2147483443/250-10-50-8
Reference 9: http://www.xbrl.org/2003/role/disclosureRef
-Topic 250
-SubTopic 10
-Name Accounting Standards Codification
-Section 50
-Paragraph 9
-Publisher FASB
-URI https://asc.fasb.org//1943274/2147483443/250-10-50-9
Reference 10: http://www.xbrl.org/2003/role/disclosureRef
-Topic 250
-SubTopic 10
-Name Accounting Standards Codification
-Section 50
-Paragraph 11
-Subparagraph (a)
-Publisher FASB
-URI https://asc.fasb.org//1943274/2147483443/250-10-50-11
Reference 11: http://www.xbrl.org/2003/role/disclosureRef
-Topic 250
-SubTopic 10
-Name Accounting Standards Codification
-Section 50
-Paragraph 11
-Subparagraph (b)
-Publisher FASB
-URI https://asc.fasb.org//1943274/2147483443/250-10-50-11
Reference 12: http://www.xbrl.org/2003/role/disclosureRef
-Topic 250
-SubTopic 10
-Name Accounting Standards Codification
-Section 50
-Paragraph 4
-Publisher FASB
-URI https://asc.fasb.org//1943274/2147483443/250-10-50-4
Reference 13: http://www.xbrl.org/2003/role/exampleRef
-Topic 946
-SubTopic 830
-Name Accounting Standards Codification
-Section 55
-Paragraph 10
-Publisher FASB
-URI https://asc.fasb.org//1943274/2147480167/946-830-55-10
Reference 14: http://www.xbrl.org/2003/role/disclosureRef
-Topic 946
-SubTopic 220
-Name Accounting Standards Codification
-Section 45
-Paragraph 7
-Publisher FASB
-URI https://asc.fasb.org//1943274/2147483581/946-220-45-7
Reference 15: http://www.xbrl.org/2003/role/disclosureRef
-Topic 944
-SubTopic 220
-Name Accounting Standards Codification
-Section S99
-Paragraph 1
-Subparagraph (SX 210.7-04(18))
-Publisher FASB
-URI https://asc.fasb.org//1943274/2147483586/944-220-S99-1
Reference 16: http://www.xbrl.org/2003/role/disclosureRef
-Topic 280
-SubTopic 10
-Name Accounting Standards Codification
-Section 50
-Paragraph 22
-Publisher FASB
-URI https://asc.fasb.org//1943274/2147482810/280-10-50-22
Reference 17: http://www.xbrl.org/2003/role/disclosureRef
-Topic 946
-SubTopic 220
-Name Accounting Standards Codification
-Section S99
-Paragraph 1
-Subparagraph (SX 210.6-07(9))
-Publisher FASB
-URI https://asc.fasb.org//1943274/2147483575/946-220-S99-1
Reference 18: http://www.xbrl.org/2003/role/disclosureRef
-Topic 946
-SubTopic 220
-Name Accounting Standards Codification
-Section S99
-Paragraph 3
-Subparagraph (SX 210.6-09(1)(d))
-Publisher FASB
-URI https://asc.fasb.org//1943274/2147483575/946-220-S99-3
Reference 19: http://www.xbrl.org/2003/role/disclosureRef
-Topic 470
-SubTopic 10
-Name Accounting Standards Codification
-Section S99
-Paragraph 1A
-Subparagraph (SX 210.13-01(a)(4)(i))
-Publisher FASB
-URI https://asc.fasb.org//1943274/2147480097/470-10-S99-1A
Reference 20: http://www.xbrl.org/2009/role/commonPracticeRef
-Topic 470
-SubTopic 10
-Name Accounting Standards Codification
-Section S99
-Paragraph 1A
-Subparagraph (SX 210.13-01(a)(4)(ii))
-Publisher FASB
-URI https://asc.fasb.org//1943274/2147480097/470-10-S99-1A
Reference 21: http://www.xbrl.org/2003/role/disclosureRef
-Topic 470
-SubTopic 10
-Name Accounting Standards Codification
-Section S99
-Paragraph 1A
-Subparagraph (SX 210.13-01(a)(4)(iii)(A))
-Publisher FASB
-URI https://asc.fasb.org//1943274/2147480097/470-10-S99-1A
Reference 22: http://www.xbrl.org/2003/role/disclosureRef
-Topic 470
-SubTopic 10
-Name Accounting Standards Codification
-Section S99
-Paragraph 1A
-Subparagraph (SX 210.13-01(a)(4)(iv))
-Publisher FASB
-URI https://asc.fasb.org//1943274/2147480097/470-10-S99-1A
Reference 23: http://www.xbrl.org/2003/role/disclosureRef
-Topic 470
-SubTopic 10
-Name Accounting Standards Codification
-Section S99
-Paragraph 1A
-Subparagraph (SX 210.13-01(a)(5))
-Publisher FASB
-URI https://asc.fasb.org//1943274/2147480097/470-10-S99-1A
Reference 24: http://www.xbrl.org/2003/role/disclosureRef
-Topic 470
-SubTopic 10
-Name Accounting Standards Codification
-Section S99
-Paragraph 1B
-Subparagraph (SX 210.13-02(a)(4)(i))
-Publisher FASB
-URI https://asc.fasb.org//1943274/2147480097/470-10-S99-1B
Reference 25: http://www.xbrl.org/2003/role/disclosureRef
-Topic 470
-SubTopic 10
-Name Accounting Standards Codification
-Section S99
-Paragraph 1B
-Subparagraph (SX 210.13-02(a)(4)(iii)(A))
-Publisher FASB
-URI https://asc.fasb.org//1943274/2147480097/470-10-S99-1B
Reference 26: http://www.xbrl.org/2003/role/disclosureRef
-Topic 470
-SubTopic 10
-Name Accounting Standards Codification
-Section S99
-Paragraph 1B
-Subparagraph (SX 210.13-02(a)(4)(iii)(B))
-Publisher FASB
-URI https://asc.fasb.org//1943274/2147480097/470-10-S99-1B
Reference 27: http://www.xbrl.org/2003/role/disclosureRef
-Topic 470
-SubTopic 10
-Name Accounting Standards Codification
-Section S99
-Paragraph 1B
-Subparagraph (SX 210.13-02(a)(4)(iv))
-Publisher FASB
-URI https://asc.fasb.org//1943274/2147480097/470-10-S99-1B
Reference 28: http://www.xbrl.org/2003/role/disclosureRef
-Topic 470
-SubTopic 10
-Name Accounting Standards Codification
-Section S99
-Paragraph 1B
-Subparagraph (SX 210.13-02(a)(5))
-Publisher FASB
-URI https://asc.fasb.org//1943274/2147480097/470-10-S99-1B
Reference 29: http://www.xbrl.org/2003/role/disclosureRef
-Topic 280
-SubTopic 10
-Name Accounting Standards Codification
-Section 50
-Paragraph 30
-Subparagraph (b)
-Publisher FASB
-URI https://asc.fasb.org//1943274/2147482810/280-10-50-30
Reference 30: http://www.xbrl.org/2003/role/disclosureRef
-Topic 280
-SubTopic 10
-Name Accounting Standards Codification
-Section 50
-Paragraph 32
-Subparagraph (f)
-Publisher FASB
-URI https://asc.fasb.org//1943274/2147482810/280-10-50-32
Reference 31: http://www.xbrl.org/2003/role/disclosureRef
-Topic 260
-SubTopic 10
-Name Accounting Standards Codification
-Section 45
-Paragraph 60B
-Subparagraph (a)
-Publisher FASB
-URI https://asc.fasb.org//1943274/2147482689/260-10-45-60B
Reference 32: http://www.xbrl.org/2003/role/exampleRef
-Topic 280
-SubTopic 10
-Name Accounting Standards Codification
-Section 50
-Paragraph 31
-Publisher FASB
-URI https://asc.fasb.org//1943274/2147482810/280-10-50-31
Reference 33: http://www.xbrl.org/2003/role/disclosureRef
-Topic 280
-SubTopic 10
-Name Accounting Standards Codification
-Section 50
-Paragraph 32
-Subparagraph (c)
-Publisher FASB
-URI https://asc.fasb.org//1943274/2147482810/280-10-50-32
Reference 34: http://www.xbrl.org/2003/role/disclosureRef
-Topic 205
-SubTopic 20
-Name Accounting Standards Codification
-Section 50
-Paragraph 7
-Publisher FASB
-URI https://asc.fasb.org//1943274/2147483499/205-20-50-7
Reference 35: http://fasb.org/us-gaap/role/ref/legacyRef
-Topic 230
-SubTopic 10
-Name Accounting Standards Codification
-Section 45
-Paragraph 28
-Publisher FASB
-URI https://asc.fasb.org//1943274/2147482740/230-10-45-28
Reference 36: http://www.xbrl.org/2003/role/disclosureRef
-Topic 220
-SubTopic 10
-Name Accounting Standards Codification
-Section 45
-Paragraph 1A
-Subparagraph (a)
-Publisher FASB
-URI https://asc.fasb.org//1943274/2147482790/220-10-45-1A
Reference 37: http://www.xbrl.org/2003/role/disclosureRef
-Topic 220
-SubTopic 10
-Name Accounting Standards Codification
-Section 45
-Paragraph 1B
-Subparagraph (a)
-Publisher FASB
-URI https://asc.fasb.org//1943274/2147482790/220-10-45-1B
Reference 38: http://fasb.org/us-gaap/role/ref/legacyRef
-Topic 220
-SubTopic 10
-Name Accounting Standards Codification
-Section S99
-Paragraph 2
-Subparagraph (SX 210.5-03(20))
-Publisher FASB
-URI https://asc.fasb.org//1943274/2147483621/220-10-S99-2
Reference 39: http://fasb.org/us-gaap/role/ref/legacyRef
-Topic 942
-SubTopic 220
-Name Accounting Standards Codification
-Section S99
-Paragraph 1
-Subparagraph (SX 210.9-04(22))
-Publisher FASB
-URI https://asc.fasb.org//1943274/2147483589/942-220-S99-1
| Name: |
us-gaap_NetIncomeLoss |
| Namespace Prefix: |
us-gaap_ |
| Data Type: |
xbrli:monetaryItemType |
| Balance Type: |
credit |
| Period Type: |
duration |
|
| X |
- Details
| Name: |
ecd_MeasureAxis=1 |
| Namespace Prefix: |
|
| Data Type: |
na |
| Balance Type: |
|
| Period Type: |
|
|
| X |
- Details
| Name: |
ecd_MeasureAxis=2 |
| Namespace Prefix: |
|
| Data Type: |
na |
| Balance Type: |
|
| Period Type: |
|
|
| X |
- Details
| Name: |
ecd_MeasureAxis=3 |
| Namespace Prefix: |
|
| Data Type: |
na |
| Balance Type: |
|
| Period Type: |
|
|
| X |
- Details
| Name: |
ecd_MeasureAxis=4 |
| Namespace Prefix: |
|
| Data Type: |
na |
| Balance Type: |
|
| Period Type: |
|
|
| X |
- Details
| Name: |
ecd_MeasureAxis=5 |
| Namespace Prefix: |
|
| Data Type: |
na |
| Balance Type: |
|
| Period Type: |
|
|
| X |
- Details
| Name: |
ecd_ExecutiveCategoryAxis=ecd_PeoMember |
| Namespace Prefix: |
|
| Data Type: |
na |
| Balance Type: |
|
| Period Type: |
|
|
| X |
- Details
| Name: |
ecd_IndividualAxis=kbh_MrMezgerMember |
| Namespace Prefix: |
|
| Data Type: |
na |
| Balance Type: |
|
| Period Type: |
|
|
| X |
- Details
| Name: |
ecd_AdjToCompAxis=kbh_GrantDateFairValueOfStockAwardsFromSummaryCompensationTableMember |
| Namespace Prefix: |
|
| Data Type: |
na |
| Balance Type: |
|
| Period Type: |
|
|
| X |
- Details
| Name: |
ecd_AdjToCompAxis=kbh_FairValueOfEquityAwardsGrantedInTheYearAndUnvestedAsOfYearEndMember |
| Namespace Prefix: |
|
| Data Type: |
na |
| Balance Type: |
|
| Period Type: |
|
|
| X |
- Details
| Name: |
ecd_AdjToCompAxis=kbh_IncreaseDecreaseInFairValueFromPriorYearEndOfOutstandingAndUnvestedAwardsGrantedInPriorYearsMember |
| Namespace Prefix: |
|
| Data Type: |
na |
| Balance Type: |
|
| Period Type: |
|
|
| X |
- Details
| Name: |
ecd_AdjToCompAxis=kbh_IncreaseDecreaseInFairValueFromPriorYearEndOfVestedAwardsGrantedInPriorYearsMember |
| Namespace Prefix: |
|
| Data Type: |
na |
| Balance Type: |
|
| Period Type: |
|
|
| X |
- Details
| Name: |
ecd_AdjToCompAxis=kbh_DividendsPaidOnAwardsDuringTheYearBeforeVestingMember |
| Namespace Prefix: |
|
| Data Type: |
na |
| Balance Type: |
|
| Period Type: |
|
|
| X |
- Details
| Name: |
ecd_AdjToCompAxis=kbh_ChangeInPensionValueAndNonqualifiedDeferredCompensationEarningsFromSummaryCompensationTableMember |
| Namespace Prefix: |
|
| Data Type: |
na |
| Balance Type: |
|
| Period Type: |
|
|
| X |
- Details
| Name: |
ecd_AdjToCompAxis=kbh_ServiceCostForPensionPlansMember |
| Namespace Prefix: |
|
| Data Type: |
na |
| Balance Type: |
|
| Period Type: |
|
|
| X |
- Details
| Name: |
ecd_ExecutiveCategoryAxis=ecd_NonPeoNeoMember |
| Namespace Prefix: |
|
| Data Type: |
na |
| Balance Type: |
|
| Period Type: |
|
|
| X |
- Details
| Name: |
ecd_IndividualAxis=kbh_KaminskiMember |
| Namespace Prefix: |
|
| Data Type: |
na |
| Balance Type: |
|
| Period Type: |
|
|
| X |
- Details
| Name: |
ecd_IndividualAxis=kbh_McGibneyMember |
| Namespace Prefix: |
|
| Data Type: |
na |
| Balance Type: |
|
| Period Type: |
|
|
| X |
- Details
| Name: |
ecd_IndividualAxis=kbh_PrawMember |
| Namespace Prefix: |
|
| Data Type: |
na |
| Balance Type: |
|
| Period Type: |
|
|
| X |
- Details
| Name: |
ecd_IndividualAxis=kbh_WoramMember |
| Namespace Prefix: |
|
| Data Type: |
na |
| Balance Type: |
|
| Period Type: |
|
|
| X |
- Details
| Name: |
ecd_IndividualAxis=kbh_MatthewWMandinoMember |
| Namespace Prefix: |
|
| Data Type: |
na |
| Balance Type: |
|
| Period Type: |
|
|
KB Home (NYSE:KBH)
Historical Stock Chart
From Apr 2024 to May 2024

KB Home (NYSE:KBH)
Historical Stock Chart
From May 2023 to May 2024
