2021; Senior Vice President and Chief Administrative Officer of MatNav, March 2014 – April 2017; first joined Matson or a subsidiary in 2012.
Leonard P. Isotoff (52): Senior Vice President since April 2022; Senior Vice President, Pacific of MatNav since April 2022; Vice President, Sales – Hawaii of MatNav, July 2016 – April 2022; first joined Matson or a subsidiary in 1999.
Richard S. Kinney (60): Senior Vice President since April 2020; Senior Vice President, Network Operations of MatNav since January 2020; Vice President, West Coast Terminals and Purchasing of MatNav, May 2017 – January 2020; Vice President, Equipment & Inland Operations, January 2016 – April 2017; first joined Matson or a subsidiary in 1998.
John P. Lauer (63): Executive Vice President and Chief Commercial Officer since February 2021; Senior Vice President and Chief Commercial Officer, April 2017 – January 2021; Senior Vice President, Ocean Services, March 2015 – April 2017; Executive Vice President and Chief Commercial Officer of MatNav since February 2021; Senior Vice President and Chief Commercial Officer of MatNav, April 2017 – January 2021; Senior Vice President, Ocean Services of MatNav, March 2015 – April 2017; first joined Matson or a subsidiary in 2007.
Ku`uhaku T. Park (57): Senior Vice President since February 2022; Senior Vice President, Government and Community Relations of MatNav since February 2022; Vice President, Government and Community Relations of MatNav, October 2012 – January 2022; first joined Matson or a subsidiary in 2012.
Laura L. Rascon (61): Senior Vice President since February 2021; Senior Vice President, Customer Experience of MatNav since February 2021; Vice President, Customer Support of MatNav, July 2008 – January 2021; first joined Matson or a subsidiary in 1983.
Rusty K. Rolfe (66): Executive Vice President since February 2021; Senior Vice President, June 2012 – January 2021; President of Matson Logistics since July 2012; first joined Matson or a subsidiary in 2001.
Christopher A. Scott (50): Senior Vice President since February 2021; Senior Vice President, Transpacific Services of MatNav since February 2021; Vice President, Transpacific Services of MatNav, January 2015 – January 2021; first joined Matson or a subsidiary in 1995.
John W. Sullivan (70): Senior Vice President since April 2020; Senior Vice President, Vessel Operations and Engineering of MatNav since January 2020; Vice President, Vessel Operations and Engineering of MatNav, August 2003 – January 2020; first joined Matson or a subsidiary in 1993.
Jason L. Taylor (50): Senior Vice President since February 2022; Senior Vice President, Human Resources of MatNav since February 2022; Vice President, Human Resources of MatNav from January 2018 – January 2022; Director, HR Operations from December 2015 – December 2017; first joined Matson or a subsidiary in 2012.
Joel M. Wine (52): Executive Vice President and Chief Financial Officer since February 2021; Senior Vice President and Chief Financial Officer, September 2011 – January 2021; Executive Vice President and Chief Financial Officer of MatNav since February 2021; Senior Vice President and Chief Financial Officer of MatNav, June 2012 – January 2021; first joined Matson or a subsidiary in 2011.
19
Matson, Inc. | 2024 Proxy Statement
How will abstentions and broker non-votes affect the votes?
Abstentions and broker non-votes, if any, will generally have no effect on the voting results for any proposal, as they are not considered to be votes cast under Hawaii corporate law.
How will my shares be voted if I give my proxy but do not specify how my shares should be voted?
If you provide specific voting instructions, your shares will be voted at the Annual Meeting in accordance with your instructions. If you hold shares in your name (i.e., you are a shareholder of record and not a street name holder) and sign and return a proxy card without giving specific voting instructions, your shares will be voted “FOR” each of the director nominees named in this Proxy Statement, “FOR” Proposal 2, and “FOR” Proposal 3, in accordance with the Board’s recommendations.
Who will count the votes?
At the Annual Meeting, votes will be counted by an election inspector from the Company. Such inspector will participate in the Annual Meeting to process and count the votes cast by our shareholders, make a report of inspection and certify as to the number of votes cast on each proposal.
Who will conduct the proxy solicitation and how much will it cost?
We are soliciting proxies from shareholders on behalf of our Board and will pay for all costs incurred by it in connection with the solicitation. In addition to solicitation by mail, the directors, officers and employees of Matson and its subsidiaries may solicit proxies from shareholders in person or by telephone, videoconference, facsimile or email without additional compensation other than reimbursement for their actual expenses.
We have retained Alliance Advisors, a proxy solicitation firm, to assist us in the solicitation of proxies for the Annual Meeting. We will pay Alliance Advisors a fee of approximately $9,500 and reimburse the firm for its reasonable out-of-pocket expenses.
Arrangements also will be made with brokerage firms and other custodians, nominees and fiduciaries for the forwarding of solicitation material to the beneficial owners of stock held of record by such persons, and we will reimburse such custodians, nominees and fiduciaries for their reasonable out-of-pocket expenses in connection with these forwarding services.
Where can I find the voting results of the Annual Meeting?
We will announce preliminary voting results at the Annual Meeting and expect to publish final results on a Form 8-K filed with the SEC within four business days after the Annual Meeting.
How can I request a copy of the Annual Report on Form 10-K?
A copy of the Company’s Annual Report on Form 10-K for the fiscal year ended December 31, 2023 (including the consolidated financial statements and consolidated financial statement schedules) will be sent to any shareholder without charge by contacting Matson, Inc., 555 12th Street, Oakland, California 94607, Attn: Corporate Secretary, or by calling (510) 628-4000.
What is householding?
The Company may elect to “household” the mailing of the proxy statement and our annual report for individual shareholders sharing an address with one or more other shareholders. This means that only one copy of the annual report and proxy statement or Notice of Internet Availability of Proxy Materials will be sent to that address unless one or more shareholders at that address specifically elect to receive separate mailings. Shareholders who participate in householding will continue to receive separate proxy
61
Matson, Inc. | 2024 Proxy Statement
Pay vs Performance Disclosure - USD ($)
|
12 Months Ended |
Dec. 31, 2023 |
Dec. 31, 2022 |
Dec. 31, 2021 |
Dec. 31, 2020 |
| Pay vs Performance Disclosure |
|
|
|
|
| Pay vs Performance Disclosure, Table |
| | | | | | | | | | | | | | | | | | | | | | | | | | | Value of Initial Fixed $100 | | | | | | | Summary | | | | Compensation | | Average | | | | Peer Group | | | | | | | Compensation | | Compensation | | Table Total for | | Compensation | | Total | | Total | | | | | Fiscal | | Table Total For | | Actually Paid | | Non-PEO NEOs | | Actually Paid Non- | | Shareholder | | Shareholder | | Net Income | | EBITDA | Year | | PEO ($)(1) | | to PEO ($)(2) | | ($)(3) | | PEO NEOs ($)(4) | | Return (TSR) | | Return(5) | | ($ in millions) | | ($ in millions) | (a) | | (b) | | (c) | | (d) | | (e) | | (f) | | (g) | | (h) | | (i) | 2020 | | 5,477,333 | | 15,959,815 | | 1,966,849 | | 4,478,273 | | 143 | | 112 | | 193.1 | | 423.7 | 2021 | | 5,957,058 | | 18,441,621 | | 2,131,642 | | 5,339,084 | | 229 | | 151 | | 927.4 | | 1,350.3 | 2022 | | 6,027,870 | | 838,314 | | 2,076,267 | | 719,551 | | 162 | | 108 | | 1,063.9 | | 1,526.2 | 2023 | | 6,165,815 | | 18,796,575 | | 2,080,781 | | 5,304,691 | | 288 | | 136 | | 297.1 | | 516.7 |
(1) | The dollar amounts reported are the amounts of total compensation reported in the Summary Compensation Table (“SCT”) for our CEO (“Principal Executive Officer” or “PEO”). |
(2) | The dollar amounts reported represent the amount of CAP for the PEO, as computed in accordance with SEC rules. The dollar amounts do not reflect the actual amount of compensation earned by or paid to an executive during the applicable year. CAP includes year-over-year changes in the value of unvested equity awards, and therefore may not reflect the value ultimately realized upon vesting of the awards. In accordance with SEC rules, the following adjustments were made to total compensation to determine the CAP: |
| | | | | | | | | | | | | | | | | Less SCT | | Less SCT | | Plus CAP | | Plus CAP | | | | | SCT | | Stock | | Pension | | Equity | | Pension | | Compensation | | | Total | | Awards | | Value | | Adjustment | | Adjustment | | Actually Paid | Year | | ($) | | ($)(a) | | ($)(b) | | ($)(c) | | ($)(d) | | ($) | 2020 | | 5,477,333 | | 2,662,521 | | 362,244 | | 13,411,142 | | 96,105 | | 15,959,815 | 2021 | | 5,957,058 | | 3,184,092 | | 112,142 | | 15,679,416 | | 101,381 | | 18,441,621 | 2022 | | 6,027,870 | | 3,341,181 | | — | | (1,978,185) | | 129,810 | | 838,314 | 2023 | | 6,165,815 | | 3,237,822 | | 196,171 | | 15,988,677 | | 76,076 | | 18,796,575 |
| (a) | The grant date fair value of equity awards represents the total of the amounts reported in the “Stock Awards” column in the Summary Compensation Table for the applicable year. |
| (b) | Represents change in actuarial present value of defined benefit retirement plans for the covered fiscal year. |
| (c) | The equity award adjustments for each applicable year include the addition (or subtraction, as applicable) of the following: (i) the year-end fair value of any equity awards granted in the applicable year that are outstanding and unvested as of the end of the year; (ii) the amount of change as of the end of the applicable year (from the end of the prior fiscal year) in fair value of any awards granted in prior years that are outstanding and unvested as of the end of the applicable year; and (iii) for awards granted in prior years that vest in the applicable year, the amount equal to the change as of the vesting date (from the end of the prior fiscal year) in fair value. For 2023, the fair value of outstanding and unvested awards increased significantly due to share price appreciation and the Company’s strong ROIC and relative TSR performance. The amounts deducted or added in calculating the equity award adjustments are as follows: |
| | | | | | | | | | | Year-End | | | | Year Over Year Change | | | | | Fair Value of | | Year Over Year Change in | | in Fair Value of Equity | | | | | Equity Awards | | Fair Value of Outstanding | | Awards Granted in | | Total Equity | | | Granted | | and Unvested Equity | | Prior Years that Vested | | Award | | | During the Year | | Awards | | in the Year | | Adjustments | Year | | ($) | | ($) | | ($) | | ($) | 2020 | | 6,279,437 | | 7,257,784 | | (126,079) | | 13,411,142 | 2021 | | 6,804,516 | | 7,725,233 | | 1,149,667 | | 15,679,416 | 2022 | | 1,981,115 | | (4,447,058) | | 487,758 | | (1,978,185) | 2023 | | 8,918,914 | | 7,009,449 | | 60,314 | | 15,988,677 |
| (d) | Represents defined benefit retirement plan service cost attributed to services rendered during the covered fiscal year. |
(3) | The dollar amounts reported represent the average of the amounts reported for the Company’s NEOs as a group (excluding our CEO) in the “Total” column of the SCT in each applicable year. The names of each of the NEOs (excluding our CEO) included for purposes of calculating the average amounts in each applicable year are as follows: (i) for 2022 and 2023, Joel M. Wine, Peter T. Heilmann, John P. Lauer, and Rusty K. Rolfe; and (ii) for 2021 and 2020, Joel M. Wine, Ronald J. Forest, Peter T. Heilmann, and John P. Lauer. |
(4) | The dollar amounts reported represent the average amount of CAP for the NEOs as a group (excluding our CEO), as computed in accordance with SEC rules. The dollar amounts do not reflect the actual average amount of compensation earned by or paid to the NEOs as a group (excluding our CEO) during the applicable year. CAP includes year-over-year changes in the value of unvested equity awards, and therefore may not reflect the value ultimately realized upon vesting of the awards. In accordance with SEC rules, the following adjustments were made to average total compensation for the NEOs as a group (excluding our CEO) for each year to determine the CAP: |
| | | | | | | | | | | | | | | | | Less SCT | | Less SCT | | Plus CAP | | Plus CAP | | | | | SCT | | Stock | | Pension | | Equity | | Pension | | Compensation | | | Total | | Awards | | Value | | Adjustment | | Adjustment | | Actually Paid | Year | | ($) | | ($)(a) | | ($)(b) | | ($)(c) | | ($)(d) | | ($) | 2020 | | 1,966,849 | | 753,591 | | 83,785 | | 3,311,416 | | 37,384 | | 4,478,273 | 2021 | | 2,131,642 | | 878,384 | | 28,243 | | 4,075,589 | | 38,480 | | 5,339,084 | 2022 | | 2,076,267 | | 891,106 | | — | | (512,818) | | 47,208 | | 719,551 | 2023 | | 2,080,781 | | 809,446 | | 86,829 | | 4,087,803 | | 32,383 | | 5,304,691 |
| (a) | The grant date fair value of equity awards represents the total of the amounts reported in the “Stock Awards” column in the Summary Compensation Table for the applicable year. |
| (b) | Represents change in actuarial present value of defined benefit retirement plans for the covered fiscal year. |
| (c) | The equity award adjustments for each applicable year include the addition (or subtraction, as applicable) of the following: (i) the year-end fair value of any equity awards granted in the applicable year that are outstanding and unvested as of the end of the year; (ii) the amount of change as of the end of the applicable year (from the end of the prior fiscal year) in fair value of any awards granted in prior years that are outstanding and unvested as of the end of the applicable year; and (iii) for awards granted in prior years that vest in the applicable year, the amount equal to the change as of the vesting date (from the end of the prior fiscal year) in fair value. For 2023, the fair value of outstanding and unvested awards increased significantly due to share price appreciation and the Company’s strong ROIC and relative TSR performance. The amounts deducted or added in calculating the equity award adjustments are as follows: |
| | | | | | | | | | | Year-End | | | | Year Over Year Change | | | | | Fair Value of | | Year Over Year Change in | | in Fair Value of Equity | | | | | Equity Awards | | Fair Value of Outstanding | | Awards Granted in | | Total Equity | | | Granted | | and Unvested Equity | | Prior Years that Vested | | Award | | | During the Year | | Awards | | in the Year | | Adjustments | Year | | ($) | | ($) | | ($) | | ($) | 2020 | | 1,777,310 | | 1,596,777 | | (62,671) | | 3,311,416 | 2021 | | 1,877,186 | | 1,937,980 | | 260,423 | | 4,075,589 | 2022 | | 528,368 | | (1,140,610) | | 99,424 | | (512,818) | 2023 | | 2,229,738 | | 1,842,615 | | 15,450 | | 4,087,803 |
| (d) | Represents defined benefit retirement plan service cost attributed to services rendered during the covered fiscal year. |
(5) | S&P Transportation Select Industry Index |
|
|
|
|
| Company Selected Measure Name |
EBITDA
|
|
|
|
| Named Executive Officers, Footnote |
(3) | The dollar amounts reported represent the average of the amounts reported for the Company’s NEOs as a group (excluding our CEO) in the “Total” column of the SCT in each applicable year. The names of each of the NEOs (excluding our CEO) included for purposes of calculating the average amounts in each applicable year are as follows: (i) for 2022 and 2023, Joel M. Wine, Peter T. Heilmann, John P. Lauer, and Rusty K. Rolfe; and (ii) for 2021 and 2020, Joel M. Wine, Ronald J. Forest, Peter T. Heilmann, and John P. Lauer. |
|
|
|
|
| Peer Group Issuers, Footnote |
(5) | S&P Transportation Select Industry Index |
|
|
|
|
| PEO Total Compensation Amount |
$ 6,165,815
|
$ 6,027,870
|
$ 5,957,058
|
$ 5,477,333
|
| PEO Actually Paid Compensation Amount |
$ 18,796,575
|
838,314
|
18,441,621
|
15,959,815
|
| Adjustment To PEO Compensation, Footnote |
(2) | The dollar amounts reported represent the amount of CAP for the PEO, as computed in accordance with SEC rules. The dollar amounts do not reflect the actual amount of compensation earned by or paid to an executive during the applicable year. CAP includes year-over-year changes in the value of unvested equity awards, and therefore may not reflect the value ultimately realized upon vesting of the awards. In accordance with SEC rules, the following adjustments were made to total compensation to determine the CAP: |
| | | | | | | | | | | | | | | | | Less SCT | | Less SCT | | Plus CAP | | Plus CAP | | | | | SCT | | Stock | | Pension | | Equity | | Pension | | Compensation | | | Total | | Awards | | Value | | Adjustment | | Adjustment | | Actually Paid | Year | | ($) | | ($)(a) | | ($)(b) | | ($)(c) | | ($)(d) | | ($) | 2020 | | 5,477,333 | | 2,662,521 | | 362,244 | | 13,411,142 | | 96,105 | | 15,959,815 | 2021 | | 5,957,058 | | 3,184,092 | | 112,142 | | 15,679,416 | | 101,381 | | 18,441,621 | 2022 | | 6,027,870 | | 3,341,181 | | — | | (1,978,185) | | 129,810 | | 838,314 | 2023 | | 6,165,815 | | 3,237,822 | | 196,171 | | 15,988,677 | | 76,076 | | 18,796,575 |
| (a) | The grant date fair value of equity awards represents the total of the amounts reported in the “Stock Awards” column in the Summary Compensation Table for the applicable year. |
| (b) | Represents change in actuarial present value of defined benefit retirement plans for the covered fiscal year. |
| (c) | The equity award adjustments for each applicable year include the addition (or subtraction, as applicable) of the following: (i) the year-end fair value of any equity awards granted in the applicable year that are outstanding and unvested as of the end of the year; (ii) the amount of change as of the end of the applicable year (from the end of the prior fiscal year) in fair value of any awards granted in prior years that are outstanding and unvested as of the end of the applicable year; and (iii) for awards granted in prior years that vest in the applicable year, the amount equal to the change as of the vesting date (from the end of the prior fiscal year) in fair value. For 2023, the fair value of outstanding and unvested awards increased significantly due to share price appreciation and the Company’s strong ROIC and relative TSR performance. The amounts deducted or added in calculating the equity award adjustments are as follows: |
| | | | | | | | | | | Year-End | | | | Year Over Year Change | | | | | Fair Value of | | Year Over Year Change in | | in Fair Value of Equity | | | | | Equity Awards | | Fair Value of Outstanding | | Awards Granted in | | Total Equity | | | Granted | | and Unvested Equity | | Prior Years that Vested | | Award | | | During the Year | | Awards | | in the Year | | Adjustments | Year | | ($) | | ($) | | ($) | | ($) | 2020 | | 6,279,437 | | 7,257,784 | | (126,079) | | 13,411,142 | 2021 | | 6,804,516 | | 7,725,233 | | 1,149,667 | | 15,679,416 | 2022 | | 1,981,115 | | (4,447,058) | | 487,758 | | (1,978,185) | 2023 | | 8,918,914 | | 7,009,449 | | 60,314 | | 15,988,677 |
| (d) | Represents defined benefit retirement plan service cost attributed to services rendered during the covered fiscal year. |
|
|
|
|
| Non-PEO NEO Average Total Compensation Amount |
$ 2,080,781
|
2,076,267
|
2,131,642
|
1,966,849
|
| Non-PEO NEO Average Compensation Actually Paid Amount |
$ 5,304,691
|
719,551
|
5,339,084
|
4,478,273
|
| Adjustment to Non-PEO NEO Compensation Footnote |
(4) | The dollar amounts reported represent the average amount of CAP for the NEOs as a group (excluding our CEO), as computed in accordance with SEC rules. The dollar amounts do not reflect the actual average amount of compensation earned by or paid to the NEOs as a group (excluding our CEO) during the applicable year. CAP includes year-over-year changes in the value of unvested equity awards, and therefore may not reflect the value ultimately realized upon vesting of the awards. In accordance with SEC rules, the following adjustments were made to average total compensation for the NEOs as a group (excluding our CEO) for each year to determine the CAP: |
| | | | | | | | | | | | | | | | | Less SCT | | Less SCT | | Plus CAP | | Plus CAP | | | | | SCT | | Stock | | Pension | | Equity | | Pension | | Compensation | | | Total | | Awards | | Value | | Adjustment | | Adjustment | | Actually Paid | Year | | ($) | | ($)(a) | | ($)(b) | | ($)(c) | | ($)(d) | | ($) | 2020 | | 1,966,849 | | 753,591 | | 83,785 | | 3,311,416 | | 37,384 | | 4,478,273 | 2021 | | 2,131,642 | | 878,384 | | 28,243 | | 4,075,589 | | 38,480 | | 5,339,084 | 2022 | | 2,076,267 | | 891,106 | | — | | (512,818) | | 47,208 | | 719,551 | 2023 | | 2,080,781 | | 809,446 | | 86,829 | | 4,087,803 | | 32,383 | | 5,304,691 |
| (a) | The grant date fair value of equity awards represents the total of the amounts reported in the “Stock Awards” column in the Summary Compensation Table for the applicable year. |
| (b) | Represents change in actuarial present value of defined benefit retirement plans for the covered fiscal year. |
| (c) | The equity award adjustments for each applicable year include the addition (or subtraction, as applicable) of the following: (i) the year-end fair value of any equity awards granted in the applicable year that are outstanding and unvested as of the end of the year; (ii) the amount of change as of the end of the applicable year (from the end of the prior fiscal year) in fair value of any awards granted in prior years that are outstanding and unvested as of the end of the applicable year; and (iii) for awards granted in prior years that vest in the applicable year, the amount equal to the change as of the vesting date (from the end of the prior fiscal year) in fair value. For 2023, the fair value of outstanding and unvested awards increased significantly due to share price appreciation and the Company’s strong ROIC and relative TSR performance. The amounts deducted or added in calculating the equity award adjustments are as follows: |
| | | | | | | | | | | Year-End | | | | Year Over Year Change | | | | | Fair Value of | | Year Over Year Change in | | in Fair Value of Equity | | | | | Equity Awards | | Fair Value of Outstanding | | Awards Granted in | | Total Equity | | | Granted | | and Unvested Equity | | Prior Years that Vested | | Award | | | During the Year | | Awards | | in the Year | | Adjustments | Year | | ($) | | ($) | | ($) | | ($) | 2020 | | 1,777,310 | | 1,596,777 | | (62,671) | | 3,311,416 | 2021 | | 1,877,186 | | 1,937,980 | | 260,423 | | 4,075,589 | 2022 | | 528,368 | | (1,140,610) | | 99,424 | | (512,818) | 2023 | | 2,229,738 | | 1,842,615 | | 15,450 | | 4,087,803 |
| (d) | Represents defined benefit retirement plan service cost attributed to services rendered during the covered fiscal year. |
|
|
|
|
| Compensation Actually Paid vs. Total Shareholder Return |
CAP and TSR 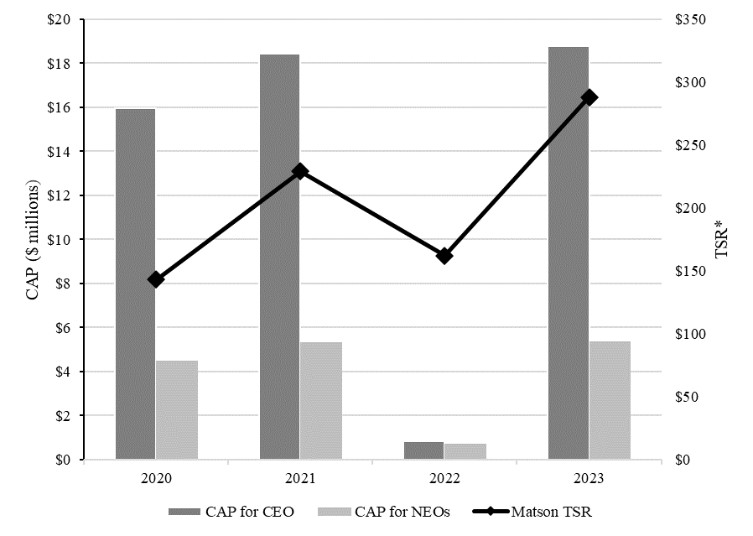
* Cumulative value of $100 invested in Matson common stock on December 31, 2019, including reinvestments of dividends
|
|
|
|
| Compensation Actually Paid vs. Net Income |
CAP and Net Income 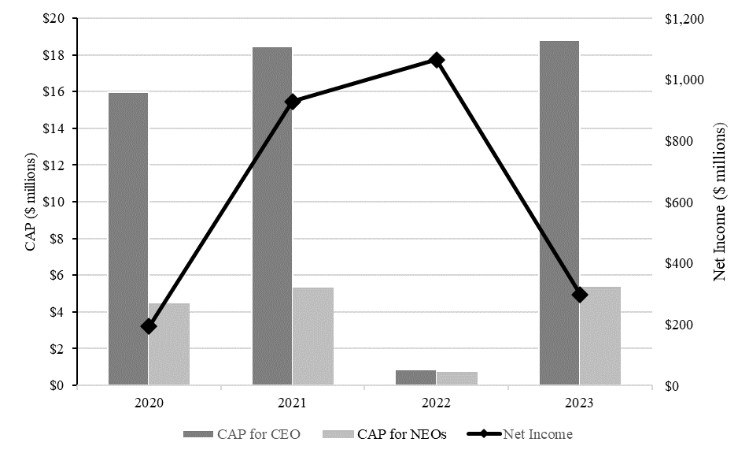
|
|
|
|
| Compensation Actually Paid vs. Company Selected Measure |
CAP and EBITDA 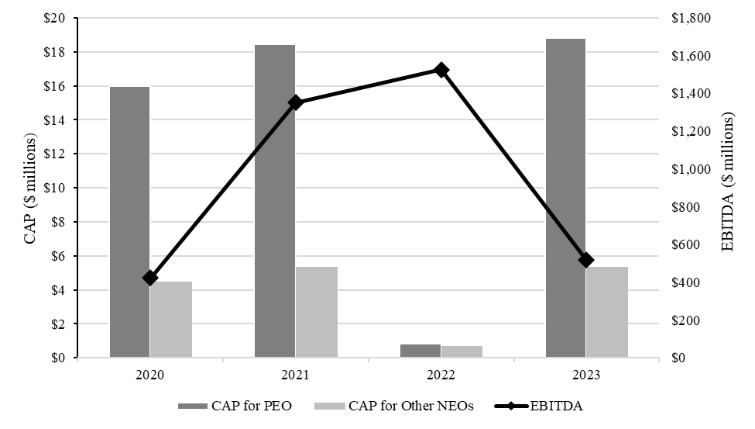
|
|
|
|
| Total Shareholder Return Vs Peer Group |
Cumulative Four-Year Total Shareholder Return
Matson, Inc. and S&P Transportation Select Industry Index 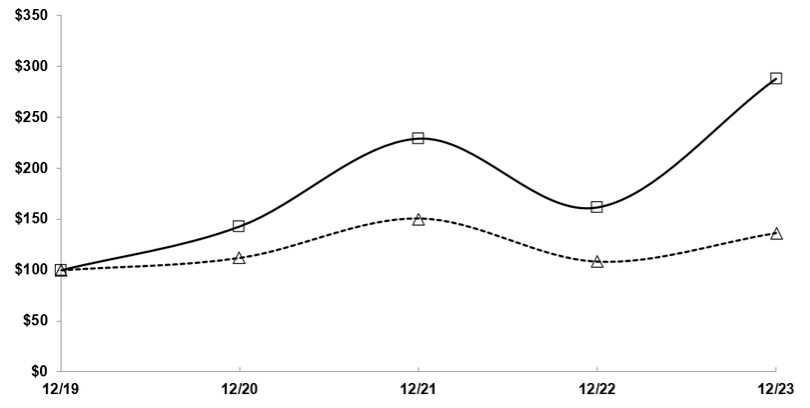

|
|
|
|
| Tabular List, Table |
| ● | Individual Performance Goals |
|
|
|
|
| Total Shareholder Return Amount |
$ 288
|
162
|
229
|
143
|
| Peer Group Total Shareholder Return Amount |
136
|
108
|
151
|
112
|
| Net Income (Loss) |
$ 297,100,000
|
$ 1,063,900,000
|
$ 927,400,000
|
$ 193,100,000
|
| Company Selected Measure Amount |
516,700,000
|
1,526,200,000
|
1,350,300,000
|
423,700,000
|
| Measure:: 1 |
|
|
|
|
| Pay vs Performance Disclosure |
|
|
|
|
| Name |
EBITDA
|
|
|
|
| Measure:: 2 |
|
|
|
|
| Pay vs Performance Disclosure |
|
|
|
|
| Name |
Individual Performance Goals
|
|
|
|
| Measure:: 3 |
|
|
|
|
| Pay vs Performance Disclosure |
|
|
|
|
| Name |
Relative TSR
|
|
|
|
| Measure:: 4 |
|
|
|
|
| Pay vs Performance Disclosure |
|
|
|
|
| Name |
ROIC
|
|
|
|
| PEO | Less SCT Pension Value |
|
|
|
|
| Pay vs Performance Disclosure |
|
|
|
|
| Adjustment to Compensation, Amount |
$ (196,171)
|
|
$ (112,142)
|
$ (362,244)
|
| PEO | Plus CAP Pension Adjustment |
|
|
|
|
| Pay vs Performance Disclosure |
|
|
|
|
| Adjustment to Compensation, Amount |
76,076
|
$ 129,810
|
101,381
|
96,105
|
| PEO | Less SCT Stock Awards |
|
|
|
|
| Pay vs Performance Disclosure |
|
|
|
|
| Adjustment to Compensation, Amount |
(3,237,822)
|
(3,341,181)
|
(3,184,092)
|
(2,662,521)
|
| PEO | Plus CAP Equity Adjustment |
|
|
|
|
| Pay vs Performance Disclosure |
|
|
|
|
| Adjustment to Compensation, Amount |
15,988,677
|
(1,978,185)
|
15,679,416
|
13,411,142
|
| PEO | Year-end Fair Value of Equity Awards Granted During the Year |
|
|
|
|
| Pay vs Performance Disclosure |
|
|
|
|
| Adjustment to Compensation, Amount |
8,918,914
|
1,981,115
|
6,804,516
|
6,279,437
|
| PEO | Year Over Year Change in Fair Value of Outstanding and Unvested Equity Awards |
|
|
|
|
| Pay vs Performance Disclosure |
|
|
|
|
| Adjustment to Compensation, Amount |
7,009,449
|
(4,447,058)
|
7,725,233
|
7,257,784
|
| PEO | Year Over Year Change in Fair Value of Equity Awards Granted in Prior Years that Vested in the Year |
|
|
|
|
| Pay vs Performance Disclosure |
|
|
|
|
| Adjustment to Compensation, Amount |
60,314
|
487,758
|
1,149,667
|
(126,079)
|
| Non-PEO NEO | Less SCT Pension Value |
|
|
|
|
| Pay vs Performance Disclosure |
|
|
|
|
| Adjustment to Compensation, Amount |
(86,829)
|
|
(28,243)
|
(83,785)
|
| Non-PEO NEO | Plus CAP Pension Adjustment |
|
|
|
|
| Pay vs Performance Disclosure |
|
|
|
|
| Adjustment to Compensation, Amount |
32,383
|
47,208
|
38,480
|
37,384
|
| Non-PEO NEO | Less SCT Stock Awards |
|
|
|
|
| Pay vs Performance Disclosure |
|
|
|
|
| Adjustment to Compensation, Amount |
(809,446)
|
(891,106)
|
(878,384)
|
(753,591)
|
| Non-PEO NEO | Plus CAP Equity Adjustment |
|
|
|
|
| Pay vs Performance Disclosure |
|
|
|
|
| Adjustment to Compensation, Amount |
4,087,803
|
(512,818)
|
4,075,589
|
3,311,416
|
| Non-PEO NEO | Year-end Fair Value of Equity Awards Granted During the Year |
|
|
|
|
| Pay vs Performance Disclosure |
|
|
|
|
| Adjustment to Compensation, Amount |
2,229,738
|
528,368
|
1,877,186
|
1,777,310
|
| Non-PEO NEO | Year Over Year Change in Fair Value of Outstanding and Unvested Equity Awards |
|
|
|
|
| Pay vs Performance Disclosure |
|
|
|
|
| Adjustment to Compensation, Amount |
1,842,615
|
(1,140,610)
|
1,937,980
|
1,596,777
|
| Non-PEO NEO | Year Over Year Change in Fair Value of Equity Awards Granted in Prior Years that Vested in the Year |
|
|
|
|
| Pay vs Performance Disclosure |
|
|
|
|
| Adjustment to Compensation, Amount |
$ 15,450
|
$ 99,424
|
$ 260,423
|
$ (62,671)
|