Farmers & Merchants Bank of Long Beach (OTCBB:FMBL) today
reported financial results for the third quarter ended September
30, 2011.
“The economic climate continues to pose challenges for
businesses and consumers alike, but Farmers & Merchants’ sound
approach to lending practices in the third quarter helped the Bank
maintain strength and profitability,” said Henry Walker, chief
executive officer of Farmers & Merchants Bank of Long Beach.
“While many of our peers may believe that introducing products with
fancy bells and whistles will drive performance, our priority
remains delivering no-nonsense banking that customers can depend on
in good times and bad.”
Income Statement
For the 2011 third quarter, interest income increased to $44.6
million from $44.4 million earned in the 2010 third quarter.
Interest income for the nine-month period ended September 30, 2011
was $135.3 million, compared with $135.0 million reported for the
same period in 2010.
Interest expense for the 2011 third quarter declined slightly to
$2.3 million from $2.9 million in last year’s third quarter, mostly
related to the low interest rate environment. Interest expense for
the nine-month period ended September 30, 2011 declined to $7.5
million from $9.4 million reported for the same period last
year.
Net interest income for the 2011 third quarter increased to
$42.2 million from $41.5 million for the third quarter of 2010, and
improved to $127.8 million for the first nine months of 2011 from
$125.6 million for the same period in 2010.
The Bank’s provision for loan losses equaled $2.0 million for
the third quarter of 2011, compared with $6.0 million for the
preceding second quarter, and $4.0 million for the third quarter of
2010. Provision for loan losses totaled $8.8 million for the first
nine months of 2011 versus $19.5 million for the same period in
2010. The Bank’s allowance for loan losses as a percentage of loans
outstanding was 2.83% at September 30, 2011, compared with 2.72% at
June 30, 2011.
Non-interest income decreased to $3.3 million for the 2011 third
quarter from $4.3 million in the third quarter a year ago.
Non-interest income was $9.9 million for the nine-month period
ended September 30, 2011, compared with $11.2 million for the same
period in 2010.
Non-interest expense for the 2011 third quarter was $18.8
million, versus $22.2 million for the same period last year.
Non-interest expense for the first nine months of 2011 was $58.6
million, compared with $57.7 million last year.
The Bank's net interest margin was 4.05% for the quarter ended
September 30, 2011 and 4.19% for the first nine months of 2011.
Net income for the 2011 third quarter increased to $16.0
million, or $121.86 per diluted share, from $12.7 million, or
$96.66 per diluted share, in the year-ago period. The Bank’s net
income for the first nine months of 2011 rose to $45.3 million, or
$346.24 per diluted share, from $37.7 million, or $287.90 per
diluted share, for the same period in 2010.
Balance Sheet
At September 30, 2011, net loans totaled $2.00 billion,
approximately the same when compared with the end of 2010. The
Bank’s deposits totaled $3.24 billion at the end of the 2011 third
quarter, compared with $3.00 billion at December 31, 2010.
Non-interest bearing deposits represented 35.0% of total deposits
at September 30, 2011, versus 33.4% of total deposits at December
31, 2010. Total assets increased to $4.51 billion at the close of
the 2011 third quarter, compared with $4.26 billion at the close of
the prior year.
At September 30, 2011, Farmers & Merchants Bank remained
“well-capitalized” under all regulatory categories, with a total
risk-based capital ratio of 28.57%, a Tier 1 risk-based capital
ratio of 27.31%, and a Tier 1 leverage ratio of 14.69%. The minimum
ratios for capital adequacy for a well-capitalized bank are 10.00%,
6.00% and 5.00%, respectively.
“Farmers & Merchants has cultivated a reputation of strength
and stability for more than a century, and upholding that
reputation with a strong balance sheet, as reflected in our third
quarter, is absolutely imperative,” said Daniel Walker, president
and chairman of the board. “Our ‘well-capitalized’ status is a
testament to the solid fundamentals that have been core to the
bank’s philosophy since its inception in 1907.”
About Farmers & Merchants Bank of Long Beach
Farmers & Merchants Bank of Long Beach provides personal and
business banking services through 22 offices in Los Angeles and
Orange Counties. Founded in 1907 by C.J. Walker, the Bank
specializes in commercial and small business banking along with
business loan programs.
FARMERS & MERCHANTS BANK OF LONG
BEACH
Balance Sheets (unaudited)
(in thousands)
Sept. 30, 2011
Dec. 31, 2010
Assets Cash and due from banks: Noninterest-bearing
balances $ 66,432 $ 49,628 Interest-bearing balances 350,731 48,509
Investment securities 1,932,172 1,977,343 Gross loans 2,062,960
2,070,493 Less allowance for loan losses (58,315 ) (55,627 ) Less
unamortized deferred loan fees, net (489 ) (426 ) Net loans
2,004,156 2,014,440 Bank premises and equipment
52,380 51,650 Other real estate owned 32,106 37,300 Accrued
interest receivable 16,037 17,134 Deferred tax asset 28,067 27,032
Other assets 27,460 39,370
Total assets
$ 4,509,541 $ 4,262,406
Liabilities and stockholders' equity
Liabilities: Deposits: Demand, non-interest bearing $
1,131,461 $ 1,004,272 Demand, interest bearing 274,612 261,961
Savings and money market savings 894,163 754,446 Time deposits
936,484 983,314 Total deposits 3,236,720 3,003,993
Securities sold under agreements to repurchase 596,705 628,192
Accrued interest payable and other liabilities 13,369 7,141
Total liabilities 3,846,794
3,639,326 Stockholders' Equity:
Common Stock, par value $20; authorized250,000 shares; issued and
outstanding130,928 shares 2,619 2,619 Surplus 12,044 12,044
Retained earnings 638,945 601,861 Other comprehensive income 9,139
6,556
Total stockholders' equity
662,747 623,080 Total liabilities
and stockholders' equity $ 4,509,541
$ 4,262,406
FARMERS & MERCHANTS BANK OF LONG
BEACH
Income Statements (unaudited)
(in thousands)
Three Months Ended
Sept. 30, Nine Months
Ended Sept. 30, 2011
2010 2011
2010 Interest income: Loans $ 28,892 $
29,144 $ 86,728 $ 87,132 Securities held to maturity 11,997 11,709
37,431 35,796 Securities available for sale 3,521 3,320 10,862
11,355 Deposits with banks 162 204 273 689 Total interest income
44,572 44,377 135,294 134,972
Interest expense:
Deposits 1,971 2,379 6,211 7,780 Securities sold under agreement to
repurchase 373 520 1,241 1,595 Total interest expense 2,344 2,899
7,452 9,375 Net interest income 42,228 41,478 127,842 125,597
Provision for loan losses 2,000 4,000 8,750 19,450
Net int. income after provision for loan losses 40,228 37,478
119,092 106,147
Non-interest income: Service charges
on deposit accounts 1,281 1,264 3,633 3,833 Gains on sale of
securities 95 - 103 870 Merchant bankcard fees 348 328 903 923
Escrow fees 227 276 704 602 Other 1,301 2,382 4,548 4,985 Total
non-interest income 3,252 4,250 9,891 11,213
Non-interest
expense: Salaries and employee benefits 10,925 9,845 31,963
30,535 FDIC and other insurance expense 1,208 1,227 3,029 3,616
Occupancy expense 1,464 1,611 4,127 4,230 Equipment expense 1,381
1,309 4,112 3,757 Other real estate owned expense, net 318 5,564
2,360 6,819 Legal and professional fees 962 734 2,575 1,747
Marketing and promotional expense 933 784 2,838 2,312 Printing and
supplies 171 187 653 613 Postage and delivery 256 288 778 856 Other
1,179 641 6,128 3,210 Total non-interest expense 18,797 22,190
58,563 57,695 Income before income tax expense 24,683 19,538
70,420 59,665
Income tax expense 8,729 6,882 25,088
21,971
Net income $ 15,954 $
12,656 $ 45,332 $ 37,694
Basic and diluted earnings per common share $ 121.86 $ 96.66 $
346.24 $ 287.90
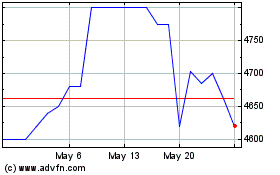
Farmers and Merchants Bank (QX) (USOTC:FMBL)
Historical Stock Chart
From Feb 2025 to Mar 2025

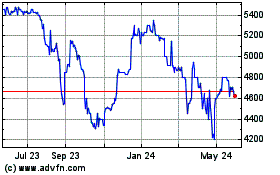
Farmers and Merchants Bank (QX) (USOTC:FMBL)
Historical Stock Chart
From Mar 2024 to Mar 2025
