TIDMBOR
RNS Number : 8894N
Borders & Southern Petroleum plc
28 September 2023
28 September 2023
Borders & Southern Petroleum plc
("Borders & Southern" or "the Company")
Unaudited Results for the six-month period ended 30 June
2023
Borders & Southern Petroleum plc (AIM: BOR) announces its
unaudited half year financial statements for the six months to 30
June 2023. The accounts contained within this report represent the
consolidation of Borders & Southern Petroleum plc and its
subsidiary, Borders & Southern Falkland Islands Limited.
Highlights
   --   Operating loss for the period was $558,000 (2022: $857,000)
   --   Cash balance on 30 June 2023 was $2.4 million (30 June 2022:  $1.2 million)
An updated investor presentation will be uploaded to the
Company's website.
For further information, please visit www.bordersandsouthern.com
or contact:
 Borders & Southern Petroleum       Tel: 020 7661 9348
  plc
  Howard Obee, Chief Executive
 Strand Hanson Limited (Nominated   Tel: 020 7409 3494
  Adviser)
  Ritchie Balmer / James Bellman
 SP Angel Corporate Finance LLP     Tel: 020 3470 0470
  (Broker)
  Richard Hail / Adam Cowl
 Tavistock (Financial PR)           Tel: 020 7920 3150
  Simon Hudson / Nick Elwes
Notes to Editors:
Borders & Southern Petroleum plc (AIM: BOR) is an oil &
gas exploration company listed on the AIM Market of the London
Stock Exchange. The Company operates and has a 100% interest in
three Production Licences in the South Falkland Basin covering an
area of nearly 10,000 square kilometres. The Company has acquired
2,517 square kilometres of 3D seismic and drilled two exploration
wells, making a significant gas condensate discovery with its first
well.
Chief Executive's Statement
The Company incurred a loss from operations for the six-month
period up to 30 June 2023 of $0.55 million (30 June 2022: $0.857
million). The Company's cash balance as of 30 June 2023 was $2.4
million (30 June 2022: $1.2 million). The cash balance reflects the
funds raised through a conditional Placing and Subscription
Agreement, initiated in the last quarter of 2022, and approved by
shareholders at a General Meeting in January 2023. Most of these
funds are held in a sterling treasury account. The Company
continues to be debt-free.
Global oil and gas prices have remained resilient throughout the
year. Brent crude has been trading within the range $70-$90, and
there are no obvious signs that it will weaken in the immediate
future.
As reported earlier in the year, the Company has been sharing
details of its technical and commercial work with potential
industry collaborators. This work highlights that, following
successful appraisal test results, a phased development of the
Darwin gas condensate discovery in the South Falkland Basin would
be economically attractive. This activity continues.
The Company's current project work is focused on technical and
commercial sensitivities associated with its initial three well,
phased development scheme for Darwin. This includes assessing
variations in production volumes that could allow us to take
advantage of FPSO vessels that are available for redeployment. All
our efforts continue to be focused on reducing project risks,
shortening cycle time, and advancing Darwin's monetisation.
CONSOLIDATED STATEMENT OF COMPREHENSIVE INCOME
For the six months ended 30 June 2023
                                                    6 months        6 months       12 months
                                                       ended           ended           ended
                                                     30 June         30 June
                                                        2023            2022     31 Dec 2022
                                                 (unaudited)     (unaudited)       (audited)
                                     N otes             $000            $000            $000

  Administrative expenses                              (603)           (747)         (1,229)
                                             ---------------  --------------  --------------

  LOSS FROM OPERATIONS                                 (603)           (747)         (1,229)

  Finance income                       3                  45               -           (172)
  Finance costs                        3                   -           (110)              42

  LOSS BEFORE TAX                                      (558)           (857)         (1,359)
                                                           -               -               -
    Tax expense
  LOSS FOR THE PERIOD AND TOTAL
   COMPREHENSIVE LOSS FOR THE
   PERIOD ATTRIBUTABLE TO EQUITY
   OWNERS OF THE PARENT                                (558)           (857)         (1,359)
                                             ===============  ==============  ==============

  Loss per share - basic and           2              (0.08)          (0.15)    (0.26) cents
   diluted                                             cents           cents
CONSOLIDATED STATEMENT OF FINANCIAL POSITION
At 30 June 2023
                                                      At              At              At
                                                 30 June         30 June     31 December
                                                    2023            2022            2022
                                             (unaudited)     (unaudited)       (audited)
                                                    $000            $000            $000
  ASSETS

   NON-CURRENT ASSETS
  Property, plant and equipment                        7         9                     -
  Intangible assets                              293,378         293,064         293,244
                                         ---------------  --------------  --------------
  Total non-current assets                       293,385         293,073         293,244

    CURRENT ASSETS
  Other receivables                                  494             383             576
  Cash and cash equivalents                        2,410           1,207           2,707
                                         ---------------  --------------  --------------

    TOTAL CURRENT ASSETS                        2,904              1,590           3,283

    TOTAL ASSETS                                 296,289         294,663         296,527
                                         ===============  ==============  ==============

  LIABILITIES
   CURRENT LIABILITIES
  Trade and other payables                         (105)           (287)           (565)
                                         ---------------  --------------  --------------
  TOTAL LIABILITIES                                (105)           (287)           (565)

  TOTAL NET ASSETS                               296,184         294,376         295,962
                                         ===============  ==============  ==============

  EQUITY
  Share capital                                   11,160           9,833          10,718
  Share premium                                  310,527         308,993         310,195
   Other reserve                                   1,788           1,778           1,778
  Retained deficit                              (27,271)        (26,212)        (26,713)
  Foreign currency reserve                          (20)            (16)            (16)


    TOTAL EQUITY                                 296,184         294,376         295,962
                                         ===============  ==============  ==============
CONSOLIDATED STATEMENT OF CHANGES IN EQUITY
For the six months ended 30 June 2023
                                                                          Foreign
                                            Share              Retained   currency
                            Share capital   premium   Other     Deficit   reserve    Total
                                                      reserve
                                 $000        $000      $000      $000       $000      $000
Unaudited
Balance at 1 January 2023          10,718   310,195     1,778  (26,713)       (16)  295,962
Total comprehensive loss
 for the period                         -         -         -     (558)        (4)    (562)
Issue of shares                       442       332        10         -          -      784
Balance at 30 June 2023            11,160   310,527     1,788  (27,271)       (20)  296,184
                            =============  ========  ========  ========  =========  =======


Unaudited
Balance at 1 January 2022   8,530  308,602  1,778  (25,355)  (16)  294,561
Total comprehensive loss
 for the period                 -        -      -     (857)     -    (446)
Share Placement             1,303      391                           1,693
                            -----  -------  -----  --------  ----  -------
Balance at 30 June 2022     9,832  308,993  1,778  (26,213)  (16)  294,376
                            =====  =======  =====  ========  ====  =======


Audited
Balance at 1 January 2022    8,530  308,602  1,778  (25,354)  (16)  293,540
Total comprehensive loss
 for the year                    -        -      -   (1,359)     -  (1,359)
Share Issue                  2,188    1,593      -         -     -    3,781
Balance at 31 December
 2022                       10,718  310,195  1,778  (26,713)  (16)  295,962
                            ======  =======  =====  ========  ====  =======
CONSOLIDATED STATEMENT OF CASH FLOWS
For the six months ended 30 June 2023
                                                                             12 months
                                               6 months
                                                  ended        6 months          ended
                                                                           31 December
                                           30 June 2023           ended           2022
                                                           30 June 2022
                                            (unaudited)     (unaudited)      (audited)
 Cash flow from operating                             $               $              $
  activities
 Loss before tax
  Adjustments for:                                (558)           (857)        (1,359)
 Depreciation                                         -              13             22
 Finance costs                                        -             110            172
 Cash flows used in operating
  activities                                      (558)           (734)        (1,165)

 Decrease/ (increase) in
  trade and other receivables                        82           (200)          (393)
 (Decrease)/ increase in
  trade and other payables                        (460)             161            452
 Net cash outflow from
  operating activities                            (936)           (773)        (1,106)

  Cash flows used in investing
   activities
  Purchase of tangibles
   fixed assets                                     (7)               -              -
  Purchase of intangible
   fixed assets                                   (134)           (318)          (498)
  Net cash used in investing
   activities                                     (141)           (318)          (498)

  Cash flows from financing
   activities
  Lease payments                                      -           (110)           (13)
  Share issue                                       784           1,693          3,781
  Net cash generated from
   financing activities                             784           1,583          3,768
  Net (decrease)/ increase
   in cash and cash equivalents                   (293)             492          2,164

  Cash, cash equivalents
   and restricted use cash
   at the beginning of the
   period                                         2,707             714            714
  Exchange gains on cash
   and cash equivalents                             (4)               1          (172)
                                        ---------------  --------------  -------------
  Cash, cash equivalents
   and restricted use cash
   at the end of the period                       2,410           1,207          2,707
                                        ---------------  --------------  -------------
NOTES TO THE UNAUDITED CONSOLIDATED INTERIM FINANCIAL
STATEMENTS
For the six months ended 30 June 2023
1. Basis of preparation
The unaudited condensed consolidated interim financial
statements have been prepared using the recognition and measurement
principles of International Accounting Standards, International
Reporting Standards and Interpretations as applied in accordance
with the provisions of the Companies Act 2006. The Group has not
elected to comply with IAS 34 "Interim Financial Reporting" as
permitted. The principal accounting policies used in preparing the
interim financial statements are unchanged from those disclosed in
the Group's Annual Report for the year ended 31 December 2022 and
are expected to be consistent with those policies that will be in
effect at the year end.
The condensed financial statements for the six months ended 30
June 2023 and 30 June 2022 are unreviewed and unaudited. The
comparative financial information does not constitute statutory
financial statements as defined by Section 435 of the Companies Act
2006. The comparative financial information for the year ended 31
December 2022 is not the company's full statutory accounts for that
period. A copy of those statutory financial statements has been
delivered to the Registrar of Companies. The auditors' report on
those accounts was unqualified and did include references to any
matters to which the auditors drew attention by way of emphasis
relating to going concern without qualifying their report and did
not contain a statement under section 498(2)-(3) of the Companies
Act 2006.
For the six-month reporting period up until 30 June 2023,
Borders & Southern had a loss from operations of $558,000 (a
loss for the same period in 2022 was $857,000). Administrative
expenses were $603,000 (2022: $747,000). The cash balance at the 30
June 2023 was $2.41 million compared with a balance of $1.20
million at 30 June 2022. The Company has no debt.
2. LoSS per share
The calculation of the basic loss per share is based on the loss
attributable to ordinary shareholders divided by the weighted
average number of shares in issue during the period. Diluted loss
per share is not stated as the result would be ant-dilutive given
the loss in the period.
                                     Loss after
                                        tax for          Weighted         Loss
                                     the period    average number    per share
                                           $000         of shares      (cents)
 Basic and diluted

 Six months ended 30 June 2023
  (unaudited)                             (558)       730,814,138       (0.08)

 Six months ended 30 June 2022
  (unaudited)                             (857)       587,957,318       (0.15)

 Twelve months ended 31 December
  2022 (audited)                        (1,359)       596,766,841       (0.26)
3. FINANCE INCOME AND COSTS
                                6 months   6 months      12 months
                                                             ended
                                   ended      ended    31 December
                                 30 June    30 June           2022
                                    2023       2022           $000
                                    $000       $000
 Finance Income
  Bank interest receivable             9          -              -
 Foreign exchange gain                36          -          (172)

   Finance costs
   Foreign exchange loss               -      (110)              -
   Interest on leased assets           -          -              -
                               ---------  ---------  -------------
                                      45      (110)          (172)
                               =========  =========  =============
4. Going Concern
The Company regularly assesses its liquidity and available funds
to ensure that it has sufficient funds available to cover costs for
at least the following 12 months. This remained the case at 30 June
2023.
-ends-
This information is provided by RNS, the news service of the
London Stock Exchange. RNS is approved by the Financial Conduct
Authority to act as a Primary Information Provider in the United
Kingdom. Terms and conditions relating to the use and distribution
of this information may apply. For further information, please
contact rns@lseg.com or visit www.rns.com.
RNS may use your IP address to confirm compliance with the terms
and conditions, to analyse how you engage with the information
contained in this communication, and to share such analysis on an
anonymised basis with others as part of our commercial services.
For further information about how RNS and the London Stock Exchange
use the personal data you provide us, please see our Privacy
Policy.
END
IR FLFSEATIDFIV
(END) Dow Jones Newswires
September 28, 2023 02:00 ET (06:00 GMT)
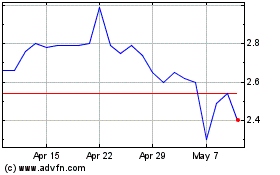
Borders & Southern Petro... (LSE:BOR)
Historical Stock Chart
From Dec 2024 to Jan 2025

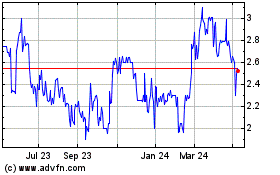
Borders & Southern Petro... (LSE:BOR)
Historical Stock Chart
From Jan 2024 to Jan 2025
